HAL Id: hal-01875935
https://hal.sorbonne-universite.fr/hal-01875935
Submitted on 18 Sep 2018
HAL is a multi-disciplinary open access
archive for the deposit and dissemination of
sci-entific research documents, whether they are
pub-lished or not. The documents may come from
teaching and research institutions in France or
abroad, or from public or private research centers.
L’archive ouverte pluridisciplinaire HAL, est
destinée au dépôt et à la diffusion de documents
scientifiques de niveau recherche, publiés ou non,
émanant des établissements d’enseignement et de
recherche français ou étrangers, des laboratoires
publics ou privés.
Distributed under a Creative Commons Attribution| 4.0 International License
metabolomics and pathway analysis
Abdellah Tebani, Lénaïg Abily-Donval, Isabelle Schmitz-Afonso, Bénédicte
Heron, Monique Piraud, Jérome Ausseil, Farid Zerimech, Bruno Gonzalez,
Stéphane Marret, Carlos Afonso, et al.
To cite this version:
Abdellah Tebani, Lénaïg Abily-Donval, Isabelle Schmitz-Afonso, Bénédicte Heron, Monique
Pi-raud, et al.. Unveiling metabolic remodeling in mucopolysaccharidosis type III through integrative
metabolomics and pathway analysis. Journal of Translational Medicine, BioMed Central, 2018, 16,
pp.248. �10.1186/s12967-018-1625-1�. �hal-01875935�
RESEARCH
Unveiling metabolic remodeling
in mucopolysaccharidosis type III
through integrative metabolomics and pathway
analysis
Abdellah Tebani
1,2,3, Lenaig Abily‑Donval
2,4, Isabelle Schmitz‑Afonso
3, Bénédicte Héron
5, Monique Piraud
6,
Jérôme Ausseil
7, Farid Zerimech
8, Bruno Gonzalez
2, Stéphane Marret
2,4, Carlos Afonso
3and Soumeya Bekri
1,2*Abstract
Background: Metabolomics represent a valuable tool to recover biological information using body fluids and may
help to characterize pathophysiological mechanisms of the studied disease. This approach has not been widely used to explore inherited metabolic diseases. This study investigates mucopolysaccharidosis type III (MPS III). A thorough and holistic understanding of metabolic remodeling in MPS III may allow the development, improvement and per‑ sonalization of patient care.
Methods: We applied both targeted and untargeted metabolomics to urine samples obtained from a French cohort
of 49 patients, consisting of 13 MPS IIIA, 16 MPS IIIB, 13 MPS IIIC, and 7 MPS IIID, along with 66 controls. The analytical strategy is based on ultra‑high‑performance liquid chromatography combined with ion mobility and high‑resolution mass spectrometry. Twenty‑four amino acids have been assessed using tandem mass spectrometry combined with liquid chromatography. Multivariate data modeling has been used for discriminant metabolite selection. Pathway analysis has been performed to retrieve metabolic pathways impairments.
Results: Data analysis revealed distinct biochemical profiles. These metabolic patterns, particularly those related to
the amino acid metabolisms, allowed the different studied groups to be distinguished. Pathway analysis unveiled major amino acid pathways impairments in MPS III mainly arginine–proline metabolism and urea cycle metabolism.
Conclusion: This represents one of the first metabolomics‑based investigations of MPS III. These results may shed
light on MPS III pathophysiology and could help to set more targeted studies to infer the biomarkers of the affected pathways, which is crucial for rare conditions such as MPS III.
Keywords: Metabolomics, Inborn errors of metabolism, Mucopolysaccharidosis type III, Lysosomal storage diseases,
Mass spectrometry, Ion mobility
© The Author(s) 2018. This article is distributed under the terms of the Creative Commons Attribution 4.0 International License
(http://creat iveco mmons .org/licen ses/by/4.0/), which permits unrestricted use, distribution, and reproduction in any medium,
provided you give appropriate credit to the original author(s) and the source, provide a link to the Creative Commons license,
and indicate if changes were made. The Creative Commons Public Domain Dedication waiver (http://creat iveco mmons .org/
publi cdoma in/zero/1.0/) applies to the data made available in this article, unless otherwise stated.
Open Access
*Correspondence: soumeya.bekri@chu‑rouen.fr
1 Department of Metabolic Biochemistry, Rouen University Hospital, 76000 Rouen Cedex, France
Background
Metabolism is a complex, interconnected and finely regu-lated network. It is composed of reactions biochemical processes that transform endogenous or exogenous sub-strates into vital products for cell, tissue and organism function. As a result, deregulation of this homeostasis underlies the pathophysiological mechanisms of differ-ent diseases [1]. An alteration of a metabolic pathway may be related to nutritional, environmental, or genetic factors. Inborn errors of metabolism (IEM) are rare dis-eases mainly due to a genetic defect enzymes or cofac-tors involved in a metabolic pathway or in intra- or intercellular metabolites. For better management of IEM patients, rapid and accurate biochemical and molecu-lar tests are needed. Omics are very appealing to speed up both their molecular understanding and may lead to more efficient biomarkers. Omics are very appealing to achieve holistic and systemic aspects of diseases [1]. The metabolome refers to all metabolites present in a given biological system [2]. Metabolomics is an “omics” tech-nology that allows metabolome characterization [3, 4]. Metabolomics is particularly interesting in exploring IEM given their intrinsic with metabolism [5]. Lysoso-mal storage diseases (LSD) represent a group of about 50 inherited disorders related to deficient lysosomal proteins. This impairment leads to a progressive accu-mulation of metabolites or macromolecules within the lysosomales. This storage causes, at least partly, various organ failures [6]. Mucopolysaccharidoses (MPS) are a subgroup of LSD. They are related to impaired catabo-lism of glycosaminoglycans (GAGs), chondroitin sulfate (CS), dermatan sulfate (DS), heparan sulfate (HS), kera-tan sulfate (KS), and hyaluronan, leading to GAG accu-mulation in the lysosomes and extracellular matrix [7]. This accumulation leads to multiple progressive tissue and organ failures [8]. Seven distinct forms of MPS are described and related to 11 known enzyme deficiencies [6]. Overall incidence is more than 1 in 30,000 live births [9]. Most MPS patients are asymptomatic after birth, but prenatal symptoms may be observed in MPS I, MPS IVA, MPS VI and more frequently in MPS VII. Depending on the patient and the MPS subtype, symptoms and severity may vary. Different MPS treatments are either in clinical use or under clinical trials [10]. Mucopolysaccharido-sis type III (MPS III), or Sanfilippo syndrome, is caused by a congenital deficiency of one of the four enzymes involved in the degradation of HS [11]. Four subtypes, MPS IIIA, MPS IIIB, MPS IIIC and MPS IIID, have an autosomal recessive inheritance [12]. Typically, patients with Sanfilippo disease present with no obvious clinical features prior to age 1–3 age years. Growth parameters may be higher compared to the reference range in the first years of life, while a growth delay may be observed
in older patients. In all MPS III subtypes, central nerv-ous system (CNS) involvement predominates (neurode-generation, hyperactivity and behavioral disturbances) with less pronounced skeletal abnormalities and orga-nomegaly. In addition, the clinical picture includes hir-sutism, coarse facial features, cardiomegaly, thick hair, cloudy cornea, recurrent diarrhea, otitis and dysarthria [12–15]. MPS IIIA is the most severe type with an ear-lier onset and a rapid neurological deterioration. The first signs occur at around 1–3 years of age and the clini-cal symptoms worsen gradually and inevitably, resulting in the onset of severe dementia and a complete loss of motor functions. As other inherited metabolic diseases, the symptoms show high variability among patients even within the same family. Patients usually die before the third decade of life, although patients with a mild phenotype and allelic heterogeneity have been reported [12–15]. MPS IIIA (OMIM #252900) is caused by Hep-arane-N-sulfatase (SGSH, EC 3.10.1.1) deficiency with an incidence of 1 in 100,000 [16, 17]. MPS IIIB (OMIM #252920) is due to N-acetyl-α-glucosaminidase (NAGLU, EC 3.2.1.50) deficiency with an incidence of 1 in 200,000 [18]. MPS IIIC (OMIM #252930) is caused by heparan acetylCoA: α-glucosaminide-N-acetyltransferase (HGS-NAT, EC 2.3.1.3) deficiency with an incidence of 1 in 1,500,000 [19]. MPS IIID (OMIM #252940) is due to
N-acetylglucosamine-6-sulfatase (GNS, EC 3.1.6.14)
defi-ciency with an incidence of 1 in 1,000,000 [20]. So far, no specific approved treatment is available. Gene therapy [21], bone marrow transplant [22], chaperon molecules [23], substrate deprivation therapy [24] and intrathecal enzyme therapy [25] are among the most active thera-peutic research areas. The goal of this work is to apply both targeted and untargeted metabolomics on MPS IIIA, MPS IIIB, MPS IIIC and MPS IIID patients, com-pared to controls, to investigate metabolic changes in these conditions.
Methods
Urine samples
Random urine samples were collected from patients with a confirmed MPS diagnosis. Urine samples were col-lected within five expert centers for inherited metabolic diseases in France. The 49 untreated MPS III patients were evaluated as follows: 13 MPS IIIA patients: 6 males (age range from 5.1 to 12.0 years, mean age 6.2 years) and 7 females (age range from 1.9 to 18.4 years, mean age: 6.8 years); 16 MPS IIIB patients: 7 males (age range from 3.8 to 9.8 years, mean age 7.2 years) and 9 females (age range from 2.9 to 11.7 years, mean age 6.3 years); 13 MPS IIIC patients: 7 males (age range from 6.4 to 20.6 years, mean age:12.1 years) and 6 females (age range from 2.8 to 31.1 years, mean age 10.0 years); 7 MPS IIID patients:
3 males (age range from 3.8 to 17.5 years, mean age 8.9 years) and 4 females (age range from 3.4 to 18.7 years, mean age 7.8 years). Moreover, control urine samples were also collected from 66 healthy subjects, 27 males and 39 females (age range from 5.5 to 70 years, mean age 40.8 years). This project was approved by the Research Ethics Board of Rouen University Hospital (CERNI E2016-21).
Metabolic phenotyping
The protocol used in this study has been previously described [26]. Briefly, urine samples were processed by transferring 200 μL of urine to 1.5 mL tubes and cen-trifuging at 4 °C for 10 min at 13,000g; then 100 µL of ultrapure water was added to 100 µL of supernatant and mixed. For untargeted metabolomics data acquisition, Ultraperformance liquid chromatography–ion mobil-ity mass spectrometry on a Synapt G2 HDMS (Waters, Saint-Quentin-en-Yvelines, France) mass spectrometer as previously described [27]. Regarding targeted analy-sis, free amino acid profiles in urine was based on liquid chromatography coupled to a tandem mass spectrom-etry. Detailed protocols are presented in the Additional file 1.
Data analysis
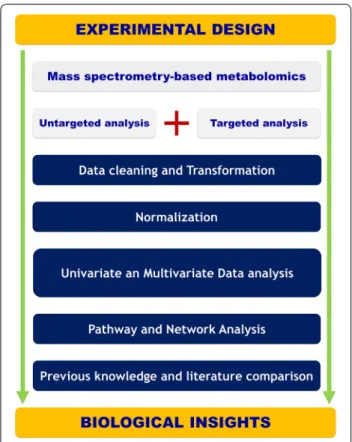
A one-way analysis of variance (ANOVA) test was applied for multiple groups testing while a t test is used for binary comparisons. The Benjamini and Hochberg false discovery rate (FDR) method was used for multi-ple testing corrections with an FDR cut-off level of 5%. A Receiver operating characteristic curve (ROC) has been used to assess the diagnostic performance of the cho-sen classifiers. Support vector regression normalization for untargeted metabolomics data [28]. The normalized data has been log-transformed and pareto-scaled. All data modeling and analysis is done using SIMCA 15.0 (MKS DAS, Umeå, Sweden) and R software. The Mum-michog algorithm has been used for pathway analysis [29] while MetaboAnalyst has been used for Metabolite Set Enrichment Analysis on the amino acid data [30]. Details regarding data modeling and validation results from all models are provided in Additional file 1. Figure 1
presents an overview of the implemented metabolomics workflow.
Results
Untargeted analysis
The heatmap in Fig. 2a depicts the top 100 features ranked by ANOVA (p < 0.05 cut-off and FDR 5%). The results highlight correct clustering of the different sam-ple groups and the dendrogram structure, using Euclid-ean distance, shows two main clusters of variables. We
applied principal component analysis (PCA) to further analyze the underlying differential metabolic profiles. A three-component PCA model accounting for 18% of the total variance has been built. Trends, groups and poten-tial outliers within the data are investigated using score plots. For predictive classification purposes, supervised methods are used since they allow the accurate mod-eling of the relationship between controls, MPS IIIA, IIIB, IIIC and IIID samples. First, an OPLS-DA classi-fication was applied to the whole dataset. Samples were labeled according to the corresponding groups, MPS IIIA, IIIB, IIIC, IIID and control (Fig. 2b, c). A negative Q2 regression line intercept resulting from the permu-tation test allows the cross-validation of OPLSDA mod-els. The final model had an R2 = 0.77 and Q2 = 0.13. The OPLS-DA scores plots (Fig. 2b) shows a clear sep-aration, suggesting that the OPLS-DA model success-fully classified samples according to their respective metabolic profiles. Model validation is assessed both by CV-ANOVA (p-value = 3 × 10⁻²) and by the
permuta-tion test (999 permutapermuta-tions gave a negative Q2 inter-cept). Details regarding model validation are shown in Additional file 1: Fig. S3). Furthermore, separate binary OPLS-DA classification models have been built for
Fig. 1 Illustration of the experimental workflow spanning from
experimental design and data acquisition to pathway analysis and biological interpretation
each disease sample vs control. For control and MPS IIIA samples the model had one predictive and two orthogonal components, and its validation parameters were as follows: R2 = 0.89, Q2 = 0.23 and CV-ANOVA
p-value = 2.84 × 10⁻³ (Additional file 1: Fig. S4). The
corresponding score plot is shown in Fig. 2d. It shows a clear separation between the two classes on the pre-dictive component. For MPSIIIB and control sam-ples the model had one predictive and two orthogonal components model with R2 = 0.89, Q2 = 0.21 and CV-ANOVA p-value = 5.28 × 10⁻³ (Fig. 2e). For MPSIIIC
and control samples, the model has one predictive and three orthogonal components with R2 = 0.98, Q2 = 0.39 and CV-ANOVA p-value = 1.35 × 10⁻⁵ (Fig. 2f).
Another OPLS-DA model was built for MPSIIID and control samples with one predictive and two orthogo-nal components model with R2 = 0.95, Q2 = 0.36 and CV-ANOVA p-value = 1.83 × 10⁻⁵ (Fig. 2g). To select
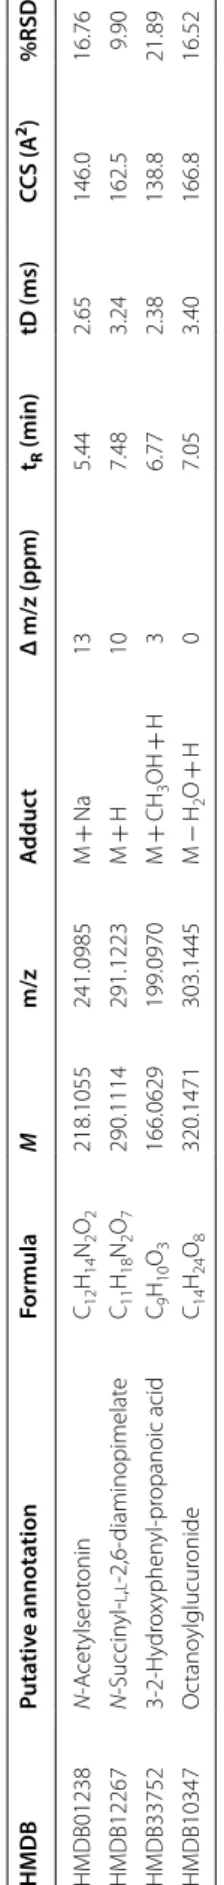
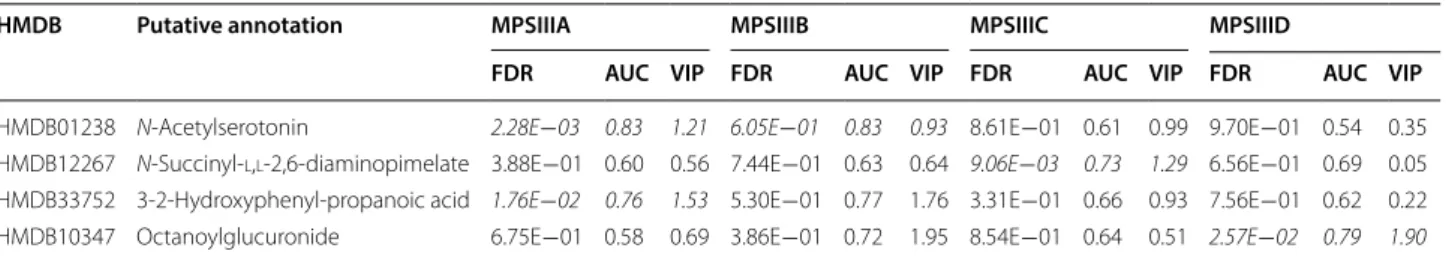
discriminant variables, their respective VIP scores for each validated OPLS-DA model have been used. Based on 1 as a cutoff value, 25 features out of 854 were selected for the MPSIIIA VS Control model, 243 for MPSIIIB vs control, 247 for MPS IIIC vs control and 262 for the MPSIIID vs control model. The variables lists have been refined by retaining only the most discri-minant variables and their putative annotation. The list included N-acetylserotonin, N-succinyl-l,l-2,6-diami-nopimelate, octanoylglucuronide and 3-2-hydroxyphe-nyl-propanoic acid. These discriminant variables are depicted in Tables 1 and 2 with their respective statisti-cal metrics and annotation. Boxplots of the main discri-minant features are presented in Additional file 1: Fig. S7. Using the area under the ROC curves (AUC), the discriminant performances of these features are also investigated. N-Acetylserotonin has the highest AUC for MPS IIIA (AUC = 0.83) and MPS IIIB (AUC = 0.83).
N-Succinyl-l,l-2,6-diaminopimelate has the
high-est AUC (0.73) for MPS IIIC and octanoylglucuron-ide performed best for MPS IIID with an AUC = 0.79. The results are shown in Tables 1 and 2. Furthermore, the underlying impaired pathways in each disease are explored using Mummichog. The results are shown in
Table 3. Interestingly, amino acid metabolisms and fatty acid pathways were markedly dysregulated.
Targeted analysis
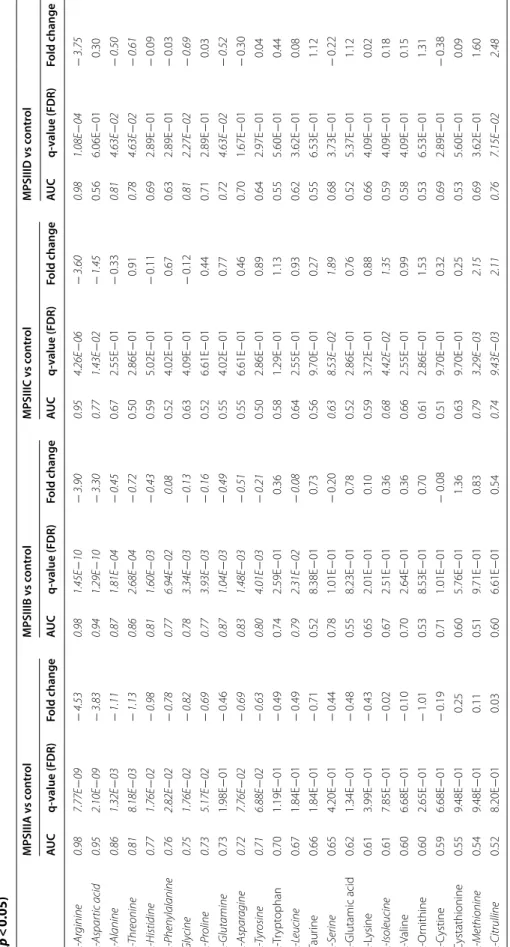
We also quantified twenty-four amino acids and Addi-tional file 1: Table S4 presents their absolute urine concentrations. Boxplots of normalized amino acid con-centrations are shown in Additional file 1: Fig. S8 and the statistical metrics are presented in Table 4. MPS IIIA yielded 11 significantly changed amino acids compared to controls: arginine, aspartic acid, alanine, threonine, histidine, phenylalanine, glycine, proline, asparagine and tyrosine. For MPS IIIB vs control, arginine, aspartic acid, alanine, threonine, histidine, phenylalanine, glycine, pro-line, glutamine, asparagine, tyrosine and leucine showed significant differences. regarding MPS IIIC vs control, 6 amino acids showed differences: arginine, aspartic acid, serine, isoleucine, methionine and citrulline. For MPS IIID vs control, 6 amino acids showed differences: argi-nine, alaargi-nine, threoargi-nine, glycine, glutamine and citrulline. To holistically determine the amino acid profile differ-ences between controls and each of the MPS III subtype patients, the amino acids concentrations were assessed using an ANOVA test. The analysis yielded 17 amino acids above the p < 0.05 cut-off (FDR 5%). A hierarchical clustering analysis was applied to group samples accord-ing to their profile similarities. The heatmap in Fig. 3a represents the 24 amino acids ranked by ANOVA. The results show that all samples belonging to the same group were correctly clustered. The dendrogram structure, using Euclidean distance, highlights two main clusters of variables. Furthermore, a correlation analysis has been performed. Figure 3b–e presents the heatmap of the cor-relation analysis for MPS IIIA, MPS IIIB, MPS IIIC and MPS IIID, respectively. Both figures show a clear cluster of variables that have high correlation. Figure 3b (MPS IIIA vs control) shows a main cluster including alanine, leucine, valine, glycine, tyrosine, threonine, isoleucine, histidine, lysine, tryptophan, serine, asparagine, glu-tamine, phenylalanine, cystine and methionine. Regard-ing MPS IIIB vs control, Fig. 3c shows two main clusters: the main one includes methionine, isoleucine, serine,
(See figure on previous page.)
Fig. 2 a Hierarchical cluster analysis and heat map visualization of top 100 variables (x‑axis) ranked by ANOVA. The urine sample classes are
represented along the y‑axis. The color code was used to represent log‑scaled intensities of features between − 5 (blue) and + 5 (brown), showing the relative abundance of the features according to the groups. b OPLSDA scores plot (R2 = 0.77, Q2 = 0.13) shows a clear separation between the different diseased and control groups (MPSIIIA, MPSIIIB, MPSIIIC and MPSIIID and control). c OPLSDA scores plot (R2 = 0.93, Q2 = 0.05) shows a clear separation between the different diseased groups (MPSIIIA, MPSIIIB, MPSIIIC and MPSIIIC). d Clear separation between MPSIIIA and control samples is observed (R2 = 0.89, Q2 = 0.23). e Clear separation of MPSIIIB samples from the controls is observed (R2 = 0.89, Q2 = 0.21). f Clear separation of MPSIIIC samples from the controls is observed (R2 = 0.98, Q2 = 0.39). g Clear separation of MPSIIID samples from the controls is observed (R2 = 0.95, Q2 = 0.36). Detailed model characteristics and validation are given in Additional file 1
Table 1 S ome discriminan t f ea tur es , puta tiv ely annota ted , e xtr ac ted b y the diff er en t OPLS -D A mo dels f or MPSIIIA, MPSIIIB , MPSIIIC and MPSIIID M monoisot opic mass , ppm par ts per million, tR ret en tion time , tD dr ift time , CC S cr oss c ollision sec tion, VIP v ar iable impor tanc e in pr ojec tion HMDB Puta tiv e annota tion Formula M m/z A dduc t Δ m/z (ppm) tR (min) tD (ms) CCS (A 2) %RSD HMDB01238 N ‑A cet ylser ot onin C12 H14 N2 O2 218.1055 241.0985 M + Na 13 5.44 2.65 146.0 16.76 HMDB12267 N ‑Succin yl ‑ l , l ‑2,6 ‑diaminopimelat e C11 H18 N2 O7 290.1114 291.1223 M + H 10 7.48 3.24 162.5 9.90 HMDB33752 3‑ 2‑ H ydr ox yphen yl ‑pr opanoic acid C9 H10 O3 166.0629 199.0970 M + CH 3 OH + H 3 6.77 2.38 138.8 21.89 HMDB10347 O ctano ylglucur onide C14 H24 O8 320.1471 303.1445 M − H2 O + H 0 7.05 3.40 166.8 16.52
cystine, lysine, histidine, asparagine, glutamine, threo-nine, tyrosine, glycine, alathreo-nine, leucine, valine, phenyla-lanine, and tryptophan. Regarding MPS IIIC vs control, Fig. 3d shows three clusters: the main one includes cys-tine, lysine, histidine, glycine, alanine, methionine, iso-leucine, serine, glutamine, tryptophan, tyrosine, iso-leucine, valine, asparagine, phenylalanine and threonine. For MPS IIID vs control, Fig. 3e shows two clusters: the main one includes methionine, isoleucine, serine, cystine, lysine, glycine, histidine, tryptophan, leucine, valine, leucine, valine, tyrosine, phenylalanine, asparagine, glutamine
and threonine. To assess the diagnostic performance of the different amino acids, we performed univariate ROC curve analyses for the different MPS III subtype com-pared to controls. For MPS IIIA, there were four amino acids with a high AUC above 0.80, including: arginine (0.98), aspartic acid (0.95), alanine (0.85) and threonine (0.81). The same procedure was performed for MPS IIIB vs control and indicated seven amino acids with a high AUC above 0.80 and these were: arginine (0.98), aspar-tic acid (0.94), Alanine (0.87) and threonine (0.86), his-tidine (0.81), glutamine (0.87), asparagine (0.83). For
Table 2 Statistical and discriminant metrics of the selected annotated features
FDR false discovery rate, AUC area under the curve, VIP variable importance in projection
Significant features are highlighted in italics for control and each disease comparison (false discovery rate FDR = 5%)
HMDB Putative annotation MPSIIIA MPSIIIB MPSIIIC MPSIIID
FDR AUC VIP FDR AUC VIP FDR AUC VIP FDR AUC VIP
HMDB01238 N‑Acetylserotonin 2.28E−03 0.83 1.21 6.05E−01 0.83 0.93 8.61E−01 0.61 0.99 9.70E−01 0.54 0.35
HMDB12267 N‑Succinyl‑l,l‑2,6‑diaminopimelate 3.88E−01 0.60 0.56 7.44E−01 0.63 0.64 9.06E−03 0.73 1.29 6.56E−01 0.69 0.05
HMDB33752 3‑2‑Hydroxyphenyl‑propanoic acid 1.76E−02 0.76 1.53 5.30E−01 0.77 1.76 3.31E−01 0.66 0.93 7.56E−01 0.62 0.22 HMDB10347 Octanoylglucuronide 6.75E−01 0.58 0.69 3.86E−01 0.72 1.95 8.54E−01 0.64 0.51 2.57E−02 0.79 1.90
Table 3 Significantly dysregulated pathways
FDR false discovery rate
Pathway Overlap size p-value (FDR = 5%)
MPS IIIA Vitamin B1 (thiamin) metabolism 2 2.77E−03
Pyrimidine metabolism 2 9.86E−03
MPS IIIB TCA cycle 2 1.41E−03
Aspartate and asparagine metabolism 4 1.81E−03
Vitamin E metabolism 3 3.00E−03
Methionine and cysteine metabolism 3 4.78E−03
Fatty acid activation 2 4.89E−03
Lysine metabolism 2 9.66E−03
De novo fatty acid biosynthesis 2 1.31E−02
Tryptophan metabolism 3 3.31E−02
MPS IIIC Vitamin B1 (thiamin) metabolism 2 5.54E−04
Omega‑3 fatty acid metabolism 2 8.27E−04
Butanoate metabolism 2 1.71E−03
Tryptophan metabolism 3 8.07E−03
Linoleate metabolism 2 1.18E−02
Tyrosine metabolism 3 2.28E−02
Methionine and cysteine metabolism 2 2.60E−02
MPS IIID TCA cycle 2 1.41E−03
Vitamin B1 (thiamin) metabolism 2 1.41E−03
Aspartate and asparagine metabolism 4 3.08E−03
Butanoate metabolism 2 5.14E−03
Carnitine shuttle 2 2.32E−02
Arginine–proline metabolism 2 2.91E−02
Table 4 F old change , t -t est sta tistics , and ar ea under the cur ve ( A UC ) of the rec eiv er op er ating cur ves (R OC ) f or 24 amino acids , fr ee c arnitine and ac ylc arnitines (p < 0.05) Sig nifican t f ea tur es ar e highligh
ted in italics (false disc
ov er y r at e FDR = 5%) MPSIIIA v s c on tr ol MPSIIIB v s c on tr ol MPSIIIC v s c on tr ol MPSIIID v s c on tr ol AUC q-value (FDR) Fold change AUC q-value (FDR) Fold change AUC q-value (FDR) Fold change AUC q-value (FDR) Fold change l -A rginine 0.98 7.77E − 09 − 4.53 0.98 1.45E − 10 − 3.90 0.95 4.26E − 06 − 3.60 0.98 1.08E − 04 − 3.75 l -A spar tic acid 0.95 2.10E − 09 − 3.83 0.94 1.29E − 10 − 3.30 0.77 1.43E − 02 − 1.45 0.56 6.06E − 01 0.30 l -Alanine 0.86 1.32E − 03 − 1.11 0.87 1.81E − 04 − 0.45 0.67 2.55E − 01 − 0.33 0.81 4.63E − 02 − 0.50 l -T hr eonine 0.81 8.18E − 03 − 1.13 0.86 2.68E − 04 − 0.72 0.50 2.86E − 01 0.91 0.78 4.63E − 02 − 0.61 l -Histidine 0.77 1.76E − 02 − 0.98 0.81 1.60E − 03 − 0.43 0.59 5.02E − 01 − 0.11 0.69 2.89E − 01 − 0.09 l -P henylalanine 0.76 2.82E − 02 − 0.78 0.77 6.94E − 02 0.08 0.52 4.02E − 01 0.67 0.63 2.89E − 01 − 0.03 Gly cine 0.75 1.76E − 02 − 0.82 0.78 3.34E − 03 − 0.13 0.63 4.09E − 01 − 0.12 0.81 2.27E − 02 − 0.69 l -P roline 0.73 5.17E − 02 − 0.69 0.77 3.93E − 03 − 0.16 0.52 6.61E − 01 0.44 0.71 2.89E − 01 0.03 l -Glutamine 0.73 1.98E − 01 − 0.46 0.87 1.04E − 03 − 0.49 0.55 4.02E − 01 0.77 0.72 4.63E − 02 − 0.52 l -A spar agine 0.72 7.76E − 02 − 0.69 0.83 1.48E − 03 − 0.51 0.55 6.61E − 01 0.46 0.70 1.67E − 01 − 0.30 l -T yr osine 0.71 6.88E − 02 − 0.63 0.80 4.01E − 03 − 0.21 0.50 2.86E − 01 0.89 0.64 2.97E − 01 0.04 l ‑T rypt ophan 0.70 1.19E − 01 − 0.49 0.74 2.59E − 01 0.36 0.58 1.29E − 01 1.13 0.55 5.60E − 01 0.44 l -L eucine 0.67 1.84E − 01 − 0.49 0.79 2.31E − 02 − 0.08 0.64 2.55E − 01 0.93 0.62 3.62E − 01 0.08 Taur ine 0.66 1.84E − 01 − 0.71 0.52 8.38E − 01 0.73 0.56 9.70E − 01 0.27 0.55 6.53E − 01 1.12 l -S erine 0.65 4.20E − 01 − 0.44 0.78 1.01E − 01 − 0.20 0.63 8.53E − 02 1.89 0.68 3.73E − 01 − 0.22 l ‑Glutamic acid 0.62 1.34E − 01 − 0.48 0.55 8.23E − 01 0.78 0.52 2.86E − 01 0.76 0.52 5.37E − 01 1.12 l ‑L ysine 0.61 3.99E − 01 − 0.43 0.65 2.01E − 01 0.10 0.59 3.72E − 01 0.88 0.66 4.09E − 01 0.02 l -Isoleucine 0.61 7.85E − 01 − 0.02 0.67 2.51E − 01 0.36 0.68 4.42E − 02 1.35 0.59 4.09E − 01 0.18 l ‑V aline 0.60 6.68E − 01 − 0.10 0.70 2.64E − 01 0.36 0.66 2.55E − 01 0.99 0.58 4.09E − 01 0.15 l ‑Or nithine 0.60 2.65E − 01 − 1.01 0.53 8.53E − 01 0.70 0.61 2.86E − 01 1.53 0.53 6.53E − 01 1.31 l ‑C ystine 0.59 6.68E − 01 − 0.19 0.71 1.01E − 01 − 0.08 0.51 9.70E − 01 0.32 0.69 2.89E − 01 − 0.38 Cystathionine 0.55 9.48E − 01 0.25 0.60 5.76E − 01 1.36 0.63 9.70E − 01 0.25 0.53 5.60E − 01 0.09 l -Methionine 0.54 9.48E − 01 0.11 0.51 9.71E − 01 0.83 0.79 3.29E − 03 2.15 0.69 3.62E − 01 1.60 l -Citrulline 0.52 8.20E − 01 0.03 0.60 6.61E − 01 0.54 0.74 9.43E − 03 2.11 0.76 7.15E − 02 2.48
MPS IIIC, the results showed only Arginine with a high AUC (0.95). Regarding MPS IIID, three amino acids showed a high AUC: arginine (0.98), alanine (0.81) and glycine (0.81). The overall univariate and ROC analysis results are shown in Table 4 and Fig. 4. The ROC curves along with a comparison of the different combinations of the main significant amino acids have been performed using PLSDA models with three components each. The results are presented in Additional file 1: Fig. S9. Path-way analysis yielded the main impaired metabolisms. For MPS IIIA vs control and MPS IIIB vs control analy-ses, beta-alanine metabolism, malate–aspartate shuttle, arginine–proline, urea cycle and aspartate metabolism were among the most affected pathways. For the MPS IIIC vs control analysis, methionine metabolism, in addi-tion to the abovemenaddi-tioned metabolic pathways, was the most affected. For the MPS IIID vs control analysis, urea cycle, arginine–proline metabolism, porphyrin metabo-lism and pyrimidine and purine metabometabo-lism were the most affected pathways. The overall results are shown in Fig. 5a–d for all the studied groups.
Discussion
In this study, MPS III urine patterns of metabolites have been studied to unveil the biochemical indicators that may differentiate MPS III patients from control indi-viduals. Of note, the mean-age difference between the studied groups represent a drawback which is mainly due to pediatric recruitment difficulties and ethical considerations. However, given the stringency of the statistical cut-off and the applied multiple testing cor-rection might circumvent some of these biases. Using untargeted metabolomics, we succeeded in building a predictive model with a clear separation between the different studied groups—MPS IIIA, MPS IIIB, MPS IIIC, MPS IIID and control sample—which is under-lined by the metabolic pattern similarity in each group. The retrieved data revealed a profound metabolic mod-eling mainly of amino acid-related metabolism. In light of these results, targeted amino acid analysis has been performed, which confirmed the deep metabolic altera-tions. Using these data, pathway analysis succeeded in identifying the main disrupted pathways. Salazar et al. [31] reported a genome-scale human metabolic recon-struction based approach to understand the effect of metabolism alterations in MPS. This in silico approach applied to MPS III subtypes (MPS IIIA, MPS IIIB,
MPS IIIC and MPS IIID) by silencing, respectively,
SGSH, NAGLU, HGSNAT and GNS genes, allowed the
generation of models which were analyzed through flux balance and variability analysis. We performed a comparative analysis between the in silico systems based analysis data and the pathway analysis results of this present study. This comparison is illustrated by a Venn diagram (Fig. 5e) and showed two main common metabolisms: arginine–proline metabolism and urea cycle. Detailed data are presented in Additional file 1: Table S4. Arginine–proline metabolism and it connec-tions to urea cycle is depicted in Additional file 1: Fig. S10.
As observed in MPS I patients [26] the arginine metab-olism is the most altered pathway, aspartic acid is highly elevated in MPS IIIA and IIIB, significantly elevated in IIIC and shows a rising tendency in IIID. These metab-olisms (arginine–proline, urea cycle, aspartic acid) have been reported to be upregulated along with high autophagic activity upon oxygen and glucose reduc-tion using cultured fibroblasts [32] which is consist-ent with their involvemconsist-ent in bioenergetic balance. As in other LSDs, arginine metabolism may be challenged in MPS III due to lysosome dysfunction and its subse-quent autophagic block [33]. Aspartic-acid contributes to the synthesis of N-acetyl-l-aspartate (NAA) and its derivative N-acetylaspartylglutamate (NAAG). NAA plays a central role in neuronal osmosis and myelin syn-thesis whereas NAAG is a key neurotransmitter. NAA and NAAG are highly present in the brain; their synthe-sis and catabolism take place in the brain and are highly regulated and compartmentalized [34]. This high-level homeostasis is consistent with a key function of these components in the central nervous system. Thus, the impact of NAA metabolism is illustrated by the brain damages associated with the NAA catabolic enzyme called aspartoacylase in Canavan disease, an early-onset spongiform leukodystrophy [35]. It has also been reported that the NAA signal obtained using magnetic resonance spectroscopy is reduced in metachromatic leu-kodystrophy, Krabbe disease and other lysosomal storage diseases [36, 37].
A recent study reported metabolomics profiling in serum from MPS IIIA and MPS IIIB patients. Our results are in accordance with this study, which showed notable metabolic disturbance of key amino acids indicating pro-found metabolic pathway remodeling. Interestingly, NAA
Fig. 3 a Heat map representing the clustering of 24 amino acids across the five groups of samples (MPS IIIA, MPS IIIB, MPS IIIC, MPS IIID and
Controls). Columns represent individual samples and rows refer to amino acid. Shades of green or red represent elevation or decrease, respectively, of an amino acid. b–e Spearman rank‑order correlation matrix 24 amino acids based on their concentrations profiles across all samples in MPS IIIA, MPS IIIB, MPS IIIC and MPS IIID respectively. Shades of green to red represent low‑to‑high correlation coefficient between markers
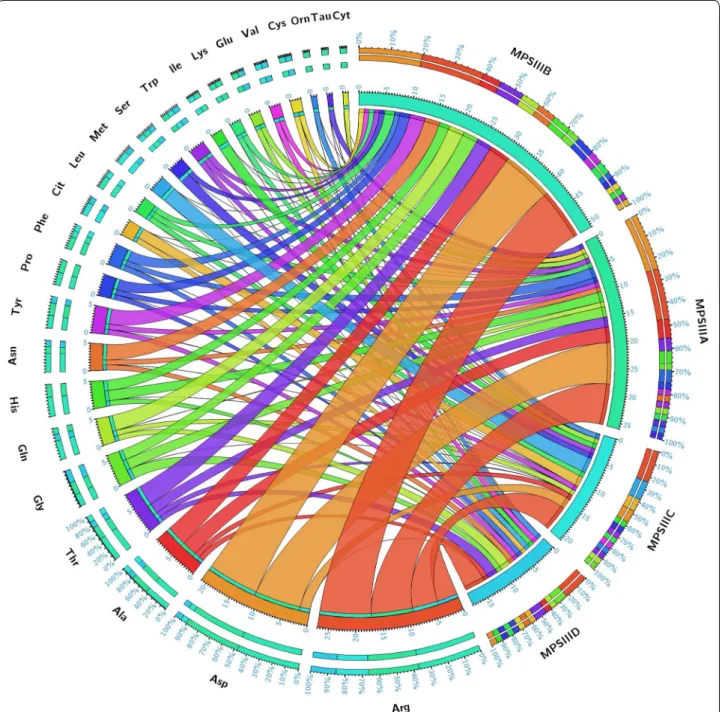
Fig. 4 Circular plot of the 24 amino acids and their related −log (p) values in the different studies MPS III groups. Segments are color‑coded
according to amino acids and ribbon size represents −log (p) values (large ribbons mean low p‑values). Corresponding p‑values are presented in Table 4
Fig. 5 Metabolite Set Enrichment Analysis using amino acid concentrations. a MPS IIIA vs Control. b MPS IIIB vs Control. c MPS IIIC vs Control. d MPS
IIID vs Control. e Venn diagram of the significant pathways retrieved from experimental metabolomics data and in silico systems biology approach from Salazar et al. [37]. The diagram shows two common metabolisms: arginine–proline metabolism and urea cycle. Detailed pathway information is given in Additional file 1: Table S6
levels were decreased in these patients compared to the control patients [38].
Conclusion
In this study, urine global metabolomics profiling revealed profound metabolic impairments in patients with MPS III. The identification of pathological metab-olomics signatures may provide better understanding of the pathophysiological mechanism underlying these diseases and thus allow therapeutic innovation in such rare conditions.
Additional file
Additional file 1. Detailed analytical protocols and data modeling.
Abbreviations
IEM: inborn errors of metabolism; LSD: lysosomal storage diseases; MPS: muco‑ polysaccharidoses; GAGs: glycosaminoglycans; MPS III: mucopolysaccharidosis type III; UPLC–IM‑MS: ultraperformance liquid chromatography–ion mobility mass spectrometry; CCS: collision cross section; ERT: enzyme replacement therapy; QC: quality control; HS: heparan sulfate; DS: dermatan sulfate; KS: keratan sulfate; ROC: receiver operating characteristic; FDR: false discovery rate; PCA: principal component analysis; OPLS‑DA: orthogonal partial least‑ squares‑discriminant analysis; VIP: variable influence in projection; AUC : area under curve.
Authors’ contributions
AT, work conception and design, data acquisition, data analysis, figures drawing and interpretation, paper drafting and final approval; LAD and SM, data interpretation, patient samples and paper revising; ISA, data acquisition and paper revising; MP, BH, JA and FZ, patient samples and paper revising; BG, paper revising and final approval; CA, work conception, data acquisition and interpretation, paper revising and final approval; SB, work conception and design, data analysis and interpretation, paper drafting, revising and final approval. All authors read and approved the final manuscript.
Author details
1 Department of Metabolic Biochemistry, Rouen University Hospital, 76000 Rouen Cedex, France. 2 Normandie Univ, UNIROUEN, CHU Rouen, INSERM U1245, 76000 Rouen, France. 3 Normandie Univ, UNIROUEN, INSA Rouen, CNRS, COBRA, 76000 Rouen, France. 4 Department of Neonatal Pediatrics, Intensive Care and Neuropediatrics, Rouen University Hospital, 76031 Rouen, France. 5 Department of Pediatric Neurology, Reference Center of Lysosomal Diseases, Trousseau Hospital, APHP and Sorbonne Université, GRC No 19, Pathologies Congénitales du Cervelet‑LeucoDystrophies, AP‑HP, Hôpital Armand Trousseau, 75012 Paris, France. 6 Service de Biochimie et Biolo‑ gie Moléculaire Grand Est, Unité des Maladies Héréditaires du Métabolisme et Dépistage Néonatal, Centre de Biologie et de Pathologie Est, CHU de Lyon, Lyon, France. 7 INSERM U1088, Laboratoire de Biochimie Métabolique, Centre de Biologie Humaine, CHU Sud, 80054 Amiens Cedex, France. 8 Laboratoire de Biochimie et Biologie Moléculaire, Université de Lille et Pôle de Biologie Pathologie Génétique du CHRU de Lille, 59000 Lille, France.
Acknowledgements
The authors are grateful to Carine Pilon, Thomas Plichet and Tony Pereira (Rouen University Hospital, France) for their technical assistance. Competing interests
The authors declare that they have no competing interests.
Availability of data and materials
The datasets used and/or analyzed during the current study are available from the corresponding author on reasonable request.
Consent for publication
All authors have given consent for publication. Ethics approval and consent to participate
The study was approved by the Institutional Ethics Committee Research (Eth‑ ics Board of Rouen University Hospital‑CERNI E2016‑21) and was performed in accordance with the Declaration of Helsinki.
Funding
The authors gratefully acknowledge the Region Haute‑Normandie, the Euro‑ pean Regional Development Fund (ERDF 31708), Sanofi‑Genzyme, Shire and Vaincre les Maladies Lysosomales for financial support. None of the funders of this research was involved in the design of the study and collection, analysis, and interpretation of data or in writing the manuscript.
Publisher’s Note
Springer Nature remains neutral with regard to jurisdictional claims in pub‑ lished maps and institutional affiliations.
Received: 4 June 2018 Accepted: 30 August 2018
References
1. Tebani A, Afonso C, Marret S, Bekri S. Omics‑based strategies in precision medicine: toward a paradigm shift in inborn errors of metabolism investi‑ gations. Int J Mol Sci. 2016;17:1555.
2. Nicholson JK, Lindon JC, Holmes E. ‘Metabonomics’: understanding the metabolic responses of living systems to pathophysiological stimuli via multivariate statistical analysis of biological NMR spectroscopic data. Xenobiotica. 1999;29:1181–9.
3. Bekri S. The role of metabolomics in precision medicine. Exp Rev Prec Med Drug Dev. 2016;1:517–32.
4. Benton HP, Want E, Keun HC, Amberg A, Plumb RS, Goldfain‑Blanc F, Walther B, Reily MD, Lindon JC, Holmes E, et al. Intra‑ and interlaboratory reproducibility of ultra performance liquid chromatography‑time‑of‑ flight mass spectrometry for urinary metabolic profiling. Anal Chem. 2012;84:2424–32.
5. Tebani A, Abily‑Donval L, Afonso C, Marret S, Bekri S. Clinical metabo‑ lomics: the new metabolic window for inborn errors of metabolism investigations in the post‑genomic era. Int J Mol Sci. 2016;17:1167. 6. Ballabio A, Gieselmann V. Lysosomal disorders: from storage to cellular
damage. Biochim Biophys Acta. 2009;1793:684–96.
7. Wraith JE. The mucopolysaccharidoses: a clinical review and guide to management. Arch Dis Child. 1995;72:263–7.
8. Neufeld EFMJ. The mucopolysaccharidoses. In: Scrive CBA, Sly W, Vaele D, editors. The metabolic and molecular basis of inherited disease. New York: Mc Graw‑Hill; 2001. p. 3421–52.
9. Baehner F, Schmiedeskamp C, Krummenauer F, Miebach E, Bajbouj M, Whybra C, Kohlschutter A, Kampmann C, Beck M. Cumulative incidence rates of the mucopolysaccharidoses in Germany. J Inherit Metab Dis. 2005;28:1011–7.
10. Parenti G, Andria G, Ballabio A. Lysosomal storage diseases: from patho‑ physiology to therapy. Annu Rev Med. 2015;66:471–86.
11. Elizabeht N, Joseph M. The mucopolysaccharidoses. New York: McGraw‑ Hill; 2001.
12. Delgadillo V, O’Callaghan Mdel M, Gort L, Coll MJ, Pineda M. Natural his‑ tory of Sanfilippo syndrome in Spain. Orphanet J Rare Dis. 2013;8:189. 13. Buhrman D, Thakkar K, Poe M, Escolar ML. Natural history of Sanfilippo
syndrome type A. J Inherit Metab Dis. 2014;37:431–7.
14. Wijburg FA, Wegrzyn G, Burton BK, Tylki‑Szymanska A. Mucopolysac‑ charidosis type III (Sanfilippo syndrome) and misdiagnosis of idiopathic developmental delay, attention deficit/hyperactivity disorder or autism spectrum disorder. Acta Paediatr. 2013;102:462–70.
•fast, convenient online submission
•
thorough peer review by experienced researchers in your field
• rapid publication on acceptance
• support for research data, including large and complex data types
•
gold Open Access which fosters wider collaboration and increased citations maximum visibility for your research: over 100M website views per year
•
At BMC, research is always in progress. Learn more biomedcentral.com/submissions
Ready to submit your research? Choose BMC and benefit from:
15. Khan SA, Peracha H, Ballhausen D, Wiesbauer A, Rohrbach M, Gautschi M, Mason RW, Giugliani R, Suzuki Y, Orii KE, et al. Epidemiology of mucopoly‑ saccharidoses. Mol Genet Metab. 2017;121:227–40.
16. Meyer A, Kossow K, Gal A, Muhlhausen C, Ullrich K, Braulke T, Muschol N. Scoring evaluation of the natural course of mucopolysaccharidosis type IIIA (Sanfilippo syndrome type A). Pediatrics. 2007;120:e1255–61. 17. Shapiro EG, Nestrasil I, Delaney KA, Rudser K, Kovac V, Nair N, Richard CW,
Haslett P, Whitley CB. A prospective natural history study of mucopolysac‑ charidosis type IIIA. J Pediatrics. 2016;170(278–287):e274.
18. Valstar MJ, Bruggenwirth HT, Olmer R, Wevers RA, Verheijen FW, Poorthuis BJ, Halley DJ, Wijburg FA. Mucopolysaccharidosis type IIIB may predomi‑ nantly present with an attenuated clinical phenotype. J Inherit Metab Dis. 2010;33:759–67.
19. Ruijter GJ, Valstar MJ, van de Kamp JM, van der Helm RM, Durand S, van Diggelen OP, Wevers RA, Poorthuis BJ, Pshezhetsky AV, Wijburg FA. Clini‑ cal and genetic spectrum of Sanfilippo type C (MPS IIIC) disease in The Netherlands. Mol Genet Metab. 2008;93:104–11.
20. Valstar MJ, Bertoli‑Avella AM, Wessels MW, Ruijter GJ, de Graaf B, Olmer R, Elfferich P, Neijs S, Kariminejad R, Suheyl Ezgu F, et al. Mucopolysac‑ charidosis type IIID: 12 new patients and 15 novel mutations. Hum Mutat. 2010;31:E1348–60.
21. Tardieu M, Zerah M, Gougeon ML, Ausseil J, de Bournonville S, Husson B, Zafeiriou D, Parenti G, Bourget P, Poirier B, et al. Intracerebral gene therapy in children with mucopolysaccharidosis type IIIB syndrome: an uncon‑ trolled phase 1/2 clinical trial. Lancet Neurol. 2017;16:712–20. 22. Lange MC, Teive HA, Troiano AR, Bitencourt M, Funke VA, Setubal DC,
Zanis Neto J, Medeiros CR, Werneck LC, Pasquini R, Bonfim CM. Bone marrow transplantation in patients with storage diseases: a developing country experience. Arq Neuropsiquiatr. 2006;64:1–4.
23. Moskot M, Jakobkiewicz‑Banecka J, Kloska A, Smolinska E, Mozolewski P, Malinowska M, Rychlowski M, Banecki B, Wegrzyn G, Gabig‑Ciminska M. Modulation of expression of genes involved in glycosaminoglycan metabolism and lysosome biogenesis by flavonoids. Sci Rep. 2015;5:9378. 24. Roberts AL, Fletcher JM, Moore L, Byers S. Trans‑generational exposure
to low levels of rhodamine B does not adversely affect litter size or liver function in murine mucopolysaccharidosis type IIIA. Mol Genet Metab. 2010;101:208–13.
25. Savas PS, Hemsley KM, Hopwood JJ. Intracerebral injection of sulfami‑ dase delays neuropathology in murine MPS‑IIIA. Mol Genet Metab. 2004;82:273–85.
26. Tebani A, Schmitz‑Afonso I, Abily‑Donval L, Heron B, Piraud M, Ausseil J, Brassier A, De Lonlay P, Zerimech F, Vaz FM, et al. Urinary metabolic
phenotyping of mucopolysaccharidosis type I combining untargeted and targeted strategies with data modeling. Clinica Chimica Acta. 2017;475:7–14.
27. Tebani A, Schmitz‑Afonso I, Rutledge DN, Gonzalez BJ, Bekri S, Afonso C. Optimization of a liquid chromatography ion mobility‑mass spectrom‑ etry method for untargeted metabolomics using experimental design and multivariate data analysis. Anal Chim Acta. 2016;913:55–62. 28. Shen X, Gong X, Cai Y, Guo Y, Tu J, Li H, Zhang T, Wang J, Xue F, Zhu Z‑J.
Normalization and integration of large‑scale metabolomics data using support vector regression. Metabolomics. 2016;12:89.
29. Li S, Park Y, Duraisingham S, Strobel FH, Khan N, Soltow QA, Jones DP, Pulendran B. Predicting network activity from high throughput metabo‑ lomics. PLoS Comput Biol. 2013;9:e1003123.
30. Xia J, Sinelnikov IV, Han B, Wishart DS. MetaboAnalyst 3.0‑making metabolomics more meaningful. Nucleic Acids Res. 2015;43:W25. 31. Salazar DA, Rodriguez‑Lopez A, Herreno A, Barbosa H, Herrera J, Ardila A,
Barreto GE, Gonzalez J, Almeciga‑Diaz CJ. Systems biology study of muco‑ polysaccharidosis using a human metabolic reconstruction network. Mol Genet Metab. 2016;117:129–39.
32. Weckmann K, Diefenthaler P, Baeken MW, Yusifli K, Turck CW, Asara JM, Behl C, Hajieva P. Metabolomics profiling reveals differential adaptation of major energy metabolism pathways associated with autophagy upon oxygen and glucose reduction. Sci Rep. 2018;8:2337.
33. Pshezhetsky AV. Lysosomal storage of heparan sulfate causes mitochon‑ drial defects, altered autophagy, and neuronal death in the mouse model of mucopolysaccharidosis III type C. Autophagy. 2016;12:1059–60. 34. Baslow MH. Functions of N‑acetyl‑l‑aspartate and N‑acetyl‑l‑aspartyl‑
glutamate in the vertebrate brain: role in glial cell‑specific signaling. J Neurochem. 2000;75:453–9.
35. Matalon R, Michals‑Matalon K. Molecular basis of Canavan disease. Eur J Paediatr Neurol. 1998;2:69–76.
36. Brockmann K, Dechent P, Wilken B, Rusch O, Frahm J, Hanefeld F. Proton MRS profile of cerebral metabolic abnormalities in Krabbe disease. Neu‑ rology. 2003;60:819–25.
37. Dali C, Hanson LG, Barton NW, Fogh J, Nair N, Lund AM. Brain N‑acetylas‑ partate levels correlate with motor function in metachromatic leukodys‑ trophy. Neurology. 2010;75:1896–903.
38. Fu H, Meadows AS, Pineda RJ, Mohney RP, Stirdivant S, McCarty DM. Serum global metabolomics profiling reveals profound metabolic impairments in patients with MPS IIIA and MPS IIIB. Metab Brain Dis. 2017;32:1403–15.