HAL Id: hal-03038798
https://hal.archives-ouvertes.fr/hal-03038798
Submitted on 3 Feb 2021
HAL is a multi-disciplinary open access
archive for the deposit and dissemination of
sci-entific research documents, whether they are
pub-lished or not. The documents may come from
teaching and research institutions in France or
abroad, or from public or private research centers.
L’archive ouverte pluridisciplinaire HAL, est
destinée au dépôt et à la diffusion de documents
scientifiques de niveau recherche, publiés ou non,
émanant des établissements d’enseignement et de
recherche français ou étrangers, des laboratoires
publics ou privés.
Airborne lidar observation of mountain-wave-induced
polar stratospheric clouds during EASOE
Sophie Godin, Gérard Mégie, Christine David, D. Haner, C. Flesia, Y. Emery
To cite this version:
Sophie Godin, Gérard Mégie, Christine David, D. Haner, C. Flesia, et al.. Airborne lidar observation
of mountain-wave-induced polar stratospheric clouds during EASOE. Geophysical Research Letters,
American Geophysical Union, 1994, 21 (13), pp.1335-1338. �10.1029/93GL02894�. �hal-03038798�
Airborne
lidar observation
of mountain-wave-
induced polar stratospheric
clouds during EASOE
S. Godin, G. M6gie, C. David, and D. Haner
Service d' A•ronomi½ du CNR$ - Universit• Pierre et Marie Curie
C. Flesia and Y. Emery
Observatoire de NeueMtel, Switzerland
Abstract. The airborne backscatter lidar Leandre was
flown during the EASOE campaign on board the French ARAT-Fokker 27, to provide mesoscale observations of scattering layers in the stratosphere. The use of cross- polarization channels at the 532 nm laser emitted wavelength, allowed discrimination between the quasi-spherical particles of the Pinatubo aerosol and the non-spherical frozen particles of polar stratospheric clouds. Measurements taken on
December 1 lth 1991 revealed mountain-wave-induced polar
stratospheric clouds at 21 km altitude, extending over 300 km west and 300 km east from Kimna. The wavelength and amplitude of the perturbation imply local cooling ranging from 3øK to 10øK in the stratosphere, taking the temperature below the threshold of formation of polar stratospheric
clouds.
Introduction
One of the main scientific objectives of the European Arctic Stratospheric Ozone Experiment (EASOE) was to study the formation of polar stratospheric clouds and their influence on local ozone depletion in the arctic stratosphere. Such clouds are thought to be formed when the air temperature drops below a threshold, which for typical values of the water vapor and nitric acid mixing ratios of 5 ppm and 10 ppb respectively, is equal to 195øK at an altitude of 20 km or on the 50 hPa pressure level (Toon et al., 1986). Processes such as orographically forced waves propagating into the stratosphere provide a mechanism for locally cooling the stratosphere, allowing PSC formation, although the average temperature as observed from radiosoundings or as calculated along isobaric or isentropic surface levels can be higher than the threshold value. The limited vertical and
horizontal resolutions of the trajectories calculated from
ECMWF analyses prevent the determination of such localised coolings. Observations and simulations of orographic waves in Antarctica have been reported by Bacmeister et al., 1990
and Cariolle et al., 1989. In northern Scandinavia, the
mountains located west of Kiruna close to the Norwegian border (68øE) have a crest height of about 1500 m and an
horizontal extension of about 120 km in the west-east
direction. Strong westerly winds blowing from the North Sea can force orographic waves (Volkert and Intes, 1992).
Copyright
1994 by the American
Geophysical
Union.
Paper number 93GL02894
0094-8534/94/93GL-02894503.00
As part of the ELSA project (Exp6riences Lidar dans la
Stratosphere Arctique, Godin et al., 1992), the airborne
backscatter lidar LEANDRE (Pelon et al., 1990) was flown
during the EASOE campaign from Kiruna airport (68øN,
22øE). As the dual wavelength, dual polarization lidar LEANDRE is designed to observe the three dimensional
structure and optical properties of scattering layers in the
atmosphere, the objective of this experiment was the
measurement of polar stratospheric clouds. The injection of
aerosols into the stratosphere by the major eruption of Mount
Pinatubo in the Philippines in June 1991 made it important to
study the evolution of the aerosol layers in the lower
stratosphere.
Experimental system and campaign operation The two wavelengths emitted by the LEANDRE
instrument are the fundamental (1064 nm) and second harmonic (532 nm) emissions of a Nd:YAG laser, the
respective output energies being 100 rnJ and 25 rnJ. At 532 nm, the cross-polarized backscattered signal is also recorded, allowing thus the differentiation between spherical and non- spherical scatterers in the atmosphere. The lidar signals are received on a 30 cm diameter telescope and detected using photomultiplier tubes for the visible wavelength and a photodiode in the near infrared. The signal is time-resolved using a waveform transient recorder and the data are stored on magnetic tapes for further analysis. Real time visualization of the signals is available during the flight. The instrument is carried by the French ARAT-Fokker 27 (Avion de Recherche Atmosph6rique et de T616d6tection). During the EASOE caxnpaign the instrument was operated in the zenith looking
mode, where the direction of the emitted beam makes a 20 ø
angle with the zenith. Besides, only the two cross-polarized signals at 532 nm were used. The ARAT was operated from Kiruna airport. The average flight altitude was between 4 and 5.5 km and the maximum horizontal range (one way) was of the order of 350 km. Thus only mesoscale observations were possible, following 3 different flight paths:
- westward from Kiruna to Narvik and the North Sea, the
main interest of which was the possibility to observe upwind
and downwind of the mountains,
- eastward from Kiruna to Sodankyl•i and close to the Finnish border, the rnain interest of which was the possibility of performing measurements close to the ground-based backscatter lidar which had been installed at Sodankyl•i for the ELSA project (Stefanutti et a1.,1992),
- northward from Kiruna to Hammerfest, the main interest of
which being the possibility of a deeper penetration into the
polar vortex.
1336 Godin et al.: Mountain-Wave Induced PSC Lidar Observation
During the EASOE campaign, the LEANDRE
instrument was flown intensively during two observation
periods:
(1) 10 flights were made from 2 December to 14 December
1991 for a total of 31 flight hours,
(2) 20 flights were made from 14 January to 17 February
1992, for a total of 47 flight hours.
In all 30 flights the system operated successfully. Flight operation of the instrument was only precluded during the period of January 22 to January 28, due to a laser failure, and
from February 10 to 14 due to aircraft-related problems.
Observation of the Pinatubo aerosol cloud
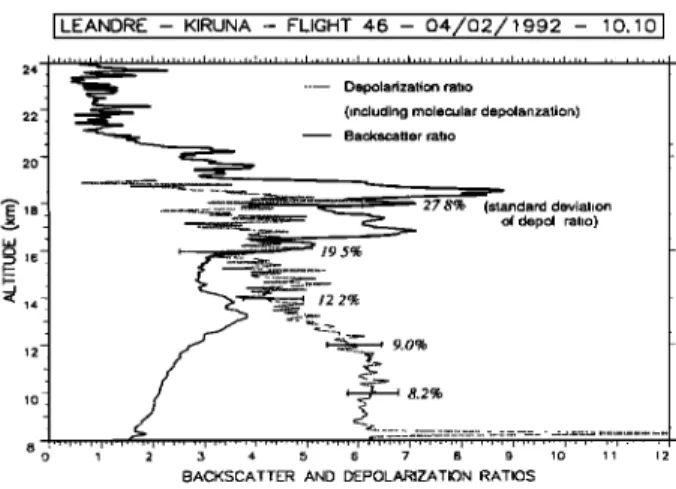
Volcanic aerosol layers between altitudes of 15 and 20 km were seen on all flights. Furthermore, the altitude of the layers varied from one flight to another, in association with the movement of the polar vortex from day to day (Neuber et al., 1993, this issue). An example of the backscatter and depolarization ratios of these aerosols is shown in figure 1,
for the February 4 th flight. The backscatter ratio is calculated
from the parallel-polarized
channel
signal
: Rp - [•p/[•mp
where
[•p and [•mp
con'espond
to the total and molecular
backscatter coefficients respectively, related to the parallel polarization. This ratio is corrected for aerosol extinction, according to the Klett method (Klett, 1981). The molecular backscatter coefficient is calculated using the pressure- temperature profiles obtained from the radiosoundings performed in Kiruna. It is assumed to be uniform along the flight path. A value of 4% is used for the Rayleigh depolarization. The depolarization ratio is defined as
[•p/([•s+[•p)
where [3p and [3
s correspond
to the total
backscatter coefficient on the parallel and perpendicular channel respectively. In all LEANDRE measurements performed during EASOE, the depolarization ratio in the
main aerosol cloud was found to be lower than 4 %. This is consistent, if we take into account the error bar on this ratio,
with the virtual absence of non-spherical particles. Higher values of depolarization, on the order of 6 %, are often found
at the base of the cloud, at altitudes from 8 to 14 km,
indicating the presence of non-spherical particles. These
I LEANDRE - KIRUNA -- FLIGHT 46 -- 04/02/1992 -- 10:10 I
•
--- Depolanzabon
ratio
22 • (including molecular depolanzat,on)
20 •
Backscatte
rat
o
.... ii ... '"";'• ... •""-'--1'---'--- 27.8% (standard d .... t,on•' ... '•7'•:::'":'2;:'..'•'.•:.•_..•;:.•
•
of
depol
ratio)
• ...-.-...• ... (•;'" , 9.0% : lO • • 8.2% 8 ... "•'"' o 1 2 3 4 5 6 7 8 9 lO 11 12BACKSCA'ITER AND DEPOLARIZATION RATIOS
Figure 1 : Backscatter ratio and depolarization ratio as
measured by Leandre on the 4 th of February 1992. Error
bars on the depolarization ratio correspond to 1• standard
deviation.
results are in agreement with those obtained at many ground-
based lidar stations (Stefanutti et al., this issue). For
depolarization ratios larger than those values, the presence of polar stratospheric clouds can be assumed.
Moutain wave induced PSC on December 11, 1991
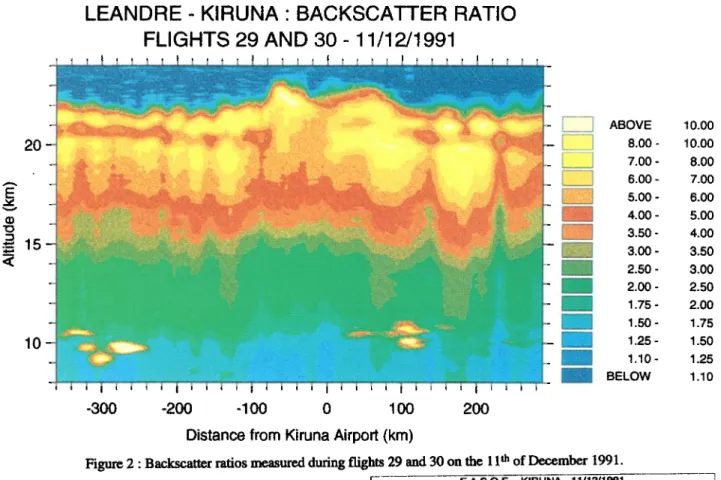
Flights 29 and 30, made on the 11 th of December, following the westward and eastward paths respectively, revealed large oscillations in the scattering layers as seen in figure 2, which shows the backscatter ratio measured on the parallel polarized channel during both flights as a function of the distance to Kiruna Airport. It is a cross-section of the
backscatter ratio of the aerosols located between the North
Sea and Sodankylii on that day. Note that the two flights were made respectively from 8 to 10 UT and from 13 to 15:30 UT. The wave activity is present throughout the region scanned by the lidar, with marked differences in the horizontal and vertical patterns, according to the distance from the Norwegian mountains. In particular, on both flights,
the amplitude of the wave increased just downwind frown the
relief, with the air rising through about 1 km. The horizontal wavelength was about 33 km upwind and 50 km downwind of the mountains, and the vertical amplitude was on average
250 meters. The radiosounding performed at noon on that day from Bodo (located on the Norwegian coast) showed a
jet of 36m/s at the tropopause, sufficient for the development of orographic waves in the stratosphere (figure 3). This wave activity was also detected on ozone and water vapor balloon borne measurements performed on the same day, that showed a gravity wave with a vertical wavelength of 10 km
(Teitelbaum et al., this issue). On figure 2, we see a distinct
scattering layer located at about 21 km. This layer is also
seen on the measurements made by a backscatter sonde launched from Kiruna, in the afternoon. Figure 4 presents a
comparison of the aerosol backscatter ratio obtained by
Leandre and the backscatter sonde, at different wavelengths.
Despite a few hundred metres off-set in the height of the upper scattering layer as measured by Leandre, can be,
attributed to the different location of the measurements and
to the oscillations in the scattering layers, there is a good correspondance between the three profiles. The vertical profile of the depolarization ratio obtained during the afternoon flight is displayed in figure 5, together with the backscatter ratio. The upper layer shows a depolarization ratio of more than 40 %, giving direct evidence for the presence of non-spherical particles, distinct from the main Pinatubo aerosols which have been reported during the Arctic campaign to be spherical with an average size of 0.2-0.3 gm
(Stein et al., this issue). This PSC was also observed from
Sodankylii by the backscatter lidar, but the value of the
Rayleigh corrected depolarization ratio measured at 532 nm
around 12 UT was only about 10% (Stein et al., this issue). Coincident measurements were not possible, due to the poor meteorological conditions in Sodankylii on that day. Further microphysical studies taking into account the time difference
between the two measurements are needed to understand this
discrepancy. The presence of a polar stratospheric cloud at this altitude is consistant with the temperature measurements at Bodo (figure 3) and Sodankylii, which were, above 20 km, slightly under the threshold of formation of NAT particles,
FLIGHTS
29 AND 30-
11/12/1991
20 ] I i I i I I i [ 1 [ [ I [ I [ -300 -200 -100 0 100 200 ABOVE 8.00 - 7.00 - 6.00 - 5.00 - 4.00 - 3.50 - 3.00 - 2.50 - 2.00 - 1.75 - 1.50 - 1.25 - 1.10 - BELOW 10.00 10.00 8.00 7.00 6.00 5.00 4.00 3.50 3.00 2.50 2.00 1.75 1.50 1.25 1.10Distance from Kiruna Airport (km)
8
4
2
Figure
2' Backscatter
ratios
measured
during
flights
29 and
30 on
the
11
th
of December
1991.
RADIOSOUNDING
FROM
BODO-
11112/1991
- 12:00
]
[
E.A.S.O.E.
- KIRUNA
- 11112/1991
WlqD VELOCITY 0 4 8 12 16 20 24 28 32 3• 40 44 48 i . i . . . i . i . i . , . i . i . i . , . i . i . i ß , . i . i ß I . . . I .... ... ;•- ... Kelvin TEMPERATURE
LEANDRE (15:15 67.29N 22.32E) - BACKSCATTER SONDF-fCAO (15:08 67.9N 21.4E)
TEMPERATURE Kelvin
4 195 2O0 205 210 215 220 225 230 235 24O 2 5 25•3
, I , I ß , , I , ! , I - I . I . I
Figure 3: Temperature and wind radiosounding measure-
merits from Bodo on December 11 th 1991. Temperature
thresholds for the formation of PSC of type 1 (NAT) and
type 2 (ice) are also indicated.
considering an average HNO3 profile provided. by the
EASOE database and an average water vapor mixing ratio of
5 ppmv.
According
to Leandre
measurements,
the amplitude
of the mountain wave should have induced adiabatic coolings
ranging
from
2.5øK
to 10øK
just downwind
of the mountains.
As the synoptic situation shows that northern Scandinavia
was inside the vortex on that day with minimum temperature
of 198øK on the 550K potential temperature surface, the
gravity
wave was probably
responsible
for the formation
of
the polar stratospheric cloud observed by Leandre.
Conclusion
The different results presented here show that the
backscatter airborne lidars can detect mesoscale dynamical 190 T_:•-..:: .... / /: '"
• '•'•:...
t•....•;U"•
t
-':t:
• .
' ...
•,
...
,
S•TTE• RAT•FJ•c 4 ß Comp•son of backscatter
ratio obt•ned by
•dre •d the b•l•n bo•c backscatter sondc ]aunch• from •mna on •ccmbcr ] lth ]99 ]
LEANDRE - KIRUNA - FLIGHT 30 - 11/12/1991 - 15:10 24
ß •' ""-.•'•,;•=:•LS._--•_.. ...
ß
o'
::•..E&:•
...
"'""'"•::="-:'"=='
--- Depolarization ratio (%)
•'1,' --.•1;:.._•..• (Including molecular I::lel:x•arization) 16'
• 14- .
.
6 ;-- ,• 6 12 16 20 24 28 32 36 40 44 48
BACKSCATTER AND DEPOLARIZA'[ION RATIO
Figure 5 ß Dcpoladzation
ratio and backscatter
ratio
1338
Godin
et al.: Mountain-Wave
Induced
PSC
Lidar
Observation
processes. Stratospheric mountain waves in Northern
Scandinavia can have a significant impact on the formation of
polar stratospheric clouds, taking into account the average
meteorological conditions of that region. Careful study using
microphysical models of the event of December 1 lth 1991,
which lasted several hours and was well observed, should
make it possible to assess the potential for ozone destruction
of such processes during the Arctic winter.
Acknowledgements. This study has been jointly
supported by the Commission of the European Communities
DG XII under contract No. STEP-CT91-040, and by the
French Middle Atmosphere Programme. The authors want to
specially acknowledge the invaluable support of the IGN
(Institut National Geographique) aircraft crew, and of the
INSU ARAT team.
References
Bacmeister J.T., M.R. Schoerbel, L.S. Lait, P.A. Newman, B.
Gray: ER-2 mountain wave encounter over Antarctica, evidence for blocking. Geophys. Res. Lett., 17, 81-84,
1990.
Cariolle, D., S. Muller, F. Cayla and M.P. Mc Cormick :
Mountain waves, polar stratospheric clouds, and the
ozone depletion over Antarctica, J. Geophys. Res. 94, No
D9, 11233-11240, 1989.
Godin, S., G. M6gie, C. David, V. Mitev, Y. Emery, C.
Flesia, V. Rizi, G. Visconti, L. Stefanutti: Ozone, aerosols and polar stratospheric clouds measurements
during the EASOE campaign, Proc. Quadr. Ozone
Symposium, 1992.
Klett J.D.: Stable analytical inversion solution for processing
lidar returns, Applied Optics, 20, 2, 1981.
Neuber R., G. Beyerie, G. Fiocco, A. Di Sarra, K.H.Fricke,
C. David, S. Godin, L. Stefanutti, G. Vaughan, J.P. Wolf : Latitudinal distribution of stratospheric aerosols durind
the EASOE winter 1991/92, this issue
Stefanutti L., F. Castagnoli , M. Del Guasta, M. Morandi, V.M. Sacco, V. Venturi, L. Zuccagnoli, J. Kolenda, H. Kneipp, P. Rairoux, B. Stein, D. Weidauer, J.P. Wolf, L. Woste, C. Flesia, R. Matthey, S. Godin: Arctic Polar Stratospheric Cloud measurements by means of a four wavelength depolarization backscatter lidar, Proc. Quadr. Ozone Symposium, 1992
Stefanutti L., T. Peter, M. Del Guasta, S. Godin, M.
Morandi, B. Stein, P. Rairoux, J.P. Wolf: Depolarization lidar returns from the lower stratosphere over Sodankyl•i during EASOE, this issue.
Stein B., M. Del Guasta, J. Kolenda, M. Morandi, P.
Rairoux, L. Stefanutti, J.P. Wolf: Stratospheric aerosols size distribution from multispectral lidar measurements at Sodankyl•i during EASOE, this issue
Teitelbaum H., J. Ovarlez, H. Kalder, S. Loth : Some
observations of gravity-waves-induced structures in ozone and water vapor during the EASOE, this issue
Toon, O.B., P. Hamill, R.P. Turco, J. Pinto: Condensation of HNO 3 and HC1 in the winter polar stratospheres,
Geophysical Res. Lett., 1986
Volkert, H. and D. Ines: Orographically forced stratospheric waves over Northern Scandinavia, Geophys. Res. Lett.,
1992.
S. Godin, G. M6gie, C. David, D. Haner ß Service
d'A6ronomie du CNRS, Universit6 Pierre et Marie Curie,
Boite 102, 4 place Jussieu, 75252 Paris C6dex 05, France C. Flesia, Y. Emery : Observatoire de Neuchfitel,
Neuchfitel, Switzerland
(Received: November 16, 1992 Revised : April 5, 1993