HAL Id: hal-00983576
https://hal.archives-ouvertes.fr/hal-00983576
Submitted on 25 Apr 2014HAL is a multi-disciplinary open access archive for the deposit and dissemination of sci-entific research documents, whether they are pub-lished or not. The documents may come from teaching and research institutions in France or abroad, or from public or private research centers.
L’archive ouverte pluridisciplinaire HAL, est destinée au dépôt et à la diffusion de documents scientifiques de niveau recherche, publiés ou non, émanant des établissements d’enseignement et de recherche français ou étrangers, des laboratoires publics ou privés.
Potential impact of microbial activity on the oxidant
capacity and organic carbon budget in clouds
M. Vaïtilingom, Laurent Deguillaume, V. Vinatier, M. Sancelme, Pierre
Amato, N. Chaumerliac, A.M. Delort
To cite this version:
M. Vaïtilingom, Laurent Deguillaume, V. Vinatier, M. Sancelme, Pierre Amato, et al.. Potential impact of microbial activity on the oxidant capacity and organic carbon budget in clouds. Proceedings of the National Academy of Sciences of the United States of America , National Academy of Sciences, 2013, pp.559-564. �10.1073/pnas.1205743110�. �hal-00983576�
1
Potential impact of microbial activity on the oxidant capacity and
organic carbon budget in clouds
M. Vaïtilingom1,2,3,4, L. Deguillaume3,4, V. Vinatier1,2, M. Sancelme1,2, P. Amato1,2, N. Chaumerliac3,4 & A.M. Delort1,2 *
[1]
Clermont Université, Université Blaise Pascal, Institut de Chimie de Clermont-Ferrand, BP 10448, F-63000 Clermont-Ferrand (France)
[2]
CNRS, UMR 6296, ICCF, BP 80026, F-63171 Aubière
[3]
Clermont Université, Université Blaise Pascal, OPGC, Laboratoire de Météorologie Physique, BP 10448, F-63000 Clermont-Ferrand (France)
[4]
CNRS, UMR 6016, LaMP/OPGC, BP80026, F-63177 Aubière
[
*] Corresponding author: A.M. Delort Tel: 00 33 473 40 77 14; Fax: 00 33 473 40 77 17 E-mail address: [email protected]
2 Abstract
Within cloud water, microorganisms are metabolically active and, thus, are expected to contribute to the atmospheric chemistry. This paper investigates the interactions between microorganisms and the reactive oxygenated species that are present in cloud water because these chemical compounds drive the oxidant capacity of the cloud system. Real cloud water samples with contrasting features (marine, continental and urban) were taken from the puy de Dôme mountain (France). The samples exhibited a high microbial biodiversity and complex chemical composition. The media were incubated in the dark and subjected to UV radiation in specifically designed photo-bioreactors. The concentrations of H2O2, organic compounds and
the ATP/ADP ratio were monitored during the incubation period. The microorganisms remained metabolically active in the presence of •OH radicals that were photo-produced from H2O2. This oxidant and major carbon compounds (formaldehyde and carboxylic acids) were
biodegraded by the endogenous microflora. This work suggests that microorganisms could play a double role in atmospheric chemistry; first, they could directly metabolize organic carbon species, and second, they could reduce the available source of radicals through their oxidative metabolism. Consequently, molecules such as H2O2 would no longer be available
for photochemical or other chemical reactions, which would decrease the cloud oxidant capacity.
3 \body
Introduction
The cloud system is an ideal medium for the development of complex multiphase chemistry, in which chemical species from the gas, solid and aqueous phases are transformed. This perturbs the homogeneous gas phase chemistry through the dissolution of various chemical compounds that undergo efficient photochemical processing. During a cloud's lifetime, cloud chemistry can lead to the formation of new, low volatile compounds, such as organic and inorganic acids, that modify the physical and chemical properties of aerosols after cloud evaporation and can also contribute to the formation of secondary aerosols (1-2). The formation of clouds is, consequently, modified, and this process remains one of the major uncertainties in climate models that assess the earth's radiative balance (3).
Within this framework, the presence of free radicals and oxidants in the cloud system leads to aqueous phase oxidations, transforming both inorganic and organic compounds. Cloud chemistry models predict that the HO• radicals represent the most important oxidant in the cloud aqueous phase (4). This oxidant can either be transferred from the gas phase or produced in situ in the aqueous phase through photochemical processes and/or related reactions with hydrogen peroxide and transition metal ions, such as iron (5). Multiple other oxidants that are produced in clouds can also oxidize chemicals, and these oxidation processes must be better understood because they impact atmospheric chemical cycles and radiation. Indeed, the resulting aerosols increase or decrease the scattering albedo, thus modifying the radiative forcing by clouds.
Many volatile organic compounds from secondary formations are associated with moderately high Henry's law constants and are, consequently, dissolved into the tropospheric aqueous phase (6). Additionally, organic compounds constitute a significant mass fraction of tropospheric aerosol particles, which can also be transferred into cloud water. Hence, the dissolved organic matter is able to interact directly or indirectly with the aqueous chemistry of radicals, radical anions, non-radical oxidants and transition metal ions. A large proportion of the dissolved organic matter is still not characterized, but carboxylic acids could represent a significant proportion of this soluble matter. Among these acids, the formic and acetic acids are the most abundant (mainly produced in the gaseous phase), oxalic acid is commonly the third dominant species and the main di-carboxylic acid, followed by succinic, malonic and maleic acids (predominantly dissolved from organic particles) (7-10).
4 Cloud water also hosts microbial populations that are primary biological aerosols and the dominant living aerosols that are present in the atmosphere (11-14). They can be integrated into clouds because they can serve as cloud condensation nuclei for droplet formation (13-15). This environment is stressful for airborne microorganisms (low temperature, desiccation, oxidation, UV radiation, acidic pH in the aqueous phase, etc.) (13, 16). Low temperatures appear to represent one of the major obstacles for cellular activity because they are directly linked to decreased molecular motion and reaction rates. However, bacteria can sustain growth in cloud water at temperatures at or below 0°C (17), and they are capable of maintaining metabolic activity at sub-zero temperatures down to -20°C (18-20). Cultivable microorganisms (fungal spores, yeasts and bacteria) have been found in fog and cloud water (21-23). Bauer et al. (2002) demonstrated that the majority of bacteria that are present in cloud water are viable (up to 95% in two samples) (21). The adenosine-5’-triphosphate (ATP) concentrations in cloud water that were measured by Amato et al. (2007) (24) suggest that a significant fraction of the microorganisms that are present in these environments are metabolically active.
The discovery of microbial activity in this environment has indicated that there are biologically mediated processes in the chemistry of clouds. In the recent past, researchers investigated the microbial activity in cloud water containing organic compounds, such as carboxylic acids, formaldehyde and methanol (25-26). Inferred estimates indicated that the activity of microorganisms was likely to affect the chemistry of these compounds in warm clouds and could even drive their reactivity during the night (27-29).
All of these studies are pertinent, but they were conducted under conditions that were different from those in real clouds. In particular, the presence of reactive oxygenated species, such as hydrogen peroxide (H2O2) and free radicals, was ignored. Although these compounds
are toxic to cell life, the survival of microorganisms in clouds strongly suggests that cloud-borne microorganisms can resist the high concentrations that are found in the atmosphere. This is likely to be due to the efficient, anti-oxidative stress metabolism that involves specialized enzymes (such as catalases, peroxidases and superoxide dismutase) and non-enzymatic compounds (30-31).
We investigated the metabolic activity of microorganisms in microcosms that were more similar to the real cloud environment. We used cloud water samples that were collected at the
puy de Dôme mountain, which is a reference site in France for cloud observations and is part of the European ACTRIS (Aerosols, Clouds, and Trace gases Research InfraStructure
5 Network) project. The samples contained complex mixtures of organic and inorganic compounds, oxidants, such as iron complexes and H2O2, and the endogenous microflora. The
cloud water samples were either kept intact or were sterilized by filtration and were then incubated in the dark or subjected to UV-light radiation in specially designed photo-bioreactors (Figure S1 in Supplementary Information, SI). This procedure resulted in the separation of biologically driven processes and other chemical phenomena (including photochemistry) that occurred in the cloud water under controlled conditions. The biological and chemical characterizations were conducted throughout the incubation. Under these conditions, the microorganisms were exposed to H2O2 and potential •OH radical
photo-production. This study had four specific objectives: i) to study the possible biodegradation processes of H2O2, ii) to determine the energetic state (ADP/ATP ratios) of cells under these
stressful conditions; iii) to investigate the impact of the presence of reactive oxygenated species on the biodegradation rates of organic acids (acetate, formate, oxalate, malonate and succinate) and formaldehyde; and (iv) to compare abiotic and biotic processes.
The major result of this work helps to answer two questions: i) do microorganisms interact with reactive oxygenated species? and ii) consequently, does microbial activity control the oxidant capacity and the organic carbon budget in natural clouds?
Results and discussion
Three cloud events were sampled in June 2010 at puy de Dôme mountain (1465 m a. s. l.). The backward trajectories from the NOAA Hysplit model were plotted for the various sampled air-masses and are displayed in Figure S2 (SI). Three cloud types were selected for their contrasting features: Cloud 1 had a northwestern marine origin; Cloud 2 was from the continental southwest; Cloud 3 was from the continental northeastern flux but was influenced by anthropogenic emissions. The average temperatures during sampling were 10°C for Clouds 1 and 3 and 13.5°C for Cloud 2 (see Table 1 for additional physico-chemical parameters).
Chemical and biological content of cloud water samples
The chemical and biological data from the 3 cloud water samples are summarized in Table 1. The chemical properties of these 3 samples are consistent with their respective origins. For
example, Cloud 3, collected from an “urban” air-mass, was more acidic and oxidant (pH = 3.9
and [H2O2] = 57.7 µM) than Cloud 1, which had a “marine” origin (pH = 6.1 and [H2O2] = 3.6 µM). Cloud 2, from the “continental” air-mass, represented an intermediate condition.
6 The five most abundant carboxylic acids that are usually found in cloud water (i.e., formic, acetic, oxalic, succinic and malonic acids (7-9)) and the most abundant aldehyde (i.e., formaldehyde) were present in Clouds 2 and 3, while succinic and malonic acids were not detected in Cloud 1. The contribution of carboxylic acids and formaldehyde to dissolved organic carbon was approximately 19, 25 and 23% in Clouds 1, 2 and 3, respectively. The total number of microbial cells was of the same order of magnitude as the typical previous measurements at the puy de Dôme site (23, 32) and was very similar to samples from Mt. Rax (1644 m a. s. l., Austria) (21).
Hydrogen peroxide biotransformation in real cloud water microcosms
The 3 cloud water samples were incubated at 17°C under 4 incubation regimes: unfiltered and in the presence or absence of UV radiation ("Microorganisms + Light" and
"Microorganisms", respectively) and filtered and in the presence or absence of UV radiation
("Light" and "Reference", respectively). H2O2 concentrations were measured periodically
over the incubation period and are plotted in Figure 1; the corresponding degradation rates are reported in Table 2.
In the absence of UV radiation in filtered cloud water ("Reference"), a slow degradation of H2O2 was observed in Clouds 2 and 3. This phenomenon can be explained by the reactivity of
H2O2 with chemical species, such as transition metal ions (a.k.a. "Fenton reactions") or
sulphite (33-34). The zero order kinetic constants were the same for the 2 clouds, most likely because of the very similar iron concentrations. In Cloud 1, the degradation of H2O2 was even
slower, most likely because the species responsible for the radical reactions (S and Fe) were present at lower concentrations than in Clouds 2 and 3 (Table 1). Under UV light, the first order kinetics had similar constants, indicating that H2O2 was photolyzed, producing •OH
radicals. Interestingly, in the presence of microorganisms without UV light, H2O2 was also
efficiently degraded in Cloud 2 (vc= 28.5 10-11 M s-1) and Cloud 3 (vc= 30.0 10-11 M s-1).
In Cloud 1, the microbial degradation of H2O2 was very slow until 72 h but then increased (vc
= 2.9 10-11 M s-1). In darkness, the presence of microorganisms enhanced the rate of H2O2
degradation by a factor of 2.9 and 4.2 for Clouds 2 and 3, respectively. Combining UV light and microorganisms resulted in higher degradation rates for H2O2 than either individual
condition alone. For Clouds 2 and 3, the degradation rates for H2O2 appeared to be additive:
7 demonstrate that cloud microorganisms can metabolize H2O2 intoO2 and H2O using catalases,
which are ubiquitous oxidoreductase enzymes.
Furthermore, it was possible to quantify the relative impact of biotic activity vs. abiotic H2O2
transformations (see Table S2 and Figure S3). During the day, three types of H2O2
degradation mechanisms were active in Clouds 2 and 3. Photodegradation was the major process (54% and 76%, respectively), followed by biodegradation (30% and 18%, respectively). Other abiotic reactions accounted for 16% in Cloud 2 and 6% in Cloud 3. In Cloud 1, only light was involved initially. During the night, photodegradation was no longer involved, and microbial activity was the major process, accounting for 66% (Cloud 2) and 76% (Cloud 3) of H2O2 degradation, while non-photochemical abiotic reactions only
accounted for 34 % (Cloud 2) and 24 % (Cloud 3). These reactions were too slow to be measured in Cloud 1 during the first few hours. Clearly, the impact of microbial activity controlling the oxidant capacity in warm clouds may be important, particularly at night, when it may be dominant.
In addition, the results obtained during the combined photo-biodegradation processes indicate that photo-produced radicals are not toxic to cloud microflora; this statement is consistent with the oxidative stress metabolism of microorganisms. This type of metabolism involves not only catalases but also peroxidases and superoxide dismutase, as well as other non-enzymatic antioxidants (31).
Microbial energetic states in real cloud water microcosms
In the previous section, we noted that microorganisms were exposed to photo-produced radicals, which are known to be potentially toxic to microbial cells. Therefore, we investigated the ability of cloud microorganisms to resist these oxidative stresses by quantifying the ADP/ATP ratios during the same incubations. Essentially, growing bacteria present a ratio of ~ 0.25, whereas dead cells have a ratio > 6 (35). The plots presented in Figure 2 reflect the evolution of the energetic states of these microorganisms over time. In all cases, the microbial energetic state improved over time as the ADP/ATP ratios decreased. The microorganisms in Clouds 2 and 3 had similar initial energetic states (ADP/ATP ratios of 0.3 and 0.5, respectively) that decreased slightly over the incubation period and reached 0.1 and 0.2, respectively, after 72 hours. The initial energetic state of bacteria from Cloud 1 was lower (ADP/ATP ratio 1.4) than the other cloud samples. This difference could be due to some specific, unfavorable stress that was encountered by the
8 microorganisms during the air-mass history. The ADP/ATP ratio increased over time and attained an energetic state that was similar to Clouds 2 and 3 after 72 h. This recovery of a higher energetic state after 72 h reflects an activation of the microbial metabolism. Consequently, the biodegradation rate of H2O2 increased, as displayed in Figure 1 (Cloud 1),
when microorganisms were present in the incubation medium.
The ADP/ATP ratios during the microbial incubations under dark and UV light conditions were similar. Clearly, photodegradation in the presence of H2O2, notably the production of
•OH radicals under light conditions, did not affect the cells' energy metabolism. This result is
in agreement with the additive nature of the photochemical and biological processes that are involved in H2O2 degradation (Table 2).
Impact of the presence of reactive oxygen species on the biotransformation of carboxylic acids and formaldehyde in real cloud water microcosms
Formate, acetate, succinate, oxalate, malonate and formaldehyde were also measured in the 4 incubation regimes that were used for H2O2. Focusing on Cloud 2, the evolution of the
concentrations of carboxylic acids and formaldehyde are plotted in Figure 3, and the production and degradation rates of carboxylic acids and formaldehyde are presented in Table 3. Because they are very similar to Cloud 2, the results for the other clouds are presented in SI (Figures S4, S5). Acetate, formate and succinate were only degraded in the presence of microorganisms, while oxalate was only degraded in the presence of UV light. Malonate and formaldehyde were photo-produced during the experiment and degraded in the presence of microorganisms. The biotransformation was not delayed for acetate, succinate, malonate and formaldehyde, while in the case of formate, we observed a lag time (up to 48 h) before the biodegradation began. The degradation of oxalate by UV light in the absence of microorganisms indicated that photochemical reactions were involved. This conclusion is consistent with the concomitant H2O2 photolysis under the same conditions (see section 3.2).
It is also important to note that the degradation rates in the "reference" sample were close to zero, demonstrating that the major processes were photodegradation and biodegradation.
The most interesting results clearly show that the endogenous microflora were not inhibited by the presence of reactive oxygen species (H2O2 and photo-produced •OH radicals). In the
case of acetate, formate and succinate, the degradation rates that were measured for
"Microorganisms" (15.5, 17.5 and 4.5 × 10⁻¹¹ M s-1, respectively) and "Microorganisms +
Light" (15.6, 16.1 and 3.5 × 10⁻¹¹ M s-1, respectively) were very similar. Therefore, the presence of light, and, thus, of •OH radicals, had no influence on microbial carbon
9 metabolism. In the case of formaldehyde, the photo-production rate was 0.2 × 10⁻¹¹ M s-1 ("Light"), while the biodegradation rate ("Microorganisms") was 0.3 × 10⁻¹¹ M s-1. When the two processes were combined ("Microorganisms + Light"), the resulting rate of transformation was null, indicating that the addition of the processes occurred without any inhibition. The case of malonate is rather similar to that of formaldehyde; the rate observed during the combined photo-biodegradation processes after 36 hours (4.3 × 10⁻¹¹ M s-1) corresponded to the addition of the photo-production rate (0.3 × 10⁻¹¹ M s-1) and the biodegradation rate (4.2 × 10⁻¹¹ M s-1). The conclusions related to Cloud 2 can be extended to Clouds 1 and 3 (see comments in the SI text); they are straightforward in the case of Cloud 3, while the case of Cloud 1 is more complex to interpret. This difficulty in interpretation could be due to the unusually low concentration of organic and inorganic compounds in Cloud 1 (Table 1) and to the lower initial energetic state of the microorganisms (see Figure 2), which explains why biodegradation only began after 72 hours. Global comments about the 3 clouds are provided in the SI section and are related to Figures S4 and S5 and Table S3, which lists all of the transformation rates.
The principle of the non-inhibition of reactive oxygen species to the biodegradation process was observed in all of the study clouds, and the addition of the various photo- and bio-transformation rates remains valid (see SI). This result has major consequences when considering the impact of microbial activity on carbon budgets. It suggests that microorganisms could play a role not only in cloud chemistry at night, as previously indicated (27-29), but also during the daytime, when •OH radicals are photo-produced. The implication of microorganisms in carbon flux in the atmosphere at the global scale was estimated (see SI and Table S4). This rough calculation results in a global release of 51 to 215 million tons of CO2 per year through microbial respiration.
Conclusions
We studied microbial activity in real cloud samples that represent the 3 major categories of air-masses on the puy de Dôme mountain (marine, continental and urban origins). Their physical and chemical compositions thus represented varied experimental scenarios, and the endogenous microflora in each sample were likely to be different. Indeed, the microbial composition of cloud waters greatly depends on the sources of microbial aerosolization (vegetation, oceans, urban areas, etc.) that are present on the air-mass trajectories and also on the chemical composition of clouds, which can favor the survival of some species over others
10 (11). During their transport over long distances, these microorganisms have been subjected to numerous stresses, including evaporation-condensation cycles; nevertheless, they remained active, as shown by their good energetic states (ADP/ATP ratios range to 0.3 to 1.4) and their efficiency at bio-degradation. Microorganisms can adapt very easily to changing conditions and stresses in the atmosphere, as observed in other extreme environments (36).
Our experiments were conducted in innovative microcosms that were designed to mimic more realistic environmental cloud conditions. Using unfiltered samples in a homemade photo-bioreactor, we investigated the activities of microorganisms that were exposed to UV light and H2O2,which is a major source of •OH radicals in cloud waters. The experiments that
combined both the photo and biodegradation processes were compared to experiments with bio-degradation (absence of UV light) or photo-degradation alone (filtered sample).
First, our results indicate that the microorganisms that were present in the cloud samples and exposed to UV light remained metabolically active in the presence of •OH radicals that were photo-produced from H2O2 due to the oxidative stress metabolism of the cells. This
phenomenon is clearly demonstrated by the similar ADP/ATP ratios that were measured when the microorganisms were exposed or not exposed to UV light, indicating that the microbial energetic state was unchanged. This result was also clearly demonstrated by the degradation rates under combined conditions ("Microorganisms + Light"), where photo-degradation and biodegradation are additive processes. There was no inhibition of microbial activities towards the organic, biodegradable compounds (acetate, formate, succinate, malonate, and formaldehyde) that were tested in the presence of reactive oxygen species. This information is particularly important when considering the potential role of microorganisms in cloud chemistry and the resulting carbon balance. Previously, studies were conducted in the absence of such reactive oxygen species, and the resulting biodegradation rates were subject to debate. The results obtained here reinforce the hypothesis that the actual activity of microorganisms in clouds is an alternative route in photochemistry. These two transformation processes could coexist in cloud droplets and be modulated by the bio-physico-chemical conditions that are encountered in natural warm clouds.
Second, and most importantly, we have demonstrated that H2O2, a precursor to oxidant
species in clouds, is biodegraded by the endogenous microflora through the actions of catalases. To our knowledge, this is the first report of such an effect in the atmospheric environment. Moreover, the biodegradation process is significant compared to the photochemical process. This finding has major consequences for atmospheric chemistry
11 because it shows that microorganisms may have an impact on the oxidant capacity of clouds. This concept is clearly new and should be considered in much greater detail.
However, we are aware that our microcosms are still unlike real cloud systems, which are polydisperse, with highly variable spatial and temporal parameters. However, this work suggests that microorganisms could play a double role in atmospheric chemistry and, more specifically, on the carbon budget of the atmosphere. First, they could directly metabolize organic carbon species. Second, they could destroy a portion of the source of radicals due to their oxidative metabolism, and, as a result, these molecules, such as H2O2, would no longer
be available for photochemical or other chemical reactions.
Materials and methods
Three cloud water samples from 3 different origins were collected at the puy de Dôme station in 2010 and were analyzed chemically and biologically. They were incubated in photo-bioreactors at 17°C under 4 incubation regimes for 7 days: unfiltered and in the presence or absence of UV radiation ("Microorganisms + Light" and "Microorganisms", respectively), and filtered and in the presence or absence of UV radiation ("Light" and "Reference", respectively). We recorded the concentrations of formate, acetate, oxalate, succinat, malonate, formaldehyde, H2O2, and the ADP/ATP ratio during the incubation period. Additional details
about the methodology are provided in the SI Text.
Acknowledgments
The research was funded by the CNRS/INSU and the French Ministry of Research under the LEFE-CHAT program. M. Vaïtilingom thanks the French Ministry of Research for Ph.D. scholarships. Bruce Moffett is gratefully acknowledged for correcting the manuscript. We thank warmly C. Bernard and M. Ribeiro for the technical support.
References
1. Lim YB, Tan Y, Perri MJ, Seitzinger SP, & Turpin BJ (2010) Aqueous chemistry and its role in secondary organic aerosol (SOA) formation. Atmos. Chem. Phys. 10(21):10521-10539.
2. Ervens B, Turpin BJ, & Weber RJ (2011) Secondary organic aerosol formation in cloud droplets and aqueous particles (aqSOA): a review of laboratory, field and model studies. Atmos. Chem. Phys. 11(21):11069-11102.
12 4. Herrmann H, Hoffmann D, Schaefer T, Bräuer P, & Tilgner A (2010) Tropospheric Aqueous-Phase Free-Radical Chemistry: Radical Sources, Spectra, Reaction Kinetics and Prediction Tools. Chem. Phys. Chem. 11(18):3796-3822.
5. Deguillaume L, et al. (2005) Transition Metals in Atmospheric Liquid Phases: Sources, Reactivity, and Sensitive Parameters. Chem. Rev. 105(9):3388-3431.
6. Sander R (1999) Compilation of Henry's Law Constants for Inorganic and Organic Species of Potential Importance in Environmental Chemistry (Version 3).
7. Chebbi A & Carlier P (1996) Carboxylic acids in the troposphere, occurrence, sources, and sinks: A review. Atmos. Environ. 30(24):4233-4249.
8. Löflund M, et al. (2002) Formic, acetic, oxalic, malonic and succinic acid concentrations and their contribution to organic carbon in cloud water. Atmos.
Environ. 36(9):1553-1558.
9. Marinoni A, Laj P, Sellegri K, & Mailhot G (2004) Cloud chemistry at the Puy de Dôme: variability and relationships with environmental factors. Atmos. Chem. Phys. 4(3):715-728.
10. Legrand M, et al. (2007) Origin of C2-C5 dicarboxylic acids in the European
atmosphere inferred from year-round aerosol study conducted at a west-east transect.
J. Geophys. Res. 112(D23):D23S07.
11. Burrows SM, Elbert W, Lawrence MG, & Pöschl U (2009) Bacteria in the global atmosphere - Part 1: Review and synthesis of literature data for different ecosystems.
Atmos. Chem. Phys. 9(3):10777-10827.
12. Womack AM, Bohannan BJM, & Green JL (2010) Biodiversity and biogeography of the atmosphere. Philosophical Transactions of the Royal Society B: Biological
Sciences 365(1558):3645-3653.
13. Delort A-M, et al. (2010) A short overview of the microbial population in clouds: Potential roles in atmospheric chemistry and nucleation processes. Atmos. Res. 98(2-4):249-260.
14. Després VR, et al. (2012) Primary biological particles in the atmosphere : a review.
Tellus B 64:1-58.
15. Pöschl U, et al. (2010) Rainforest aerosols as biogenic nuclei of clouds and precipitation in the Amazon. Science (New York, N.Y.) 329(5998):1513-1516.
16. Jones AM & Harrison RM (2004) The effects of meteorological factors on atmospheric bioaerosol concentrations: a review. Sci. Tot. Env. 326(1-3):151-180. 17. Sattler B, Puxbaum H, & Psenner R (2001) Bacterial growth in supercooled cloud
droplets. Geophys. Res. Lett. 28(2):239-242.
18. Christner BC (2002) Incorporation of DNA and Protein Precursors into Macromolecules by Bacteria at -15oC. Appl. Environ. Microbiol. 68(12):6435-6438. 19. Junge K, Eicken H, Swanson BD, & Deming JW (2006) Bacterial incorporation of
leucine into protein down to -20 °C with evidence for potential activity in sub-eutectic saline ice formations. Cryobiology 52(3):417-429.
20. Rivkina EM, Friedmann EI, McKay CP, & Gilichinsky DA (2000) Metabolic activity of permafrost bacteria below the freezing point. Appl. Environ. Microbiol. 66(8):3230-3233.
21. Bauer H, et al. (2002) The contribution of bacteria and fungal spores to the organic carbon content of cloud water, precipitation and aerosols. Atmos. Res. 64(1-4):109-119.
22. Ahern HE, Walsh KA, Hill TCJ, & Moffett BF (2007) Fluorescent pseudomonads isolated from Hebridean cloud and rain water produce biosurfactants but do not cause ice nucleation. Biogeosciences 4(1):115-124.
13 23. Vaïtilingom M, et al. (2012) Long-term features of cloud microbiology at the puy de
Dôme (France). Atmos. Environ. 56(0):88-100.
24. Amato P, et al. (2007) An important oceanic source of micro-organisms for cloud water at the Puy de Dôme (France). Atmos. Environ. 41(37):8253-8263.
25. Amato P, et al. (2007) A fate for organic acids, formaldehyde and methanol in cloud water: their biotransformation by microorganisms. Atmos. Chem. Phys. 7(15):4159-4169.
26. Ariya PA, Nepotchatykh O, Ignatova O, & Amyot M (2002) Microbiological degradation of atmospheric organic compounds. Geophys. Res. Lett. 29(22):2077-2081.
27. Husárová S, et al. (2011) Biotransformation of methanol and formaldehyde by bacteria isolated from clouds. Comparison with radical chemistry. Atmos. Environ. 45:6093-6102.
28. Vaïtilingom M, et al. (2010) Contribution of microbial activity to carbon chemistry in clouds. Appl. Environ. Microbiol. 76(1):23-29.
29. Vaïtilingom M, et al. (2011) Atmospheric chemistry of carboxylic acids: microbial implication versus photochemistry. Atmos. Chem. Phys. 11(16):8721-8733.
30. Kreiner M, Harvey LM, & McNeil B (2002) Oxidative stress response of a recombinant Aspergillus niger to exogenous menadione and H2O2 addition. Enzyme
Microb. Technol. 30(3):346-353.
31. Sigler K, Chaloupka J, Brozmanová J, Stadler N, & Höfer M (1999) Oxidative stress in microorganisms — I. Microbial vs. higher cells-damage and defenses in relation to cell aging and death. Folia Microbiologica 44(6):587-624.
32. Amato P, et al. (2005) Microbial population in cloud water at the Puy de Dôme: Implications for the chemistry of clouds. Atmos. Environ. 39(22):4143-4153.
33. Gunz DW & Hoffmann MR (1990) Atmospheric chemistry of peroxides: a review.
Atmospheric Environment. Part A. General Topics 24(7):1601-1633.
34. Deguillaume L, Leriche M, Monod A, & Chaumerliac N (2004) The role of transition metal ions on HOx radicals in clouds: a numerical evaluation of its impact on
multiphase chemistry. Atmos. Chem. Phys. 4(1):95-110.
35. Koutny M, et al. (2006) Acquired biodegradability of polyethylenes containing pro-oxidant additives. Polym. Degrad. Stab. 91(7):1495-1503.
36. Roszak DB & Colwell RR (1987) Survival strategies of bacteria in the natural environment. Microbiol Rev. 51(3):365-379.
14
Figure captions
Figure 1: Temporal evolution of H2O2 concentrations (µM) in the presence or absence of UV
light and/or microorganisms during incubation of cloud water (Clouds 1, 2, 3). Cloud water samples were incubated at 17°C under 4 incubation regimes for 7 days: unfiltered and in the presence or absence of UV radiation ("Microorganisms + Light" and "Microorganisms", respectively), filtered and in the presence or absence of UV radiation ("Light" and
"Reference", respectively). Error bars represent the standard errors of the enzymatic assay
(5%).
Figure 2: [ADP] / [ATP] ratios of microbial cells in the presence and absence of UV-light during the incubation of unfiltered cloud water samples (Clouds 1, 2, 3).
Figure 3: Temporal evolution of carboxylic acids and formaldehyde concentrations during the incubation of Cloud 2. The Cloud 2 water sample was incubated at 17°C under 4 incubation regimes for 7 days: unfiltered and in the presence or absence of UV radiation ("Microorganisms + Light" and "Microorganisms", respectively), filtered and in the presence or absence of UV radiation ("Light" and "Reference", respectively). Error bars represent the standard errors of the chemical analysis (5%).
15
Figure captions
Figure 1: Temporal evolution of H2O2 concentrations (µM) in the presence or absence of UV light
and/or microorganisms during incubation of cloud water (Clouds 1, 2, 3). Cloud water samples were incubated at 17°C under 4 incubation regimes for 7 days: unfiltered and in the presence or absence of UV radiation ("Microorganisms + Light" and "Microorganisms", respectively), filtered and in the presence or absence of UV radiation ("Light" and "Reference", respectively). Error bars represent the standard errors of the enzymatic assay (5%).
Figure 2: [ADP] / [ATP] ratios of microbial cells in the presence and absence of UV-light during the incubation of unfiltered cloud water samples (Clouds 1, 2, 3).
Figure 3: Temporal evolution of carboxylic acids and formaldehyde concentrations during the incubation of Cloud 2. The Cloud 2 water sample was incubated at 17°C under 4 incubation regimes for 7 days: unfiltered and in the presence or absence of UV radiation ("Microorganisms + Light" and
"Microorganisms", respectively), filtered and in the presence or absence of UV radiation ("Light" and "Reference", respectively). Error bars represent the standard errors of the chemical analysis (5%).
16 Figure 1. 0 24 48 72 96 120 144 168 Time of incubation (h) 0 10 20 30 40 50 60 C o n c e n tr a ti o n o f H2 O2 (µ M ) 0 24 48 72 96 120 144 168 0 10 20 30 40 C o n c e n tr a ti o n o f H2 O2 (µ M ) 0 24 48 72 96 120 144 168 0 1 2 3 4 5 C o n c e n tr a ti o n o f H2 O2 (µ M ) Microorganisms + Light Light Microorganisms Reference Cloud 1 Cloud 2 Cloud 3
17 Figure 2. 0 24 48 72 96 120 144 168 Time of incubation (h) 0 0.2 0.4 0.6 0.8 1 1.2 1.4 [A D P ]/ [A T P ] ra ti o Cloud 1 - Light Cloud 1 - Dark Cloud 2 - Light Cloud 2 - Dark Cloud 3 - Light Cloud 3 - Dark
18 Figure 3. 0 24 48 72 96 120 144 168 0 10 20 30 C o n ce n tr at io n (µ M ) 0 24 48 72 96 120 144 168 0 10 20 30 40 50 0 24 48 72 96 120 144 168 0 1 2 3 4 5 0 24 48 72 96 120 144 168 0 1 2 3 4 0 24 48 72 96 120 144 168 1 2 3 4 Acetate Formate C o n ce n tr at io n (µ M ) 0 24 48 72 96 120 144 168 2 4 6 8 10 C o n ce n tr at io n (µ M ) Oxalate Malonate Succinate Formaldehyde
Time of incubation (h) Time of incubation (h)
Microorganisms+ light Light
Microorganisms Reference
19
Table captions
Table 1: Initial bio-physico-chemical characteristics for the 3 cloud events, sampled at the pdD station.
Table 2: Initial degradation rates of H2O2 in the presence and absence of UV light and/or
microorganisms during the incubation of natural cloud waters. A negative value indicates the disappearance of H2O2 from the medium. In the case where a non-continuous transformation
occurred, the time period used for the linear regression is indicated in brackets.
Table 3: Initial transformation rates of carboxylic acids and formaldehyde in the presence and absence of UV-light and/or microorganisms during the incubation of cloud 2. A negative value indicates the disappearance of the organic compounds from the medium. Values in bold represent production of the compounds in question. In the case where a non-continuous transformation occurred, the time period used for the linear regression is indicated in brackets.
20 Table 1.
Cloud 1 Cloud 2 Cloud 3
Air-mass origin North-western South-western North-earstern
Air-mass type Marine Continental Urban
Date of sampling 6/1/10 8:20 PM 6/8/10 12:05 PM 6/18/10 11:15 AM Duration of sampling 6:30 11:20 19:45 Temperature 10 °C 13.5 °C 10 °C pH 6.1 5.2 3.9 Conductivity (µS cm-1) 3.5 37.6 78.6 TOC (DOC) (mg L-1) 1.1 (1.1) 6.8 (6.7) 6.9 (6.8) Compound Concentration (µM) Acetate 4.5 25.4 23.2 Formate 4.9 42.7 33.2 Succinate - 3.1 3.8 Oxalate 1.0 9.7 9.3 Malonate - 3.1 3.5 Cl- 3.0 7.7 11.3 NO3 -4.5 70.6 228.7 SO4 2-1.8 46.1 64.0 Na+ 2.2 10.1 8.8 NH4 + 8.5 100.3 122.3 K+ - 1.5 2.2 Mg2+ 1.0 2.1 2.7 Ca2+ 1.7 3.8 3.8 Fe (total) 0.9 1.1 1.3 Fe (II) 0.3 0.5 0.5 Formaldehyde 1.5 2.7 6.1 H2O2 3.6 33.4 57.7 ATP (pmol mL-1) 0.8 2.3 2.1 ADP (pmol mL-1) 1.1 0.7 1.1
21
ADP/ATP ratio 1.4 0.3 0.5
Total fungal spores
and yeasts (cells mL-1) 9×10
3 3×10³ 3×10³ Total bacteria (cells mL-1) 3×10 4 8×10⁴ 9×10⁴
22 Table 2.
Cloud 1 Cloud 2 Cloud 3
Rate of H2O2 transformation ( × 10 -11 M s-1) Reference* 0 -9.8 -7.2 Light -0.6 -48.6 -105.1 Microorganisms -2.9 (72 h to end) -28.5 -30.0 Microorganisms + Light -0.9 -68.4 -126.9
23 Table 3.
Acetate Formate Succinate Oxalate Malonate Formaldehyde
Rate of transformation ( × 10-11 M s-1) Reference* 0 0 0 0 0 0 Light 0 0 0 -4.0 (0 h to 60 h) 0.3 (0 h to 60 h) 0.2 Microorganisms -15.5 -17.5 (48 h to end) -4.5 0 -4.2 (36 h to end) -0.3 Microorganisms + Light -15.6 -16.1 (48 h to end) -3.5 -2.7 (0 h to 60 h) -4.3 (36 h to end) 0
24
Supporting information
“Potential impact of microbial activity on the oxidant capacity and
organic carbon budget in clouds”
Vaïtilingom et al.
SI Text
Cloud water collection. Cloud water was sampled from the top of the puy de Dôme mountain (1465 a.s.l., ° ’ North, ° ’ East, Fra e , as des ri ed o the e site:
http://wwwobs.univ-bpclermont.fr/SO/beam. The study location is frequently covered by clouds and is disconnected from
local pollution. Two Cloud Water Samplers, developed by Kruisz et al. (1993) (1), were used with an estimated cut-off diameter of 7 µm, for an approximately debit rate of 80 m3 h-1 (2-3). The collection mechanisms on the CWS were sterilized using an autoclave (20 min at 121°C) before sampling, while the body parts were sterilized on site by washing them with ethanol (70% v/v) and extensively rinsing them with sterile, ultrapure water. After 30 min, to assess the microbial sterility and chemical purity of the freshly cleaned body parts, 50 mL of sterilized, ultrapure water were poured into the sampler a d re o ered i the olle tio parts la k sa ples . For the loud sa pli g e e ts prese ted i this paper, o i ro ial or he i al o ta i atio as o ser ed i the la k sa ples.
During sampling, the cloud water was recovered from the collector under sterile conditions when the volume in each collector reached 100 mL. A minimum volume of 600 mL of cloud water was necessary for the biological and chemical analyses listed in Table 1. After collection, samples were immediately frozen or kept at 4°C. Laboratory experiments were performed less than 2 h after the end of sampling.
Cloud water incubation. Half of the sample was sterilized by filtration (filter porosity 0.22 µm, nylon filter) to eliminate microorganisms. The filtered and unfiltered samples were incubated for 7 days in the dark or under UV light. The experiments were carried out at a constant temperature of 17°C, a value slightly different from the temperature during the cloud sampling events (10°C, 13.5°C and 10°C, for Clouds 1, 2 and 3, respectively). The incubator chamber was equipped with a stirring plate
25 (aerobic condition, 110 rpm) under a fluorescent tube that emitted radiation with wavelengths between 340- λmax=365 nm and total light energy: 33 J s-1 m-2). For incubation in darkness,
two brown 250 mL Erlenmeyer flasks were used. For incubation under UV light emission, two photo-bioreactors were used (see Figure S1). These photo-photo-bioreactors consisted of a cylindrical Pyrex crystallizer (300 mL, 95 mm diameter) covered with a Pyrex® glass filter ( 3.3 mm thick and 80 mm Ø) and mounted on a nylon lid that was equipped with 8 vents (Teflon® tubes of 8 mm Ø, plugged with sterile cotton wool to avoid microbial contamination) to prevent water condensation on the filter and to maintain continuous oxygenation in the tested medium. Preliminary tests in artificial cloud water solutions have shown that there was no effect of the incubation flask type on the transformation rates. Bio- and chemical analyses were conducted after the cloud water collection and at various times during the incubation, as indicated in Table 1.
Chemical analyses.
Conductivity, pH, total and dissolved organic carbon. Conductivity and pH were measured on-site with a portable multi-parameter pH-meter that was equipped with a temperature sensor. The total organic carbon (TOC) and dissolved organic carbon (DOC) were measured with a TOC analyzer (TOC 5050A, Shimatzu©). Five mL of filtered (filter porosity 0.22 µm) and non-filtered samples were used for DOC and TOC measurements, respectively, as described in Parazols et al. (2007) (4).
Fe(II), Fe(III). The iron (Fe) concentrations (Fe(II) and Fe(III)) were measured with a spectrophotometric assay with a colorimetric complexant (ferrozine) (Stokey (1970) (5)) that was used for cloud water analyses by Parazols et al. (2007) (4). To determine the concentrations of Fe(II) and Fe(Total), 2×1 mL samples were necessary. The uncertainty in the measurements was less than 10%, and the detection limit (DL) was 0.1 µM (calculated as three times the standard deviation of the field blanks).
Ionic species. The ion concentrations in the cloud water samples were measured using ionic chromatography (3, 6) units: Dionex DX320 for anions (column AS11, eluent KOH) and Dionex ICS1500 for cations (column CS16, eluent hydroxymethanesulfonate acid). Samples were thawed 15 min before their dilution by a factor of 10 in ultrapure water and transferred into vials (5 mL) previously rinsed with ultrapure water. No chemical transformations were observed in our samples after one freeze/thaw cycle. The accuracy of the ion chromatographic analyses was 5% (3).
26 Formaldehyde. The formaldehyde concentration was measured using a miniaturized fluorimetric assay that was adapted from Li et al., (2007) (7). The reaction medium included 60 µL of ammonium acetate solution (4 M), 60 µL of acetoacetanilide (0.2 M in ethanol solution 50% v/v), 60 µL of ethanol (96°) and 120 µL of the cloud water sample. The solutions were mixed and incubated on a plate with ninety-six black, flat bottomed wells at roo te perature for i efore readi g λex=
a d λem= 490 nm). The uncertainty in the measurements was less than 5%, and the DL was
0.1 µM (calculated as three times the standard deviation of the field blanks).
H2O2. The hydrogen peroxide concentration was measured using an accurate enzymatic fluorimetric
assay with a 4-Hydroxyphenylacetic acid that produced a fluorescent dimeric compound with hydrogen peroxide (microassay adapted from Lazrus et al., (1985) (8)). 1.5 mL of a solution of 4-Hydroxyphenylacetic acid (1.5 mM) in a phosphate buffering solution (0.1 M, pH 7.4) was mixed with 10 µL of a horse radish peroxydase solution (380 units mL-1) to constitute the reagent solution; this solution was kept at 5°C for less than 12 h. After sampling (less than 5 min), 10 and 50 µL of the cloud water sample were mixed on-site with 200 µL of the reagent solution in duplicates and incubated at room temperature (>17°C) for 5 min before freezing at -25°C. A new calibration was systematically performed before each analysis session, with a normalized H2O2 solution with a different
concentration (0 to 200 µM) using the same reagent lot. Before the analysis, the mixed samples (cloud water + reagent) were thawed at ambient temperature for 10 min, and 200 µL were analyzed. Previous tests indicated that the fluorescent dimeric compound remained stable after this freeze/tha pro ess. Fluores e e readi gs λex= a d λem= 390 nm) were made in a 96 well
format. The uncertainty of the measurements was less than 5%, and the detection limit was 0.07 µM. To determine the concentration of organic peroxides, samples were treated with catalase. After 30 seconds, 200 µL of the reagent solution was added, and the previous protocol was applied. For all cloud waters, the organic peroxide concentrations were lower than the limit of detection (0.07 µM).
Biological analyses. A direct enumeration of cells (duplicates, 10 mL) was performed with epifluorescence microscopy, as described by Amato et al., (2005) (9). The main difference in methods was in the use of a phosphate buffering solution (pH = 7) to improve the fluorescence efficiency. The ATP and ADP concentrations were measured in cloud water samples (0.2 mL) using the ATP Biomass Kit HS (Biothema©) and a Biolumineter (Lumac Biocounter M2500). The analytical protocol was described in (10).
27 The cloud water samples (0.2 mL) were strongly mixed in situ in a sterile microtube with an equal volume of extractant B/S, from the ATP Biomass Kit HS (Biothema©). This mixture was used for ATP determination and was stored frozen prior to the analysis. The ATP concentrations were determined by bioluminescence (11-12) using a Biolumineter (Lumac Biocounter M2500). The ADP concentration was determined after the direct transformation of ADP to ATP in the luminometer tube, in the presence of pyruvate kinase and phosphoenolpyruvate; this analytical protocol is described in (10). A small volume of the mixture (sample + extractant B/S: 60 µL) was used to determine the ATP or ADP concentration.
Calculations of the transformation rates. To calculate the initial transformation rates, the temporal evolution of the concentration of each compound was plotted. Then, the pseudo-first order decay
k s-1) was determined (only for r²>0.8) using the following linear regression:
[C]/[C]
f t k tln 0
The transformation rate of the compound C (vc) was determined as follows:
t
c k C
v [ ] [M-1 s-1]
Where [C]t is the concentration of the chemical compound C (mol L-1) at time t (s), and k is the
pseudo-first order decay (s-1).
H2O2 degradation: relative contribution of biotic and abiotic processes. To quantify the relative
impact of biotic activity compared to abiotic H2O2 transformations, we corrected some of our data.
We used the initial degradation rate of H2O2 in the absence of microorganisms and light (reference
sample) to quantify the impact of the radical reactions that were non-photochemically induced. For photodegradation and biodegradation, we have subtracted this value from the initial rates that were measured in the presence of light, or microorganisms, respectively (Table S2). From these corrected values, it was possible to calculate the relative contribution of each type of reaction (Figure S3).
Bio- and phototransformation of carboxylic acids and formaldehyde in cloud samples. The concentrations of formate, acetate, succinate, oxalate, malonate and formaldehyde were recorded at °C u der i u atio o ditio s Microorganisms + Light , Light , Microorga is s ,
28 "Refere ce ) for the 3 cloud water samples (see Figure 3, S4 and S5). The transformation rates that were measured in these experiments are listed in Table S3.
Under dark conditions with the endogenous microbial population ( Microorga is s case), the acetate and formate biodegradation rates were much higher than those of succinate, malonate and formaldehyde for the 3 cloud events. For formate, a lag time was observed in Clouds 1 and 2, as already noted for Cloud 2. For malonate, 2 kinetic steps took place in Clouds 2 and 3: until 36 h, the rates were slow but then increased dramatically. Oxalate was not biodegraded in any of the samples; this lack of degradation was also observed with selected bacterial strains that were isolated from cloud water (13).
U der UV light o ditio s Light ) with filtered cloud water, only the succinate concentrations did not evolve. Formaldehyde was continuously photo-produced, due to the production of •OH from H2O2 photolysis. Malonate was photo-produced up to a stationary concentration (60 h) (Clouds 2 and
3). Oxalate was photo-degraded up to a stationary state (60 h) that corresponded to the consumption-time of H2O2 in these sample (Clouds 2 and 3). Formate was slowly degraded in Cloud
3, up to 48 h, and was not degraded in Cloud 2. The behavior of Cloud 1 was somewhat different; a slow photo-production of acetate and formate was observed, while oxalate was degraded continuously until the end of the experiment and was correlated with the presence of H2O2. The
variations in the rates of organic compound photo-transformation were related to the initial H2O2
concentrations in the 3 cloud waters (see Tables 1 and 2). The end of these transformations was, consequently, linked to the total consumption of H2O2. In summary, from the observations that were
made during incubations under UV light, the temporal evolutions of organic compound concentrations were highly variable, resulting from both the production and photo-degradation processes. For Cloud 1, the photo-photo-degradation rate was very low because the H2O2
concentration was 10 to 20 times lower than that in Clouds 2 and 3, respectively.
In the presence of UV light and microorganisms ( Microorga is s + Light case), we observed the sum of photochemical and microbial activities without synergy or inhibition. In Clouds 2 and 3, the degradation rates of acetate, formate and succinate, were similar with and without UV light because these compounds were not involved in any photochemical processes. For oxalate, the degradation rates were the same for light alone and light plus microorganisms; this observation is in agreement with the non-biodegradability of this compound (Clouds 2 and 3). Finally, for malonate, production and destruction are competitive (Clouds 2 and 3). During the first part of the kinetic (up to 48 h), photo-production dominated. Then, after 36 h, biodegradation began and became dominant. A similar behavior was noted for the degradation of acetate in Cloud 1. The first photo-production
29 occurred before 72 h, and biodegradation then took over the relay. Formaldehyde was photo-produced and biodegraded. The apparent non-transformation of formaldehyde in the cloud waters in the presence of UV light and microorganisms (especially for Clouds 2 and 3) revealed the competition between these two processes.
For all experiments, the organic compound bio-transformation rates were similar between incubation under UV light or in darkness, and we did not observe an inhibition effect of ROS over the microbial carbon metabolism.
Estimation of the global consequences of microorganisms in carbon flux in the atmosphere. From the number of cells (Table 1) and the degradation rates that were measured in the unfiltered microcosms that were incubated in the dark (i.e., the biodegradation rates, converted into gC h-1 cell
-1) (Tables 3 and S4), we inferred the consumption of dissolved organic carbon species by
microorganisms in clouds at the global scale (Table S4). Assuming a total mass of clouds of 1.94 × 10¹⁷ g on earth (14), microorganisms would constitute between 13 and 60 million tons of dissolved organic carbon, originating from formate, acetate, oxalate, malonate, succinate and formaldehyde each year, on a global scale (results are based on Clouds 1 and 2, respectively, in which the extreme lower and upper levels of microbial activity were measured). This is a conservative estimate of the total dissolved organic carbon biodegradation in clouds because other carbon compounds not measured here were most likely also consumed by cells. If we assume a bacterial growth efficiency on those compounds of 0 (i.e., these carbon sources are not used by microorganisms for producing biomass but are completely respired into CO2), which is close to reality at low carbon concentrations
(15), then the microbial respiration would lead to a global release of 51 to 215 million tons of CO2 per
30
Figure Captions
Figure S1. Photo-bioreactor used for cloud water incubation under UV light.
(1) Pyrex filter, (2) nylon lid, (3) Teflon® tube of 8 mm Ø plugged with sterile cotton (8 vents), (4) cylindrical Pyrex crystallizer.
Figure S2. 48 h backward trajectories from the NOAA Hysplit model of Clouds 1, 2 and 3.
Figure S3. Relative contribution of biotic and abiotic processes to H2O2 degradation during the
i u atio of Clouds a d . Light i lue orrespo ds to pure photo he i al pro esses, Other (in red) corresponds to non-photo he i ally i du ed radi al pro esses, a d Mi roorga is s i green) corresponds to a pure biodegradation processes. Percentages were calculated from the initial rates of degradation that were reported in Table S2.
Figure S4. Temporal evolution of carboxylic acids and formaldehyde concentrations during the incubation of Cloud 1. The Cloud 1 water sample was incubated at 17°C under 4 incubation regimes for 7 days: unfiltered and in the presence or absence of UV radiation ("Microorganisms + Light" and
"Microorganisms", respectively), filtered and in the presence or absence of UV radiation ("Light" and "Reference", respectively).
Error bars represent the standard errors of the chemical analysis (5%).
Figure S5. Temporal evolution of carboxylic acids and formaldehyde concentrations during the incubation of Cloud 3. The Cloud 3 water sample was incubated at 17°C under 4 incubation regimes for 7 days: unfiltered and in the presence or absence of UV radiation ("Microorganisms + Light" and
"Microorganisms", respectively), filtered and in the presence or absence of UV radiation ("Light" and "Reference", respectively).
31 Figure S1. (1) (2) (3) (4)
32 Figure S2.
33 Figure S3.
34%
66%
Cloud 2
Light Other Microorganisms
24%
76%
Cloud 3
Light Other Microorganisms
54% 16%
30%
Cloud 2
Light Other Microorganisms
76% 6%
18%
Cloud 3
Light Other Microorganisms
Day-time
34 Figure S4. 0 24 48 72 96 120 144 168 0 5 10 15 C o n ce n tr a ti o n (µ M ) 0 24 48 72 96 120 144 168 0 5 10 15 0 24 48 72 96 120 144 168 Time of incubation (h) 0 0.5 1 1.5 2 C o n ce n tr a ti o n (µ M ) 0 24 48 72 96 120 144 168 Time of incubation (h) 0 1 2 3 Acetate Formate Oxalate Formaldehyde Microorganisms+ light Light Microorganisms Reference
35 Figure S5. 0 24 48 72 96 120 144 168 0 5 10 15 20 25 30 35 40 0 24 48 72 96 120 144 168 0 5 10 15 C o n ce n tr a ti o n (µ M ) 0 24 48 72 96 120 144 168 0 1 2 3 4 5 0 24 48 72 96 120 144 168 Time of incubation (h) 0 1 2 3 4 5 C o n ce n tr a ti o n (µ M ) 0 24 48 72 96 120 144 168 Time of incubation (h) 0 5 10 15 Formate Oxalate Succinate Formaldehyde Malonate Acetate 0 24 48 72 96 120 144 168 0 10 20 30 C o n ce n tr a ti o n (µ M ) Microorganisms+ light Light Microorganisms Reference
36
During incubation time
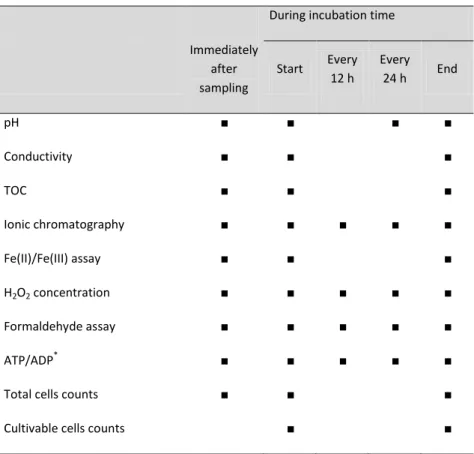
Immediately after sampling Start Every 12 h Every 24 h End pH ■ ■ ■ ■ Conductivity ■ ■ ■ TOC ■ ■ ■ Ionic chromatography ■ ■ ■ ■ ■ Fe(II)/Fe(III) assay ■ ■ ■ H2O2 concentration ■ ■ ■ ■ ■ Formaldehyde assay ■ ■ ■ ■ ■ ATP/ADP* ■ ■ ■ ■ ■
Total cells counts ■ ■ ■
Cultivable cells counts ■ ■
*
Only performed at the beginning and end of the incubation for the filtered (sterilized) samples to assess the sterility.
After 2 and 6 hours of incubation, ionic chromatography analyses and H2O2 assays were performed for each
sample.
37
Cloud 1 Cloud 2 Cloud 3
Initial rate of H2O2 transformation (× 10
-11
M s-1)
Abiotic processes Light -0,9 -33,8 -97,9
Other 0 -9,8 -7,2
Biotic processes Microorganisms 0 -18,7 -22,8
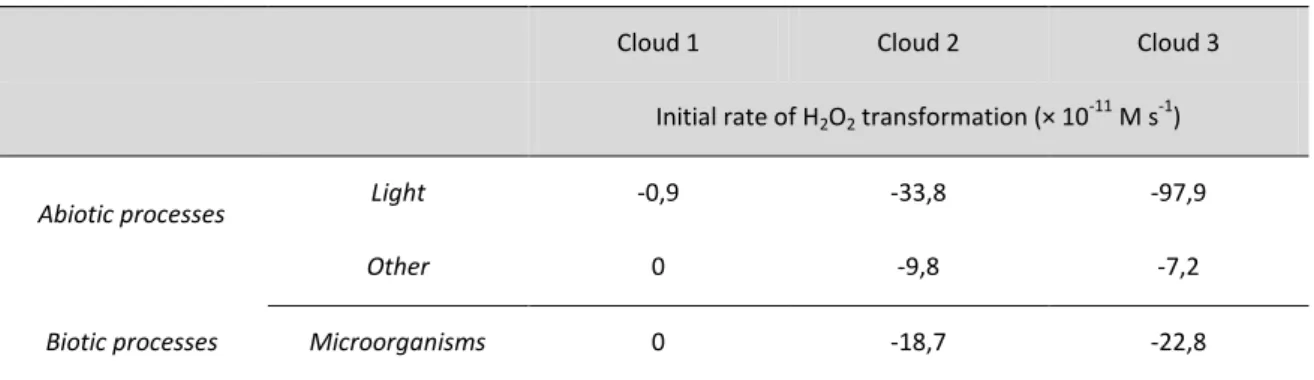
Table S2. Calculated values of the initial transformation rates of H2O2, linked to biotic and abiotic
processes occurring during the incubation of Clouds 1, 2 and 3. "Light" corresponds to pure photochemical processes, "other" corresponds to non-photochemically induced radical processes, and "microorganisms" corresponds to pure biodegradation processes. Negative values indicate the
38
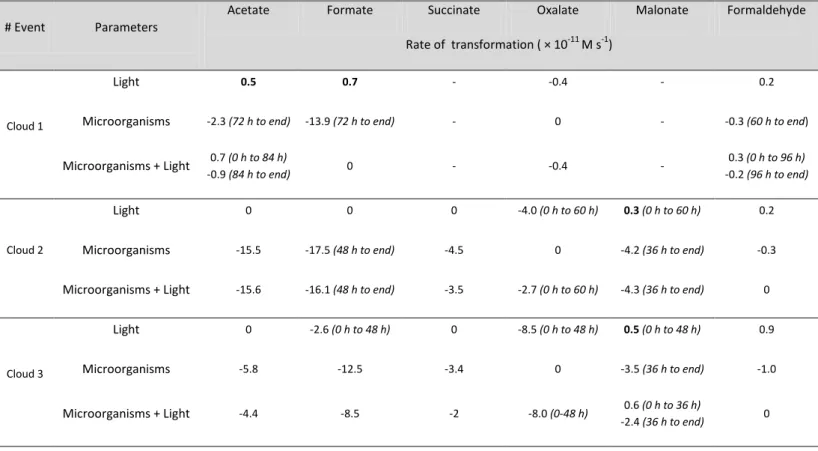
# Event Parameters
Acetate Formate Succinate Oxalate Malonate Formaldehyde
Rate of transformation ( × 10-11 M s-1)
Cloud 1
Light 0.5 0.7 - -0.4 - 0.2
Microorganisms -2.3 (72 h to end) -13.9 (72 h to end) - 0 - -0.3 (60 h to end)
Microorganisms + Light 0.7 (0 h to 84 h) -0.9 (84 h to end) 0 - -0.4 - 0.3 (0 h to 96 h) -0.2 (96 h to end) Cloud 2 Light 0 0 0 -4.0 (0 h to 60 h) 0.3 (0 h to 60 h) 0.2
Microorganisms -15.5 -17.5 (48 h to end) -4.5 0 -4.2 (36 h to end) -0.3
Microorganisms + Light -15.6 -16.1 (48 h to end) -3.5 -2.7 (0 h to 60 h) -4.3 (36 h to end) 0
Cloud 3
Light 0 -2.6 (0 h to 48 h) 0 -8.5 (0 h to 48 h) 0.5 (0 h to 48 h) 0.9
Microorganisms -5.8 -12.5 -3.4 0 -3.5 (36 h to end) -1.0
Microorganisms + Light -4.4 -8.5 -2 -8.0 (0-48 h) 0.6 (0 h to 36 h)
-2.4 (36 h to end) 0
- No tra sfor atio s o ser ed for the refere e sa ple i.e., sterilized sa ple i u ated i darkness).
Table S3. Initial transformation rates of carboxylic acids and formaldehyde in the presence and absence of UV light and/or microorganisms during the incubation of cloud 2. A negative value indicates the disappearance of the organic compounds from the medium. Values in bold represent production of the study compounds. In the case where a non-continuous transformation occurred,
39
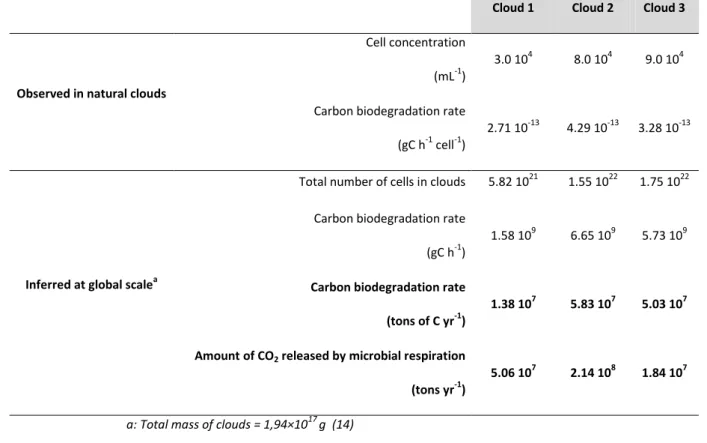
Cloud 1 Cloud 2 Cloud 3
Observed in natural clouds
Cell concentration
(mL-1)
3.0 104 8.0 104 9.0 104
Carbon biodegradation rate
(gC h-1 cell-1)
2.71 10-13 4.29 10-13 3.28 10-13
Inferred at global scalea
Total number of cells in clouds 5.82 1021 1.55 1022 1.75 1022
Carbon biodegradation rate
(gC h-1)
1.58 109 6.65 109 5.73 109
Carbon biodegradation rate (tons of C yr-1)
1.38 107 5.83 107 5.03 107
Amount of CO2 released by microbial respiration
(tons yr-1)
5.06 107 2.14 108 1.84 107
a: Total mass of clouds = 1,94×10¹⁷ g (14)
Table S4. Estimates of the amount of CO2 released by microbial respiration in clouds. The cell
concentrations are listed in Table 1, and the degradation rates from Table 3 were converted into gC h-1 cell-1. The total mass of clouds follows the conclusions of Pruppacher and Jaenicke, (1995) (14).
40 References
1. Kruisz C, Berner A, & Brantner B (1993) A cloud water sampler for high wind speeds. Proceedings of the EUROTRAC Symposium 1992 SPB Academic Publishing
bv, eds Borrell PM, Borrell P, Cvitas T, & Seiler W, pp 523-525.
2. Brantner B, Fierlinger H, Puxbaum H, & Berner A (1994) Cloudwater chemistry in the subcooled droplet regime at Mount Sonnblick (3106 m a.s.l., Salzburg, Austria).
Water, Air, & Soil Pollution 74(3):363-384.
3. Marinoni A, Laj P, Sellegri K, & Mailhot G (2004) Cloud chemistry at the Puy de Dôme: variability and relationships with environmental factors. Atmos. Chem. Phys. 4(3):715-728.
4. Parazols M, et al. (2007) Speciation and role of iron in cloud droplets at the puy de Dôme station. J. Atmos. Chem. 57(3):299-300.
5. Stookey LL (1970) Ferrozine - A new spectrophotometric reagent for iron. Anal.
Chem. 42(7):779-781.
6. Jaffrezo JL, Calas N, & Bouchet M (1998) Carboxylic acids measurements with ionic chromatography. Atmos. Environ. 32(14-15):2705-2708.
7. Li Q, Sritharathikhun P, & Motomizu S (2007) Development of Novel Reagent for Hantzsch Reaction for the Determination of Formaldehyde by Spectrophotometry and Fluorometry. Anal. Sci. 23(4):413-417.
8. Lazrus AL, Kok GL, Gitlin SN, Lind JA, & McLaren SE (1985) Automated fluorimetric method for hydrogen peroxide in atmospheric precipitation. Anal. Chem. 57(4):917-922.
9. Amato P, et al. (2005) Microbial population in cloud water at the Puy de Dôme: Implications for the chemistry of clouds. Atmos. Environ. 39(22):4143-4153.
10. Koutny M, et al. (2006) Acquired biodegradability of polyethylenes containing pro-oxidant additives. Polym. Degrad. Stab. 91(7):1495-1503.
11. Lundin A, Hasenson M, Persson J, Pousette Å, & Marlene A. DeLuca WDM (1986) Estimation of biomass in growing cell lines by adenosine triphosphate assay. Methods
Enzymol., (Academic Press), Vol 133, pp 27-42.
12. Stanley PE & Williams SG (1969) Use of the liquid scintillation spectrometer for determining adenosine triphosphate by the luciferase enzyme. Anal. Biochem. 29(3):381-392.
13. Vaïtilingom M, et al. (2011) Atmospheric chemistry of carboxylic acids: microbial implication versus photochemistry. Atmos. Chem. Phys. 11(16):8721-8733.
14. Pruppacher HR & Jaenicke R (1995) The processing of water vapor and aerosols by atmospheric clouds, a global estimate. Atmos. Res. 38(1-4):283-295.
15. Eiler A, Langenheder S, Bertilsson S, & Tranvik LJ (2003) Heterotrophic Bacterial Growth Efficiency and Community Structure at Different Natural Organic Carbon Concentrations. Appl. Environ. Microbiol. 69(7):3701-3709.