The complementary roles of dynamic
contrast-enhanced MRI and [supersript 18]F-fluorodeoxyglucose
PET/CT for imaging of carotid atherosclerosis
The MIT Faculty has made this article openly available.
Please share
how this access benefits you. Your story matters.
Citation
Calcagno, Claudia et al. “The Complementary Roles of Dynamic
Contrast-Enhanced MRI and 18F-Fluorodeoxyglucose PET/CT for
Imaging of Carotid Atherosclerosis.” European Journal of Nuclear
Medicine and Molecular Imaging 40.12 (2013): 1884–1893.
As Published
http://dx.doi.org/10.1007/s00259-013-2518-4
Publisher
Springer Berlin Heidelberg
Version
Author's final manuscript
Citable link
http://hdl.handle.net/1721.1/109447
Terms of Use
Article is made available in accordance with the publisher's
policy and may be subject to US copyright law. Please refer to the
publisher's site for terms of use.
ORIGINAL ARTICLE
The complementary roles of dynamic contrast-enhanced MRI
and
18
F-fluorodeoxyglucose PET/CT for imaging
of carotid atherosclerosis
Claudia Calcagno&Sarayu Ramachandran&David Izquierdo-Garcia&Venkatesh Mani&
Antoine Millon&David Rosenbaum&Ahmed Tawakol&Mark Woodward&Jan Bucerius&
Erin Moshier&James Godbold&David Kallend&Michael E. Farkouh&Valentin Fuster&
James H. F. Rudd&Zahi A. Fayad
Received: 11 April 2013 / Accepted: 11 July 2013 / Published online: 14 August 2013 # Springer-Verlag Berlin Heidelberg 2013
Abstract
Purpose Inflammation and neovascularization in vulnerable atherosclerotic plaques are key features for severe clinical events. Dynamic contrast-enhanced (DCE) MRI and FDG PET are two noninvasive imaging techniques capable of
quantifying plaque neovascularization and inflammatory infil-trate, respectively. However, their mutual role in defining plaque vulnerability and their possible overlap has not been thoroughly investigated. We studied the relationship between DCE-MRI
and18F-FDG PET data from the carotid arteries of 40 subjects
Electronic supplementary material The online version of this article (doi:10.1007/s00259-013-2518-4) contains supplementary material, which is available to authorized users.
C. Calcagno
:
S. Ramachandran:
V. Mani:
A. Millon:
Z. A. Fayad (*)Translational and Molecular Imaging Institute, Mount Sinai School of Medicine, One Gustave L. Levy Place, Box 1234, New York, NY 10029, USA
e-mail: zahi.fayad@mssm.edu
C. Calcagno
:
S. Ramachandran:
V. Mani:
A. Millon:
Z. A. Fayad Department of Radiology, Mount Sinai School of Medicine, New York, NY, USAD. Izquierdo-Garcia
Athinoula A. Martinos Center for Biomedical Imaging, Harvard University - MIT - Massachusetts General Hospital, Charlestown, MA, USA
D. Rosenbaum
Hopital Pitié Salpétrière, Paris, France A. Tawakol
Harvard Medical School and Massachusetts General Hospital, Boston, MA, USA
M. Woodward
George Institute, University of Sydney, Sydney, Australia J. Bucerius
Department of Nuclear Medicine, Maastricht University Medical Center, Maastricht, The Netherlands
J. Bucerius
Cardiovascular Research Institute Maastricht (CARIM), Maastricht, The Netherlands
J. Bucerius
Department of Nuclear Medicine, Rheinisch-Westfaelische Technische Hochschule Aachen, Aachen, Germany E. Moshier
:
J. GodboldBiostatistics Shared Research Facility, Mount Sinai School of Medicine, New York, NY, USA
D. Kallend
F. Hoffmann-La Roche Ltd, Basel, Switzerland M. E. Farkouh
:
V. Fuster:
Z. A. FayadCardiovascular Institute, Mount Sinai School of Medicine, New York, NY, USA
M. E. Farkouh
Peter Munk Cardiac Centre and Li Ka Shing Knowledge Institute, Toronto, Canada
V. Fuster
The Centro Nacional de Investigaciones Cardiovasculares (CNIC), Madrid, Spain
J. H. F. Rudd
Division of Cardiovascular Medicine, University of Cambridge, Cambridge, UK
with coronary heart disease (CHD) or CHD risk equivalent, as a substudy of the dal-PLAQUE trial (NCT00655473).
Methods The dal-PLAQUE trial was a multicenter study that evaluated dalcetrapib, a cholesteryl ester transfer protein mod-ulator. Subjects underwent anatomical MRI, DCE-MRI and
18
F-FDG PET. Only baseline imaging and biomarker data (before randomization) from dal-PLAQUE were used as part of this substudy. Our primary goal was to evaluate the
rela-tionship between DCE-MRI and18F-FDG PET data. As
sec-ondary endpoints, we evaluated the relationship between (a) PET data and whole-vessel anatomical MRI data, and (b) DCE-MRI and matching anatomical MRI data. All correla-tions were estimated using a mixed linear model.
Results We found a significant inverse relationship between
several perfusion indices by DCE-MRI and18F-FDG uptake by
PET. Regarding our secondary endpoints, there was a significant relationship between plaque burden measured by anatomical MRI
with several perfusion indices by DCE-MRI and18F-FDG uptake
by PET. No relationship was found between plaque composition
by anatomical MRI and DCE-MRI or18F-FDG PET metrics.
Conclusion In this study we observed a significant, weak
in-verse relationship between inflammation measured as18F-FDG
uptake by PET and plaque perfusion by DCE-MRI. Our find-ings suggest that there may be a complex relationship between plaque inflammation and microvascularization during the
dif-ferent stages of plaque development.18F-FDG PET and
DCE-MRI may have complementary roles in future clinical practice in identifying subjects at high risk of cardiovascular events. Keywords DCE-MRI . PET/CT . Atherosclerosis . Inflammation . Neovascularization
Introduction
In recent years, significant progress has been made in defining the hallmarks of high-risk, vulnerable atherosclerotic plaques. Vulnerable atheromas are characterized by a large lipid-rich necrotic core (LRNC), thin fibrous cap and prominent inflam-matory infiltrate accompanied by abundant and fragile
neovessels [1]. This knowledge has stimulated the development
of novel, noninvasive imaging techniques to identify vulnerable plaques, with the aim of improving risk stratification, follow-up and management of therapeutic intervention by directly
preventing acute events [2]. Techniques such as
non-contrast-enhanced, anatomical MRI, CT and ultrasonography can quan-tify anatomical characteristics and detect key components of vulnerable plaques. Other techniques can extract quantitative information about molecular mechanisms within the plaque.
18
F-FDG PET with CT and dynamic contrast-enhanced (DCE)
MRI allow measurement of inflammation [3–5] and
neovascularization [6–9], respectively, two features of plaque
vulnerability. Both techniques show reasonable reproducibility
[5,10] and have been used to track antiatherosclerotic therapies
in both clinical and preclinical trials [11–16]. However, the
possible degree of overlap of the information provided by each test has not been thoroughly investigated. In this study, we
investigated the relationship between 18F-FDG PET/CT and
DCE-MRI data from the common carotid arteries of 40 subjects with either coronary heart disease (CHD) or CHD risk factors (CHD risk equivalent) recruited as part of the dal-PLAQUE
multicenter trial (NCT00655473) [14,15].
Methods Study design
This study was conducted as part of the dal-PLAQUE multi-center trial that evaluated dalcetrapib, a cholesteryl ester
trans-fer protein modulator [14,15]. The protocol was reviewed and
approved by the institutional review board of each participat-ing center. Each participatparticipat-ing center was trained in the image acquisition protocol by the core laboratory for image analysis of the dal-PLAQUE trial (Icahn School of Medicine at Mount Sinai, New York, NY). All participants provided written in-formed consent. Here we report only baseline (prior to
ran-domization) anatomical MRI, DCE-MRI,18F-FDG PET/CT
and biomarker data from the dal-PLAQUE study. Study population
The study population of dal-PLAQUE comprised patients with CHD or CHD risk equivalent. Patients were clinically stable and receiving appropriate treatment with a statin and/or other drugs for lowering low-density lipoprotein cholesterol (LDL-C) to achieve LDL-C levels of <100 mg/dL (<2.6 mmol/L), unless receiving maximum tolerated doses of therapy or intol-erant to statins. From the 189 subjects screened in the dal-PLAQUE trial, 40 were included in this study.
Image acquisition
PET/CT All PET scanners were fully calibrated and corrections applied for attenuation, isotope decay, dead time, normalization, sensitivity, scatter and random coincidences. Patients were instructed to avoid meals rich in carbohydrates starting from
12 h before18F-FDG injection. Additionally subjects were asked
to abstain from heavy physical activity for 24 h before imaging to
reduce muscle uptake of18F-FDG. Approximately 30 min before
18
F-FDG injection, glucose was measured: if fasting blood glu-cose was higher than 200 mg/dL, imaging was rescheduled,
otherwise patients were injected with 15 mCi (555 MBq)18
F-FDG, bought commercially from local vendors. After 120 min of
FDG circulation time [3–5], a low-dose, non-contrast-enhanced
coregistration. After aortic imaging for the purpose of the trials, carotid PET data were acquired in 3-D mode for 15 min using one bed position with the superior aspect of the field of view being the internal auditory meatus.
Anatomical MRI Carotid MRI was performed on 1.5-T clin-ical whole-body systems (Siemens Medclin-ical Solutions, Erlang-en, Germany) in the head-first supine position using a four-channel carotid array (Machnet, Netherlands) for signal recep-tion. Sixteen non-overlapping cross-sectional T1-weighted (echo time, TE, 9 ms; repetition time, TR, 800 ms), T2-weighted (TE 56 ms; TR 2,000 ms) and proton density-weighted (PD-density-weighted; TE 9 ms, TR 2,000 ms) images were obtained using multislice, fat-saturated 2-D turbo spin echo (TSE) acquisitions starting at, and extending below, the left
carotid bifurcation as previously described [14, 15]. Dark
blood was obtained using in-flow and out-flow saturation. Other relevant imaging parameters common to all three ac-quisitions were: field of view 140×140 mm, matrix size 256× 256, in-plane spatial resolution 0.55×0.55 mm, slice thickness 3 mm, interslice gap 0.3 mm, excitation flip angle 90°, refocusing angle 180°, turbo factor 15, four signal averages. DCE-MRI DCE-MRI was performed on one selected axial slice (chosen from the T1-weighted image set, as the slice with
the greatest degree of carotid wall thickening) using a black-blood, fat-saturated TSE sequence after injection of 0.2 mmol/ kg gadolinium-diethylene triamine pentaacetic acid
(Gd-DTPA, Magnevist; Bayer Schering Pharma) [6]. Black blood
was obtained using a double inversion recovery technique. Relevant imaging parameters were: TE 5.6 ms, TR 250 ms, field of view 140×140 mm, matrix size 256×256, in-plane spatial resolution 0.55×0.55 mm, slice thickness 3 mm, exci-tation flip angle 90°, refocusing angle 180°, turbo factor 15, one signal average, 100 measurements.
More details on the PET and MRI acquisition parameters
are provided by Fayad et al. [14,15]. For the purpose of this
comparison, only data from 4 of the 11 imaging sites passed our imaging quality control to ensure uniformity between MRI protocols, vendors and field strength.
Image analysis
A schematic representation of the image analysis is shown in
Fig.1.
Measurement of18F-FDG uptake PET/CT images were
ana-lyzed using OsiriX (Geneva, Switzerland;
http://www.osirix-viewer.com/) and in-house software for data handling. Arterial
Fig. 1 Schematic view of image analysis in common carotid arteries. Dashed lines represent acquired PET/CT and MRI axial slices. Data from all the slices were used for the whole-vessel analyses (red dashed line DCE-MRI slice, orange dashed lines PET slices surrounding the slice matched with DCE-MRI included in the analysis to take into account possible misregistrations between the two techniques)
18
F-FDG uptake was measured by drawing circular regions of interest (ROI) on all PET/CT slices of both common carotid arteries. ROIs were fitted to the artery wall on each axial slice, while coronal and sagittal views were used to ensure that uptake was from the artery. Whole-vessel mean, maximum and mean of maximum standardized uptake values (SUV) were recorded. Arterial SUV was normalized to the blood pool SUV measured from five slices in the jugular vein to calculate the whole-vessel mean, maximum and mean of
maximum arterial target-to-background ratio (TBR) [5].
SUV and TBR are both well-validated measures of18F-FDG
uptake. To account for possible misregistration errors between DCE-MRI and PET/CT data, we recorded mean, maximum and mean of maximum SUV and TBR across five slices
centered on the slice matching the DCE slice (Fig.1,
approx-imately 1-cm segment).
Anatomical MRI Inner and outer vessel wall contours were manually traced by an experienced observer on all slices for both common carotid arteries using Tweighted multislice 2-D TSE images. Mean lumen diameter, vessel diameter, lumen area, wall area, total vessel area, mean wall thickness, standard deviation of wall thickness and normalized wall index for each slice were calculated using a customized software program (Vessel Mass Software; Leiden University Medical Center,
The Netherlands) as previously described [17], and interfaced
with in-house custom software for data analysis. Whole-vessel parameters were recorded, as well as single slice values matched with DCE-MRI acquisition. Plaque components were classified by an experienced observer by looking simultaneous-ly at the T1-, T2- and PD-weighted multislice 2-D TSE acqui-sitions to assess the presence or absence of LRNC, calcification
and intraplaque hemorrhage, as described by Fayad et al. [14,
15]. Plaques were characterized across the whole vessel as well
as on the slice matching with the DCE-MRI acquisition. DCE-MRI The uptake of contrast agent was evaluated with a custom-made MATLAB (The MathWorks Inc., Natick, MA)
program [6]. To ensure proper calibration between different
imaging sessions, curves were converted to contrast agent concentrations using the spoiled gradient echo signal model
[18] and the widely accepted linear relationship between
relaxation rates and concentration. Contrast agent relaxivity
was assumed to be 4.3 mmol−1s−1[19]. Kinetic modeling was
performed using a population arterial input function (AIF)
[20] and the model of Tofts et al. with modification [21].
Kinetic parameters vp (fraction of vascular space), Ktrans
(wash-in constant from plasma to tissue compartment), ve
(fraction of extravascular extracellular space), and Kep
(wash-out constant from tissue to plasma compartment) were
calculated using standard nonlinear least squares fittings [22]
in MATLAB. The non-model based parameter area under the
concentration curve (AUC) [6,10–12] was also calculated at
1 min (AUC1) and 2 min (AUC2) after injection of contrast
agent [6] (Fig.1).
Image coregistration between 18F-FDG PET/CT and
DCE-MRI Anatomical coregistration between the DCE-DCE-MRI slice and the corresponding PET/CT slice was performed using automated registration of the CT- and PD-weighted high-resolution MR images using a Leonardo workstation (Siemens Medical Solutions, Erlangen, Germany). When nec-essary, manual adjustments were applied to correct for mis-alignments in the automated registration.
Statistical methods
The main goal of our analysis was to correlate perfusion metrics by DCE-MRI with plaque inflammation as measured
by 18F-FDG PET/CT. We also assessed the correlation
be-tween: (a) whole-vessel PET/CT and whole-vessel anatomical MRI variables and (b) single-slice perfusion measures by DCE-MRI with matching single-slice anatomical MRI vari-ables. Correlations were calculated using a mixed linear model
with a compound symmetric correlation structure [23],
implemented with PROC MIXED in SAS v. 9.2. All data were natural log-transformed to achieve normality. This mod-el accounted for the corrmod-elation between measurements of the same variable within each of the 40 patients in the study. The 95 % confidence interval for each correlation coefficient was
constructed using the bootstrap method [24], in which 1,000
bootstrap samples of size n =40 were generated. Each sample consisted of 40 subjects being sampled with replacement from the complete list of 40 subjects; for each bootstrap sample, PROC MIXED calculated a correlation coefficient from the mixed model. The distribution of these 1,000 correlation coefficients provided estimates of the 2.5th and the 97.5th percentiles as the upper and lower confidence limits for the initial point estimate. When the 95 % confidence interval did not include zero (both limits had the same sign, positive or negative) the correlation was considered significantly differ-ent from zero at the 5 % level of significance. To adjust for the multiple statistical tests performed, Bonferroni correction was also applied to the comparisons presented in each table in the
Resultssection. The p value of 0.05 used to establish signif-icance was divided by the number of comparisons considered
in each table (36 for Tables2and5; 24 for Table4). Therefore,
p <0.001 was required for the comparisons in Tables2and5,
and p <0.02 was required for the comparisons in Table4to
reach statistical significance. The results are presented with and without Bonferroni correction. If correlation coefficients were less than 0.3, the correlation was considered weak; if higher or equal to 0.3 but lower than 0.7, the correlation was considered moderate; if higher or equal to 0.7, the correlation was considered strong.
Results
Patient population
The mean age of the population was 64.2 years, and most were men (78.8 %). Baseline lipid biomarkers revealed aver-age total cholesterol of 146.8 mg/dL, with averaver-age LDL-C being 74.8 mg/dL and high-density lipoprotein cholesterol (HDL-C) being 45.8 mg/dL. Baseline demographics are
presented in Table1.
Relationship between18F-FDG PET/CT and DCE-MRI data
The relationship between DCE-MRI and PET variables was
analyzed using a mixed linear model (Table2). Comparing
arterial FDG uptake by PET/CT and DCE-MRI measurements without Bonferroni correction, the non-model-based parame-ter AUC1 showed a weak significant inverse correlation with
mean SUV, with a correlation coefficient−0.23. The
parame-ter AUC2 exhibited a weak significant inverse correlation
with maximum SUV (correlation coefficient −0.21). The
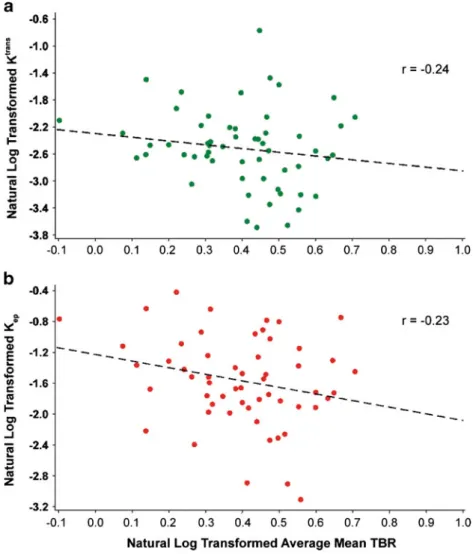
model-based parameter Ktrans, believed to represent a mixture
of flow and permeability, exhibited weak significant inverse correlations with maximum SUV (correlation coefficient
−0.22), mean TBR (correlation coefficient −0.24; Fig. 2a)
and mean of maximum TBR (correlation coefficient−0.22).
The model-based parameter vp, expressing the fractional
plas-ma volume, showed moderate inverse significant correlations
with mean SUV (correlation coefficient−0.41) and mean of
maximum SUV (correlation coefficient−0.32). The
model-based parameter Kep (backflow constant from tissue to
plasma) showed weak inverse significant correlations with
mean SUV and TBR (correlation coefficients −0.28 and
−0.23; Fig.2b) and mean of maximum SUV and TBR
(corre-lation coefficients−0.24 and −0.20). The model-based
param-eter vedid not show any significant correlations with SUV or
TBR values. No significant correlations were found when
using Bonferroni correction. Figure3shows PET/CT images
and DCE-MRI uptake curves from two patients representative of our sample. The PET/CT images and Gd-DTPA uptake data
are from a patient with low18F-FDG uptake by PET/CT but
high Gd-DTPA uptake by DCE-MRI (Fig.3a–c), and a patient
with high18F-FDG and low Gd-DTPA uptake (Fig.3d–f).
Correlation between anatomical MRI and PET/CT data
Table3shows the results of analysis of whole-vessel
anatom-ical MRI data. The dataset was composed mainly of non-complex carotid atherosclerotic plaques, with calcification be-ing identified in only 15.1 % and LRNC in 36.4 % of the lesions. Intraplaque hemorrhage was absent from the entire cohort of subjects in this substudy. Among the slices chosen for DCE-MRI, 6.1 % showed calcification and 18.2 % re-vealed LRNC. Mean wall thickness averaged across the whole vessel calculated from anatomical MRI data showed a moder-ate but significant positive correlation with the average
whole-vessel TBR, with a correlation coefficient 0.39 (Table4)
with-out Bonferroni correction. No significant correlations were found between any of the PET variables and plaque composi-tion by MRI (data not shown). No significant correlacomposi-tions were found when using Bonferroni correction.
Correlation between anatomical MRI and DCE-MRI data Analysis of high-resolution anatomical MRI data revealed that average and standard deviation of wall thickness weakly
positively correlated with the DCE-MRI parameter Kep
(cor-relation coefficients 0.21 and 0.25, respectively) when not using Bonferroni correction. No significant correlations were found between DCE-MRI metrics and plaque composition by MRI (data not shown). No significant correlations were found when using Bonferroni correction.
Discussion
The main goal of this study was to investigate the relationship
between 18F-FDG PET/CT and DCE-MRI data from the
carotid arteries of 40 patients with CHD or CHD risk
equiv-alent recruited as part of the dal-PLAQUE study [14, 15].
These techniques offer a quantitative read-out for plaque
macrophages [4] and neovessels, respectively [6,7], two of
the hallmarks of plaque vulnerability. We found a significant weak inverse relationship between the results from the two
Table 1 Baseline patient characteristics (n =33)
Characteristic Value
Age (years), mean (SD) 64 (8.0)
Male sex, n (%) 26 (78.8)
Body mass index (kg/m2), mean (SD) 29 (5.1)
Medical history, n (%)
Type II diabetes 10 (30.3)
Hypertension 20 (60.6)
CHD 28 (84.8)
Abdominal aortic aneurysm 1 (3.0)
Symptomatic carotid disease 3 (9.1)
Peripheral arterial disease 2 (6.1)
Smoking 4 (12.1) Lipids (mg/dL), mean (SD) Total cholesterol 146.8 (29.0) LDL-C 74.8 (19.8) HDL-C 45.8 (14.7) Triglycerides 130.7 (64.1)
techniques. As secondary endpoints, we explored the relationships between non-contrast-enhanced anatomical MRI data and data from both DCE-MRI and FDG PET/CT. The anatomical MRI data showed a significant weak positive correlation with the DCE-MRI data and a significant weak inverse correlation with the PET/CT data.
Previous studies have investigated the relationship between
anatomical MRI and18F-FDG PET/CT data and found higher
FDG uptake in complex lesions, but no or only a weak correlation with plaque wall thickness. Silvera et al. found higher FDG uptake in lipid-based compared to collagen-rich
or calcified plaques using TBR [25]. Additionally (only in the
LRNC group), they found a significant variation in TBR according to the median of the vessel wall thickness. On the
contrary, Kwee et al. [26] found higher FDG uptake measured
as SUV in fibrous, but not lipid-rich, plaques. Additionally, they found a correlation between SUV and vessel wall vol-ume. In this study, we confirmed a significant relationship between average whole vessel TBR by PET/CT and average wall thickness by anatomical MRI, but fail to demonstrate a correlation between FDG uptake and plaque composition
(Table 4). This difference from the two studies mentioned
above may be due to the patient population and nature of the lesions (more complex in other studies, versus non-complex in the present study). Additionally, we demonstrates weak but significant correlations between anatomical MRI measures such as average wall area and average and standard deviation
of wall thickness and the DCE-MRI metric Kep, while no
correlation was found with plaque composition (Table5).
Recently, Cyran et al. [27] studied the relationship between
18
F-FDG PET/CT and DCE-MRI results in patients with supraaortic arteritis, and found a positive significant correla-tion between mean arterial TBR and extraccorrela-tion fraccorrela-tion of
MRI contrast agent. Taqueti et al. [28] also found a positive
significant correlation between FDG uptake measured as TBR
and Ktransby DCE-MRI and neovessels by histology in
pa-tients with severe carotid stenosis. In this study we found a weak but significant inverse correlation between model-based and non-model-based DCE-MRI metrics and SUV and TBR by PET/CT. There may be several reasons for this difference in findings. Firstly, it must be noted that the patient popula-tions in the two studies were very different: while Taqueti et al.
Fig. 2 Correlation between DCE-MRI parameters and mean TBR by PET/CT in the carotid arteries of subjects with CHD or CHD risk equivalent. a Correlation between Ktransby DCE-MRI and mean TBR by PET/CT. b Correlation between Kepby DCE-MRI and mean TBR
by PET/CT. Black dotted line regression line
[28] studied subjects presenting with a high degree of carotid stenosis, in this study we investigated subjects with
non-complex atherosclerotic lesions (Table3). Differences in
med-ication usage between the population investigated in this study and other studies may also act as a confounding factor. Addi-tionally, while it is known that PET/CT and DCE-MRI pro-vide an indication of the extent of plaque macrophages and neovessels, their metrics may not exclusively reflect these histological features. For example, contrast agent extravasa-tion in DCE-MRI depends not only on neovessel density and permeability, but also on the fractional extravascular
extracel-lular space available for contrast agent distribution [21].
Alternatively, it is possible that plaque macrophage content
and neovascularization (and therefore 18F-FDG uptake on
PET and Gd-DTPA uptake on DCE-MRI) may exhibit differ-ent relationships with each other depending on the stage of the plaque that is being imaged.
Another potential explanation for our findings resides in the interplay between neovascularization, hypoxia and
inflam-mation [29]. It is relatively well established that hypoxia and
Fig. 3 18F-FDG PET/CT images and Gd-DTPA uptake data by DCE-MRI from representative patients showing the relationship between Gd-DPTA uptake and18F-FDG uptake. a–c Patient with low arterial FDG uptake by PET/CT but high Gd-DTPA uptake by DCE-MRI. d–f Patient with high arterial FDG uptake by PET/CT but low Gd-DTPA uptake by
DCE-MRI. a, d FDG PET image overlain on CT image (blue circles common carotid artery, red circles jugular vein). b, e T1-W MRI image after contrast agent administration. c, f Kinetic modeling of Gd-DTPA uptake by DCE-MRI (blue dots experimental data, red line model fit). SM skeletal muscle, L vessel lumen
Table 2 Correlation between DCE-MRI and slice-matched18F-FDG PET/CT parameters (n =40)
PET/CT parameters DCE-MRI parameters
AUC1 AUC2 Ktrans ve Kep vp
SUV_Mean −0.23 −0.22 −0.25 0.02 −0.28 −0.41 SUV_Max −0.18 −0.21 −0.22 −0.04 −0.20 −0.25 SUV_MeanofMax −0.20 −0.20 −0.22 0.02 −0.24 −0.32 TBR_Mean −0.23 −0.20 −0.24 −0.02 −0.23 −0.30 TBR_Max −0.10 −0.11 −0.15 −0.14 −0.04 −0.29 TBR_MeanofMax −0.20 −0.19 −0.22 −0.04 −0.20 −0.29
Bold type indicates a significant correlation without Bonferroni correc-tion (P <0.05)
Table 3 Non-contrast-enhanced MRI analysis Measure (mean and standard deviation) Whole vessel
(n =33)
DCE-MRI slice (n =40) Average total vessel area (cm2), mean
(SD)
0.61 (0.20) 0.60 (0.13) Average wall area (cm2), mean (SD) 0.28 (0.11) 0.24 (0.06) Average lumen area (cm2), mean (SD) 0.32 (0.11) 0.36 (0.08) Average mean wall thickness (mm),
mean (SD)
1.15 (0.24) 0.97 (0.20) Average standard deviation of wall
thickness (mm), mean (SD)
0.27 (0.19) 0.20 (0.11) Average normalized wall indexa, mean
(SD)
0.46 (0.07) 0.40 (0.06)
Calcification, n (%) 5 (15.1) 2 (6.1)
Hemorrhage, n (%) 0 (0) 0 (0)
Lipid rich necrotic core, n (%) 12 (36.4) 6 (18.2)
a
Wall area/total vessel area based on the average of the right and left carotid arteries
inflammation are intertwined at the molecular, cellular and
clinical levels [30]. Hypoxic conditions are known to develop
in atherosclerotic plaques as a result of smooth muscle cell proliferation in the tunica intima, subsequent wall thickening, and increased oxygen consumption by macrophages and foam
cells [31–33]. Hypoxia induces increased glycolysis [34,35]
in macrophages (hence increased FDG uptake). In addition to increasing macrophage glycolysis, hypoxia is known to
in-crease macrophage activation, phagocytosis [36] and tumor
necrosis factor production [37]. This hypothesis offers a
pos-sible explanation for our findings, where higher FDG uptake was inversely correlated with plaque neovascularization shown by DCE-MRI. It is therefore possible to envision a scenario where the hypoxia-driven inflammatory response may precede an increase in plaque neovascularization by
neoangiogenesis [38]. This hypothesis has been corroborated
by more recent in vivo findings by Pedersen et al. [39], which
show the relationship between SUV and expression of genes of plaque vulnerability and neoangiogenesis in human carotid specimens. Pedersen et al. found a significant but negative
correlation between CD34, a histological marker of
microvessel density, and both SUV by 18F-FDG-PET and
CD68, a histological marker of macrophages. No correlation was found between SUV and markers of neoangiogenesis (vascular endothelial growth factor). The authors concluded
that 18F-FDG uptake inversely reflects microvessel density,
but not neoangiogenesis in human atherosclerotic plaques. Since DCE-MRI metrics are known to reflect plaque neovessel content, this may explain the higher substantial
18
F-FDG uptake in areas of low uptake of Gd-DTPA on DCE-MRI and vice versa.
Together with other studies, our findings suggest that18
F-FDG PET and DCE-MRI may offer complementary, non-overlapping information about vascular inflammation and neoangiogenesis. This suggests that these two techniques may be used in combination in future clinical practice for accurate staging and risk stratification of atherosclerotic plaques. How-ever, a more thorough investigation of these two modalities and their underlying histological correlates at the different stages of plaque progression is needed before their clinical use. Study limitations
Possible limitations of the study are as follows. Firstly, the sample size was relatively small (40 subjects) and comparison of the imaging findings with a histological gold standard was not possible. Due to the small sample size, subgroup analyses of symptomatic versus asymptomatic subjects were also not possible. Secondly, DCE-MRI achieved limited single-slice coverage to maintain sufficiently fast temporal resolution (4.8 s) together with a high spatial resolution (0.5×0.5 mm) for the reliable estimation of contrast agent uptake and good characterization of plaque composition. This required careful matching of DCE-MRI slices with the corresponding anatom-ical MRI and PET/CT images, which may be affected by misregistration. The development of novel technologies such as integrated PET/MRI scanners will, in the future, allow these studies to be performed simultaneously, naturally providing coregistered PET and MRI images, and therefore eliminating
this issue [40]. PET imaging has quite poor spatial resolution
for imaging small structures, such as atherosclerotic vessel walls. However, this modality has been used successfully in combination with CT, which provides anatomical details and attenuation correction, to quantify inflammation in
atheroscle-rotic plaques [4]. PET/MRI may allow the application of
partial volume correction techniques to help image small
struc-tures, such as the vasculature, with increased accuracy [41].
A black-blood sequence was chosen for DCE-MRI acqui-sition to allow better delineation of these non-complex ath-erosclerotic lesions from the vessel lumen during dynamic scanning. Despite allowing clear visualization of the arterial vessel wall by suppressing the blood signal, black-blood imaging does not allow sampling a per-patient AIF for kinetic
Table 4 Correlation between anatomical MRI and whole-vessel PET/CT data Average SUV Maximum SUV Average TBR Maximum TBR Average total vessel area
(cm2)
0.04 0.00 0.12 0.08
Average wall area (cm2) 0.05 0.00 0.29 0.23
Average lumen area (cm2) 0.03 0.01 −0.09 −0.10
Average mean wall thickness (mm)
0.05 0.01 0.39 0.33
Average standard deviation of wall thickness (mm)
0.01 −0.03 0.30 0.24
Average normalized wall index
0.04 0.01 0.33 0.29
Bold type indicates a significant correlation without Bonferroni correc-tion (P <0.05)
Table 5 Correlation between anatomical MRI and DCE-MRI data AUC1 AUC2 Ktrans v
e Kep vp
Average total vessel area (cm2)
0.10 0.11 0.09 0.06 0.06 0.12
Average wall area (cm2) 0.14 0.17 0.15 0.00 0.16 0.09 Average lumen area
(cm2)
0.08 0.07 0.04 0.09 −0.02 0.10
Average mean wall thickness (mm) 0.11 0.14 0.16 −0.05 0.21 0.07 Average standard deviation of wall thickness (mm) 0.08 0.08 0.07 −0.21 0.25 −0.16
Average normalized wall index
0.07 0.10 0.15 −0.11 0.24 0.00
Bold type indicates a significant correlation without Bonferroni correc-tion (P <0.05)
modeling. A population-derived AIF [20] was used for anal-ysis, which may have introduced inaccuracies into the calcu-lation of model-based parameters. Finally, no significant cor-relations were found when using Bonferroni correction. While Bonferroni correction is applied when multiple statistical tests are performed to avoid type 1 errors (false positives), it is a rather conservative approach which does increase the chance of type 2 errors (false negatives). While some of the correla-tions reported without Bonferroni correction are likely to have been false positives, in this case the correction demands p <
0.001 (Tables 2 and 5) and p < 0.002 (Table 4) to reach
significance. As this may conceivably have led to some false negatives, both corrected and uncorrected results are reported. Conclusion
In conclusion, in this study we found a significant inverse relationship between non-model and model-based perfusion indices by DCE-MRI (indices of neovascularization) and SUV and TBR by PET/CT (markers of macrophage content). This finding, in combination with other findings in the litera-ture, suggests that there may be a complex relationship be-tween plaque inflammation and neovascularization, and that
18
F-FDG PET and DCE-MRI images have complex histolog-ical correlates, whose relationship may change during plaque progression. The combination of PET/CT and DCE-MRI imaging may prove to be a useful tool in drug development for proof of concept of new therapies.
Acknowledgments F. Hoffmann-La Roche Ltd funded the dal-PLAQUE study and provided third-party editorial support, through Prime Healthcare Ltd, for the preparation of the manuscript. C.C. acknowledges grant and research support from the National Institutes of Health and National Heart Lung and Blood Institute (NIH/NHLBI R01 HL071021, NIH/NHLBI R01 HL078667 and NIH/NCRR UL1RR029887). Conflicts of interest S.R., D.I.-G., A.M., D.R., J.B., E.M., J.G. and V.F. indicate that they have nothing to disclose. VM discloses that he receives consulting fees from Tursiop Inc. A.T. discloses that he has received honoraria from Roche, BMS and Novartis, and research grants from Merck, BMS, Genentech, GSK and VBL. M.W. discloses that he has received honoraria from Roche. D.K. is an employee of F. Hoffmann-La Roche Ltd. M.E.F. discloses that he has received honoraria from Roche and acted as a consultant to Genentech. J.H.F.R. discloses that he has received honoraria from Roche and is part-supported by the National Institute for Health Research Cambridge Biomedical Research Centre. Z.A.F. discloses that he has received research grants from Roche, GlaxoSmithKline, Merck, VBL Therapeutics, Novartis, Bristol-Myers Squibb, and Via Pharmaceuticals, and honoraria from Roche.
References
1. Virmani R, Burke AP, Farb A, Kolodgie FD. Pathology of the vulnerable plaque. J Am Coll Cardiol. 2006;47 Suppl:C13–8. 2. Fuster V, Fayad ZA, Moreno PR, Poon M, Corti R, Badimon JJ.
Atherothrombosis and high-risk plaque: Part II: approaches by
noninvasive computed tomographic/magnetic resonance imaging. J Am Coll Cardiol. 2005;46:1209–18.
3. Rudd JH, Warburton EA, Fryer TD, Jones HA, Clark JC, Antoun N, et al. Imaging atherosclerotic plaque inflammation with [18F]-fluorodeoxyglucose positron emission tomography. Circulation. 2002;105:2708–11.
4. Tawakol A, Migrino RQ, Bashian GG, Bedri S, Vermylen D, Cury RC, et al. In vivo 18F-fluorodeoxyglucose positron emission tomog-raphy imaging provides a noninvasive measure of carotid plaque inflammation in patients. J Am Coll Cardiol. 2006;48:1818–24. 5. Rudd JH, Myers KS, Bansilal S, Machac J, Rafique A, Farkouh M, et al.
[18]Fluorodeoxyglucose positron emission tomography imaging of ath-erosclerotic plaque inflammation is highly reproducible: implications for atherosclerosis therapy trials. J Am Coll Cardiol. 2007;50:892–6. 6. Calcagno C, Cornily JC, Hyafil F, Rudd JH, Briley-Saebo KC, Mani
V, et al. Detection of neovessels in atherosclerotic plaques of rabbits using dynamic contrast enhanced MRI and 18F-FDG PET. Arterioscler Thromb Vasc Biol. 2008;28:1311–7.
7. Kerwin W, Hooker A, Spilker M, Vicini P, Ferguson M, Hatsukami T, et al. Quantitative magnetic resonance imaging analysis of neovasculature volume in carotid atherosclerotic plaque. Circulation. 2003;107:851–6.
8. Kerwin WS, O'Brien KD, Ferguson MS, Polissar N, Hatsukami TS, Yuan C. Inflammation in carotid atherosclerotic plaque: a dynamic contrast-enhanced MR imaging study. Radiology. 2006;241:459–68. 9. Kerwin WS, Oikawa M, Yuan C, Jarvik GP, Hatsukami TS. MR imaging of adventitial vasa vasorum in carotid atherosclerosis. Magn Reson Med. 2008;59:507–14.
10. Calcagno C, Vucic E, Mani V, Goldschlager G, Fayad ZA. Repro-ducibility of black blood dynamic contrast-enhanced magnetic reso-nance imaging in aortic plaques of atherosclerotic rabbits. J Magn Reson Imaging. 2010;32:191–8.
11. Lobatto ME, Fayad ZA, Silvera S, Vucic E, Calcagno C, Mani V, et al. Multimodal clinical imaging to longitudinally assess a nanomedical anti-inflammatory treatment in experimental atheroscle-rosis. Mol Pharm. 2010;7:2020–9.
12. Vucic E, Dickson SD, Calcagno C, Rudd JH, Moshier E, Hayashi K, et al. Pioglitazone modulates vascular inflammation in atherosclerotic rabbits noninvasive assessment with FDG-PET-CT and dynamic contrast-enhanced MR imaging. JACC Cardiovasc Imaging. 2011;4:1100–9.
13. Vucic E, Calcagno C, Dickson SD, Rudd JH, Hayashi K, Bucerius J, et al. Regression of inflammation in atherosclerosis by the LXR agonist R211945: a noninvasive assessment and comparison with atorvastatin. JACC Cardiovasc Imaging. 2012;5:819–28.
14. Fayad ZA, Mani V, Woodward M, Kallend D, Bansilal S, Pozza J, et al. Rationale and design of dal-PLAQUE: a study assessing effi-cacy and safety of dalcetrapib on progression or regression of ath-erosclerosis using magnetic resonance imaging and 18F-fluorodeoxyglucose positron emission tomography/computed to-mography. Am Heart J. 2011;162:214–221.e2.
15. Fayad ZA, Mani V, Woodward M, Kallend D, Abt M, Burgess T, et al. Safety and efficacy of dalcetrapib on atherosclerotic disease using novel non-invasive multimodality imaging (dal-PLAQUE): a randomised clinical trial. Lancet. 2011;378:1547–59.
16. Fayad ZA, Mani V, Fuster V. The time has come for clinical cardio-vascular trials with plaque characterization as an endpoint. Eur Heart J. 2012;33:160–1.
17. Mani V, Muntner P, Gidding SS, Aguiar SH, El Aidi H, Weinshelbaum KB, et al. Cardiovascular magnetic resonance param-eters of atherosclerotic plaque burden improve discrimination of prior major adverse cardiovascular events. J Cardiovasc Magn Reson. 2009;11:10.
18. Haacke EM, Brown RW, Thompson MR, Venkatesan R. Magnetic resonance imaging: physical principles and sequence design. New York: Wiley; 1999.
19. Sasaki M, Shibata E, Kanbara Y, Ehara S. Enhancement effects and relaxivities of gadolinium-DTPA at 1.5 versus 3 Tesla: a phantom study. Magn Reson Med Sci. 2005;4:145–9.
20. Parker GJ, Roberts C, Macdonald A, Buonaccorsi GA, Cheung S, Buckley DL, et al. Experimentally-derived functional form for a population-averaged high-temporal-resolution arterial input function for dynamic contrast-enhanced MRI. Magn Reson Med. 2006;56:993–1000. 21. Tofts PS, Brix G, Buckley DL, Evelhoch JL, Henderson E, Knopp MV, et al. Estimating kinetic parameters from dynamic contrast-enhanced T(1)-weighted MRI of a diffusable tracer: standardized quantities and symbols. J Magn Reson Imaging. 1999;10:223–32. 22. Murase K. Efficient method for calculating kinetic parameters using
T1-weighted dynamic contrast-enhanced magnetic resonance imag-ing. Magn Reson Med. 2004;51:858–62.
23. Hamlett A, Ryan L, Wolfinger R. On the use of PROC MIXED to estimate correlation in the presence of repeated measures. Proceed-ings of the Twenty-Ninth Annual SAS Users Group International Conference. Cary, NC: SAS Institute Inc.; 2004. paper 198-29. 24. Efron B, Tibshirani RJ. An introduction to the bootstrap. New York:
Chapman & Hall; 1993.
25. Silvera SS, Aidi HE, Rudd JH, Mani V, Yang L, Farkouh M, et al. Multimodality imaging of atherosclerotic plaque activity and com-position using FDG-PET/CT and MRI in carotid and femoral arteries. Atherosclerosis. 2009;207:139–43.
26. Kwee RM, Teule GJ, van Oostenbrugge RJ, Mess WH, Prins MH, van der Geest RJ, et al. Multimodality imaging of carotid artery plaques: 18F-fluoro-2-deoxyglucose positron emission tomography, computed tomography, and magnetic resonance imaging. Stroke. 2009;40:3718–24.
27. Cyran CC, Sourbron S, Bochmann K, Habs M, Pfefferkorn T, Rominger A, et al. Quantification of supra-aortic arterial wall inflam-mation in patients with arteritis using high resolution dynamic contrast-enhanced magnetic resonance imaging: initial results in correlation to [18F]-FDG PET/CT. Invest Radiol. 2011;46:594–9. 28. Taqueti V, Carli MD, Jerosch-Herold M, Sukhova G, Murthy V,
Folco E, et al. Increased microvascular blood flow and permeability associates with FDG signal in human atheroma. J Am Coll Cardiol. 2012;59(13):E1309.
29. Minchenko A, Leshchinsky I, Opentanova I, Sang N, Srinivas V, Armstead V, et al. Hypoxia-inducible factor-1-mediated expression of the 6-phosphofructo-2-kinase/fructose-2,6-bisphosphatase-3
(PFKFB3) gene. Its possible role in the Warburg effect. J Biol Chem. 2002;277:6183–7.
30. Eltzschig HK, Carmeliet P. Hypoxia and inflammation. N Engl J Med. 2011;364:656–65.
31. Moreno PR, Purushothaman KR, Fuster V, Echeverri D, Truszczynska H, Sharma SK, et al. Plaque neovascularization is increased in ruptured atherosclerotic lesions of human aorta: impli-cations for plaque vulnerability. Circulation. 2004;110:2032–8. 32. Fuster V, Moreno PR, Fayad ZA, Corti R, Badimon JJ.
Atherothrombosis and high-risk plaque: part I: evolving concepts. J Am Coll Cardiol. 2005;46:937–54.
33. Ribatti D, Levi-Schaffer F, Kovanen PT. Inflammatory angiogenesis in atherogenesis– a double-edged sword. Ann Med. 2008;40:606– 21.
34. Folco EJ, Sheikine Y, Rocha VZ, Christen T, Shvartz E, Sukhova GK, et al. Hypoxia but not inflammation augments glucose uptake in human macrophages: implications for imaging atherosclerosis with 18fluorine-labeled 2-deoxy-D-glucose positron emission tomogra-phy. J Am Coll Cardiol. 2011;58:603–14.
35. Kawaguchi T, Veech RL, Uyeda K. Regulation of energy metabolism in macrophages during hypoxia. Roles of fructose 2,6-bisphosphate and ribose 1,5-bisphosphate. J Biol Chem. 2001;276:28554–61. 36. Anand RJ, Gribar SC, Li J, Kohler JW, Branca MF, Dubowski T,
et al. Hypoxia causes an increase in phagocytosis by macrophages in a HIF-1alpha-dependent manner. J Leukoc Biol. 2007;82:1257–65. 37. Leeper-Woodford SK, Detmer K. Acute hypoxia increases alveolar
macrophage tumor necrosis factor activity and alters NF-kappaB expression. Am J Physiol. 1999;276:L909–16.
38. Moulton KS. Angiogenesis in atherosclerosis: gathering evidence beyond speculation. Curr Opin Lipidol. 2006;17:548–55.
39. Pedersen SF, Graebe M, Hag AM, Hoejgaard L, Sillesen H, Kjaer A. Microvessel density but not neoangiogenesis is associated with 18F-FDG uptake in human atherosclerotic carotid plaques. Mol Imaging Biol. 2012;14:384–92.
40. Yankeelov TE, Peterson TE, Abramson RG, Izquierdo-Garcia D, Arlinghaus LR, Li X, et al. Simultaneous PET-MRI in oncology: a solution looking for a problem? Magn Reson Imaging. 2012;30:1342–56.
41. Torigian DA, Zaidi H, Kwee TC, Saboury B, Udupa JK, Cho ZH, et al. PET/MR imaging: technical aspects and potential clinical applications. Radiology. 2013;267:26–44.