HAL Id: insu-00256496
https://hal-insu.archives-ouvertes.fr/insu-00256496
Submitted on 21 Aug 2008HAL is a multi-disciplinary open access archive for the deposit and dissemination of sci-entific research documents, whether they are pub-lished or not. The documents may come from teaching and research institutions in France or abroad, or from public or private research centers.
L’archive ouverte pluridisciplinaire HAL, est destinée au dépôt et à la diffusion de documents scientifiques de niveau recherche, publiés ou non, émanant des établissements d’enseignement et de recherche français ou étrangers, des laboratoires publics ou privés.
A new paleogeographic configuration of the Eurasian
landmass resolves a paleomagnetic paradox of the Tarim
Basin (China)
Stuart Gilder, Julia Gomez, Yan Chen, Jean-Pascal Cogné
To cite this version:
Stuart Gilder, Julia Gomez, Yan Chen, Jean-Pascal Cogné. A new paleogeographic configuration of the Eurasian landmass resolves a paleomagnetic paradox of the Tarim Basin (China). Tectonics, American Geophysical Union (AGU), 2008, 27, pp.TC1012. �10.1029/2007TC002155�. �insu-00256496�
A new paleogeographic configuration of the Eurasian
landmass resolves a paleomagnetic paradox of the Tarim
Basin (China)
Stuart A. Gilder :Department of Earth and Environmental Sciences, Ludwig Maximilians
University,
Munich, Germany
Julia Gomez : Laboratoire de Sciences de la Terre, Ecole Normale Supérieur de Lyon,
Lyon, France
Yan Chen : Université d'Orléans, CNRS/INSU, Institut des Sciences de la Terre d'Orléans -
UMR 6113, Campus Géosciences, 1A, rue de la Férollerie, 41071 Orléans cedex 2 France
Jean-Pascal Cogné : Laboratoire de Paléomagnétisme, Institut de Physique du Globe de
Paris, Paris, France
Abstract
New paleomagnetic data from Permian red beds and Middle Jurassic limestones from the Tarim Basin pose a paradox. Their declinations are similar to Upper Carboniferous to
Neogene rocks collected from the same sections, and their inclinations parallel present values. When assuming that lower than expected inclinations in continental sedimentary rocks arise from inclination shallowing effects, then the paleolatitudes of all Upper Carboniferous to Present rocks from Tarim are indistinguishable. Local vertical axis block rotations occurring in the last 20 million years explain why declinations vary at different localities in the basin. Our Middle Jurassic data positions Tarim 23.6 ± 8.4° farther south than that predicted from the coeval reference pole for Eurasia; however, no geologic argument exists to support the closure of a large ocean basin between Tarim and Siberia since the Middle Jurassic. Thus the paradox: are the rocks from Tarim totally overprinted, or is the middle Mesozoic part of the reference Eurasian apparent polar wander path erroneous? Several lines of evidence suggest the Tarim rocks are not remagnetized. We conclude that Tarim has experienced little or no apparent polar wander since the Carboniferous. Moreover, our Middle Mesozoic
reconstruction of Eurasia using the new Middle Jurassic pole from Tarim results in a more geologically compatible solution for the eastern Asian blocks over previous reconstructions.
Keywords: Paleomagnetism, tectonics, paleogeography, Jurassic, Permian, Asia.
1 -
Introduction to a Paleomagnetic Paradox
Central Asia boasts one of the world's densest regions sampled for paleomagnetic data thanks to numerous sections of well-exposed rocks possessing stable remanent magnetizations. Such is the case for the Tarim Basin (Figure 1), which is represented by a quasi-continuous time sequence of paleomagnetic poles since the Permo-Carboniferous. Most of these poles are derived from studies based on six or more sampling sites (>50 samples) that demonstrate positive fold and/or reversal tests. Permo-Carboniferous rocks usually have reverse polarities, and samples collected from Cretaceous rocks usually have normal polarities, consistent with
deposition and acquisition of magnetic remanence during the Kiaman and Cretaceous Long Normal superchrons, respectively.
Initial paleomagnetic studies on Cretaceous rocks from Tarim required 5° to 10° of
intracontinental shortening with respect to stable Eurasia [Chen et al., 1991, 1993]. Although relatively large, 500 to 1000 kilometers of shortening achieved over some 100 million years was not irrefutable with the geologic data. As Cenozoic paleomagnetic data from central Asia became available, workers found that the paleolatitudes of these younger rocks were
indistinguishable from those of the Cretaceous rocks [Thomas et al., 1993; Gilder et al., 1996], e.g., their poles lie on the same small circle centered on the sampling sites (Figure 2). However, compared against Eurasia's apparent polar wander path (APWP), instead of 5° to 10° of intracontinental shortening, the Cenozoic poles required 10° to 20° of shortening. Such large shortening amounts (1000 to 2000 km) were untenable when compared against geologic constraints. Such an incompatibility led workers to seek alternative solutions.
Non-dipole field effects were proposed to reconcile the far-sided central Asian poles with the Eurasian APWP. For example, in a compilation of early Oligocene to middle Eocene
paleomagnetic data from the Tethyan mobile belt, Westphal [1993] concluded that the dipole was canted, with a north magnetic pole at 69°N, 215°E, which is nearly identical to the mean pole derived from Upper Jurassic to Cenozoic rocks from Tarim. In another study of Cenozoic paleomagnetic data from Eurasia, Chauvin et al. [1996] found a spatial gradient in inclination anomalies, with a maximum centered over central Asia, whose origin was thought to result from an aberration of the dipole field. A study compiling paleomagnetic data from Pakistan to China led Si and Van der Voo [2001] to conclude that the dipole field was contaminated by a significant (>6%) contribution from an octupole field.
Another hypothesis to account for the discrepancy between the far-sided central Asian poles with the Eurasian APWP assumes that the Eurasian plate is not rigid [Cogné et al., 1999]. Because most data used to define the synthetic Eurasian APWP come from Europe, roughly 90° in longitude away from central Asia, a slight relative rotation between Europe and Asia translates into paleolatitude differences for sites in Asia. Thus a 10 to 15° clockwise rotation of Europe with respect to Asia would result in Asian poles that are 10 to 15° farther away from their “true” position, hence producing an artifact of 10 to 15° steeper paleolatitudes required in Asia.
A further complication arises from inclination shallowing, which causes paleomagnetic poles to shift farther from a sampling locality than poles derived from non-shallowed inclinations from the same locality. Because paleomagnetic inclination is translated into paleolatitude via the dipole equation, inclination shallowing effects can also explain the discrepancies [e.g., Anson and Kodama, 1987; Deamer and Kodama, 1990]. Indeed, most recent studies conclude that syn-sedimentary and/or compaction induced inclination shallowing explains the
discrepancy between the central Asian and Eurasian Late Jurassic to present paleomagnetic poles [Gilder et al., 1996, 2001, 2003; Dupont-Nivet et al., 2002; Bazhenov and Mikolaichuk, 2002; Tan et al., 2003; Tauxe and Kent, 2004]. A longstanding argument was that, because the early paleomagnetic studies on Cenozoic rocks were based on continental red beds, and because continental red beds are fossil-poor, perhaps all the Cenozoic strata were actually Cretaceous in age. This argument has waned as magnetostratigraphic studies were employed to date the rocks. For example, at the Subei locality in the Qaidam Basin, paleontology and magnetostratigraphy were used to date the sediments between 26 and 18 Ma. Yet, the inclination data suggested Subei moved north 14° (>1500 km) with respect to the present
reference frame and 19 ± 3° (>2000 km) north with respect to the 20 Ma synthetic Eurasian reference pole [Gilder et al., 2001]. This result would suggest that Subei's rate of northward motion since 20 Ma amounted to 7.5 cm/yr, or 50% faster than the full convergence rate between the Indian and Eurasian plates. This would imply that 1000 km of extension occurred between Subei and India in the past 20 million years, which is virtually impossible.
Inclination shallowing was thought to best explain this discrepancy, which has since been corroborated using other experimental and numerical techniques and by comparing the sedimentary paleomagnetic data with those from volcanic rocks, which are largely immune from shallowing effects [Bazhenov and Mikolaichuk, 2002; Gilder et al., 2003; Tan et al., 2003; Tauxe and Kent, 2004; Huang et al., 2005]. Sun et al. [2006] found no difference in inclination between sediments and volcanic rocks from the eastern Qaidam Basin. In this case, both rock types agreed with the expected inclination from the synthetic reference pole for Eurasia.
Going further back in time to the Carboniferous, the paleomagnetic data from Tarim pose additional intriguing problems. Figure 3 shows Late Jurassic to Cenozoic (herein called the “young” population) and Carboniferous to Early Triassic (herein called the “old” population) paleomagnetic poles from Tarim (Table 1). The two populations appear different in both inclination (paleolatitude) and declination (rotation) space. However, the paleolatitudes of the older population are identical to those expected from Siberia, implying that no relative
latitudinal displacement has occurred between Tarim and Siberia since the Carboniferous. This again corroborates the inclination shallowing hypothesis to explain the paleolatitude discrepancies of the younger population because one would expect the older rocks to have experienced the same or greater amounts of shortening as the younger rocks, which is not the case. So when comparing the populations of “young” and “old” poles, and accounting for the inclination shallowing effects of the sedimentary rocks in the young population, the only remaining difference between the two groups is in declination (rotation) space. However, because most of the “young” and “old” rocks from Tarim were not collected from the same place, differences in declination could be due to local, vertical-axis block rotations between the various localities. Indeed, in two cases where paleomagnetic samples were collected from young and old rocks in the same area, Gilder et al. [1996] showed that a great circle passes through both the young and old poles and the sampling site (Figure 4). This could suggest that no relative rotation occurred between the time represented by the old and young rocks
collected at the same place. Moreover, declination differences from one place to another in Tarim would be due to local vertical-axis block rotations occurring over approximately the past 20 million years.
Gilder et al. [1996] also evaluated the available Early to Middle Jurassic (J1–2) data from
Tarim. Acknowledging that the data from three published studies are of poor quality, they averaged the three to derive a mean J1–2 pole (Figure 5), which is substantially different than
that for Eurasia, yet statistically indistinguishable from the mean Late Jurassic to Cenozoic (“young”) and Carboniferous to Early Triassic (“old”) poles. If the magnetizations from the J1–2 rocks are primary, a tectonic resolution of the J1–2 paleomagnetic poles would require a
three thousand kilometer latitudinal separation of Tarim and Eurasia. To date, no post-Middle Jurassic suture zone has been identified north of Tarim, which could indicate that the J1–2
results are actually secondary magnetizations (remagnetized). Moreover, because all Carboniferous to present poles are essentially identical, except for vertical axis rotations acting in the last 20 million years, perhaps all pre-20 Ma rocks were affected by a widespread remagnetization at ca. 20 Ma. This is consistent with the widespread remagnetization that occurred during deformation as Europe and North America collided to form Pangea [Oliver,
1986; McCabe and Elmore, 1989]. This leads to the Tarim paleomagnetic paradox: is there a problem (remagnetization, etc.) with the plentiful Tarim data, or is the J1–2 part of the
Eurasian APWP not representative of the land east of the Ural Mountains? If the latter is true, then prior tectonic reconstructions must be completely revised. If the former is true, then when/how can we rely on paleomagnetic data?
To shed light on the Tarim paradox, we carried out new paleomagnetic studies on Permian and Middle Jurassic rocks from Tarim (Figure 1). Permian rocks were collected from the Qimugen section in southwest Tarim (Figure 6). This is the same section where Chen et al. [1991] carried out a paleomagnetic study on what were thought at the time to be Cretaceous rocks. However, we now know that the rocks collected by Chen et al. [1991] come from the Oligo-Miocene Wuqia Group [Stratigraphic Commission of Xinjiang Province, 1981, pp. 378–383]. Gilder et al., [1996, p. 22,028] predicted that the paleomagnetic pole for the Permian rocks from the Qimugen section would lie at latitude (λ) 78°N, longitude ( ) 208°E. The prediction was made by fitting a great circle through the Oligo-Miocene pole of Chen et al. [1991] and the sampling locality, then moving 9° along the great circle toward the sampling site to account for inclination shallowing of the younger rocks (Figure 4). In other words, the old (Permian) pole was predicted to lie on a great circle, 9° closer to the sampling site than the young (then Cretaceous, now Oligo-Miocene) pole reported by Chen et al. [1991]. Thus one goal of our study was to test our earlier prediction. Middle Jurassic rocks were collected from the Kuche region in northern Tarim (Figure 7). These strata were
collected to test whether the J1–2 pole is indeed indistinguishable from the Late Carboniferous
to Early Triassic and Late Jurassic to Cenozoic poles from Tarim, or whether the J1–2 pole
coincides with the expected Eurasian APWP. As Permian and Late Jurassic to Cenozoic poles from the Kuche region already exist, the J1–2 data from Kuche potentially hold the key to
solving the Tarim paleomagnetic paradox.
2. Geologic Setting
The Qimugen section (Figure 6) comprises a nearly continuous Cretaceous to Quaternary rock record, with the Permian Shuicheng Group sediments directly underlying the Cretaceous strata in an angular unconformable contact. We collected 72 samples at nine sites in red siltstones and sandstones within the lower member of the Daliyaoer Formation in the Permian Shuicheng Group (Table 2). Bivalves Schizodus jakovlevi, S. obscurus and Carbonicola sp., the lamellibranche pelecypode Anthracomya sp., the mollusk (Scaphopoda) Laevidentalium sp. and the gastropod Orthonema sp. found at the Qimugen section, together with several species of gastropods, plant remains and equivalent fossils found at the nearby Tamu section, date these strata as Permian. Cylindrical folds crop out over wavelengths of roughly one kilometer. The bedding attitudes from the sites we sampled define a fold axis striking 316°N. As stated above, Chen et al. [1991] obtained paleomagnetic results from the Oligo-Miocene Wuqia Group located up-section of our Permian sites.
We collected 120 samples at 15 sites in Middle Jurassic marls near the city of Kuche at two different localities (Figure 7): one up the Kuche river and another up the Yaha river (Table 2). Sections along both sides of these rivers were sampled in the fossil-rich Qiakemake
Formation. A wide variety of pollen (spore), ostracod, charophyte, and plant fossils are characteristic of the Middle Jurassic [Chinese Bureau of Geology, 1981, pp. 147–157]. Most of the strata dip vertically to slightly overturned. One small-scale fold in the Yaha river valley
was sampled in order to apply an internal fold test. Several paleomagnetic studies have been carried out in the Kuche and Yaha river valleys: McFadden et al. [1988] for the Permo-Triassic, Li et al. [1988a] and Tan et al. [2003] for the Cretaceous, Huang et al. [2006] for the Oligo-Miocene and Charreau et al. [2006] for the Miocene.
3. Paleomagnetism
Paleomagnetic samples were collected using a portable gasoline-powered drill and oriented with magnetic and sun compasses, the latter to correct for local declination anomalies, which averaged 3.4 ± 1.4° (1σ) (N = 63) at Qimugen and 3.4 ± 0.8° (1σ) (N = 64) at Kuche.
Magnetic remanences were measured with a 2G Inc. 3-axis, DC-SQUID magnetometer installed in a magnetically shielded room at the Institut de Physique du Globe de Paris. An average of 12 demagnetization steps were applied to each sample. Bulk susceptibility was measured after each heating step for a third of the samples to monitor potential changes in magnetic mineralogy. Magnetization components were determined using principal component analysis [Kirschvink, 1980] except when multiple components with overlapping spectra were present, in which case we used the remagnetization great circle method [McFadden and McElhinny, 1988]. Site-mean directions were calculated using Fisher [1953] statistics. Data were treated using the software of Cogné [2003] and R. Enkin [unpublished]. Results are listed in Table 2.
3.1. The Permian Daliyaoer Formation
Natural remanent magnetization intensities of the Permian red beds range from 1.5 × 10⁻⁴ to 3.9 × 10⁻³ A/m with an average of 8.9 × 10⁻⁴ A/m. When undergoing thermal
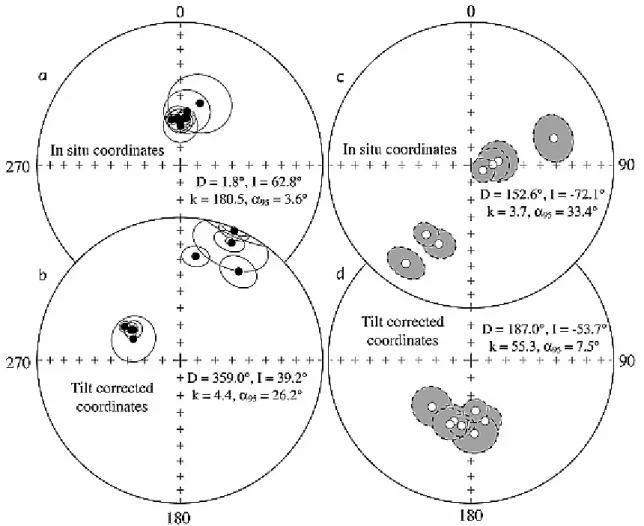
demagnetization, some samples, especially those from site c952, only possess a north and down component (in situ coordinates) that dominates the entire unblocking temperature range until >650°C. However, for most samples, the intensities increase and the directions change until laboratory unblocking temperatures of 300 to 500°C. Magnetization directions below 300 to 500°C define linear segments that do not decay toward the origin on orthogonal diagrams (Figure 8). These low unblocking temperature components are north and downward directed in in situ coordinates. The Enkin [2003] direction-correlation tilt test applied to the north and downward directed component is negative as the optimal clustering occurs at 1 ± 10% unfolding (Figures 9a and 9b). The overall average direction of this component based on nine site-mean directions in in situ coordinates (declination [D] = 1.8°, inclination [I] = 62.8°, the radius that the mean direction lies within 95% confidence [α95] = 3.6°) lies close to both
the expected present-day field (D = 3.4°, I = 57.3°) and axial dipole (D = 0°, I = 57.8°) directions and likely represents a recent overprint.
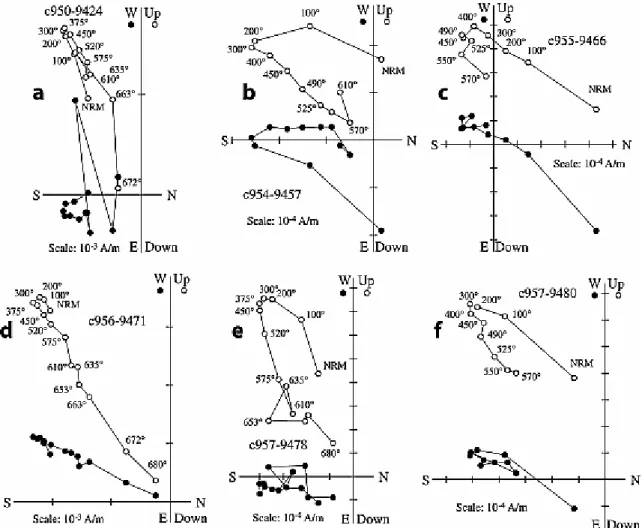
For most samples, at laboratory unblocking temperatures above 300 to 500°C, the magnetic remanence reaches a stable endpoint, clearly defining a coherent magnetization component that decays toward the origin on orthogonal demagnetization diagrams (Figure 8). Those directions were anchored to the origin in the best fitting routine except for a few samples that possess a south and upward directed component but do not decay toward the origin.
Magnetization directions often become erratic above 570°C when magnetic susceptibility markedly increases. All of the high temperature unblocking components are of reverse polarity, consistent with remanence acquisition during the Kiaman reversed polarity superchron. The direction-correlation test [Enkin, 2003] applied to the high-temperature component site mean directions (Table 2 and Figures 9c and 9d) suggests a positive tilt test at
88 ± 18% unfolding. We therefore consider that the overall mean high temperature
component direction at 100% unfolding represents the Permian field recorded at the time of sedimentation.
3.2. The Middle Jurassic Qiakemake Formation
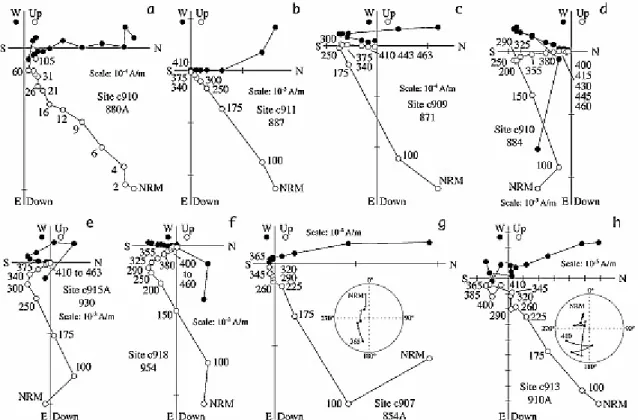
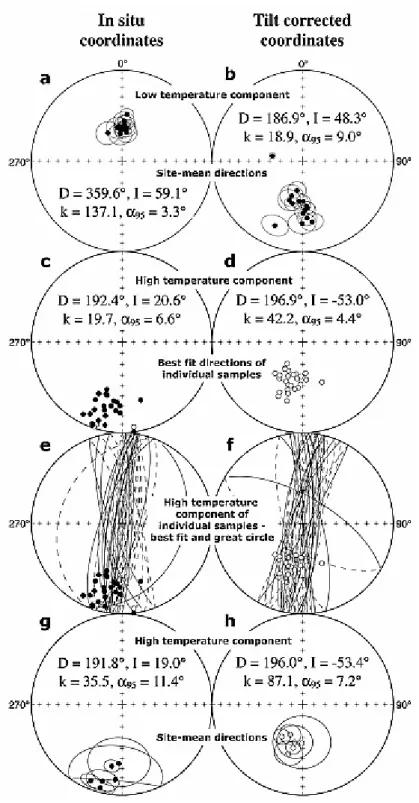
Natural remanent magnetization intensities of the Middle Jurassic limestones and marls range from 1.0 × 10⁻⁴ to 7.7 × 10⁻³ A/m with an average of 1.2 × 10⁻³ A/m. Above ~100°C or ~4 mT, thermal or AF demagnetization isolates a north and down directed component (in situ coordinates) in 132 specimens, with more than half possessing this component over the entire unblocking spectra (Figures 10a and 10b). Best fit line segments of this component yield well-clustered site-mean directions, with an overall mean direction in situ coordinates at D = 359.8°, I = 59.1° (α95 = 3.0°, N = 15 sites) (Figures 11a and 11b), which lies close to the
geocentric axial dipole (I = 61°) and present-day (D = 3.6°, I = 61.5°) field directions at Kuche. The fold test parameter maximizes at 4 ± 6% unfolding, clearly indicating a negative fold test.
Thermal demagnetization of 26 samples isolates a second magnetic component above ~250°C with southward declinations and mostly downward inclinations in in situ coordinates that decay univectorally to the origin upon progressive demagnetization up to 465°C (Figures 10c to 10f). The in situ mean direction of the 26 samples is D = 192°, I = 21°, (α95 = 6.6°, k = 19.7
[k is the best estimate of the precision parameter]) while the tilt corrected mean direction is D = 197°, I = −53°, (α95 = 4.4°, k = 42.2) (Table 2) with a k maximum at 100% unfolding that
passes the direction-correlation tilt test at 121 ± 28% unfolding (Figures 11c and 11d). Stepwise demagnetization of 22 samples define trajectories that go from the present field direction toward this high temperature component (Figures 10g and 10h), yet the
magnetization directions become erratic above ~400°C when bulk magnetic susceptibility and/or magnetic intensity begins to markedly increase. Remagnetization great circles were fit to these samples (Figures 11e and 11f and Table 2). We calculated site mean directions for those sites that had either three or more best fit sample directions or at least three
remagnetization great circles and one set point to satisfy the McFadden and McElhinny [1988] technique (Table 2). Of these six sites, the small-scale fold within site c015 allows the application of a local fold test, which is positive at 95% confidence limits according to the F test [McElhinny, 1964] while the direction-correlation test is positive, albeit at 125 ± 74% unfolding. The relatively high tilt-corrected α95s for sites c15 (15.4°) and c15A (25.0°) can be
attributed to the low number of samples (N = 4 and N = 3, respectively) used to calculate the site mean directions. Because of the variable bedding attitudes for site c15, the McFadden [1990] fold test is best suited for the Middle Jurassic data set, which is positive at 95% confidence limits.
Although the fold tests are positive, the high temperature components of all samples are solely of reverse polarity. This poses a problem because the Middle Jurassic is a time in Earth's history with a relatively high reversal frequency [Yang et al., 2006]. Because the age of folding is late Tertiary at our sections [Hubert-Ferrari et al., 2007], the fold test only
constrains the age of the high temperature component to be pre-late Tertiary. For this reason, we carried out a suite of rock magnetic experiments to help define the age of remanence acquisition.
We first observed thin sections of the marls in optical and scanning electron microscopes. The most interesting finding was the presence of zoned Fe-oxides containing 86% or 94% Fe
(weight percentages expressed as oxides) with Si, Mg, ±Mn but no Ti (Figures 12a and 12b). These oxides are obviously not detrital, unlike the sub-rounded TiO2 and SiO2 grains in the
vicinity. Because the zones are never truncated, this material probably replaced CaCO3 and/or
filled pre-existing pore spaces. The low aspect ratios of the zoned Fe oxides suggest that they formed soon after deposition, likely during diagenesis. Although no siderite (FeCO3) was
observed, CaCO3 in close proximity to the iron oxides has 3% Fe, which potentially served as
the source of the iron in the zoned iron oxides. In other thin sections, we observed detrital, Fe-pure magnetite grains, yet they were always embedded in quartz, suggestive of an igneous or metamorphic source rock (Figure 12c). Any obvious post-diagenetic mineralization was signified by the presence of barite (BaSO4), but never Fe-bearing phases, within stylolites
(Figure 12d).
Curie temperatures of titanomagnetite with 86 and 94% Fe (14 and 6% Ti) are about 510°C and 550°C, respectively [Akimoto, 1962]. Assuming that the Curie points are the same for magnetite with substituted cations other than Ti, then these temperatures roughly coincide with Curie point experiments on the Qiakemake carbonates that commonly show progressive drops in susceptibility between 400°C and 550°C (Figure 13). Although a few samples exhibit fairly reversible curves, most undergo marked irreversible changes beginning at ~400°C. Anisotropy of magnetic susceptibility (AMS) experiments on 56 samples were carried out on an AGICO KappaBridge KLY 3 to examine the rock magnetic fabric. Bulk susceptibility averages 9.1 × 10⁻⁵ ± 4.2 × 10⁻⁵ (SI) with very low degrees of anisotropy (0.7 ± 0.4%).
Two-thirds of the samples are characterized by oblate anisotropy ellipsoids. In tilt-corrected coordinates, the maximum and intermediate anisotropy axes mostly lie in the sedimentation plane, and the minimum axes are perpendicular to bedding (Figure 14), which is typical of a sedimentary fabric [Tarling and Hrouda, 1993]. This is especially true for samples with higher degrees of anisotropy and/or oblate shapes. No systematic difference in AMS parameters exists between samples possessing a high temperature component and those that do not. Taken together, the rock magnetic data do not provide a definitive answer concerning the relative age of magnetization, yet the sedimentary fabric and the positive fold test lean in favor of a depositional or syn-diagenetic age for the remanence.
4. Discussion
4.1. No Apparent Polar Wander of Tarim Since the Late Carboniferous
The Permian pole for the Qimugen rocks investigated here lies at 85.0°N, 199.4°E (A95 =
12.4°), within 95% confidence limits of that predicted by Gilder et al. [1996] (78°N, 208°E, A95 = 7.3° [an A95 of 7.3° was assigned because it was the mean A95 of the poles from the old
population]) (Figure 15). Because the two poles are indistinguishable at the 95% significance level, we argue that the earlier prediction has been validated. The basis of the prediction was that Tarim has experienced no or only minor apparent polar wander since the Late
Carboniferous because (1) paleolatitudes of the “old” population are similar to today's latitude, (2) local vertical-axis block rotations younger than 20 Ma account for differences in declination between localities, and (3) the paleolatitudes of the younger sediments are biased toward more southerly latitudes than the older sediments due to syn-sedimentation or
compaction-induced inclination shallowing. If true, the Early to Middle Jurassic data are very important for further testing and understanding the implications of the data, so we now turn our attention to them.
4.2. Kuche: Key to Resolving the Paleomagnetic Data From Tarim
The interpretation of the paleomagnetic poles from the Kuche region, plotted in Figure 16 (data in Table 1), likely holds the key to understanding the whole of the paleomagnetic data from Tarim. An important point surrounds the structural relationships between the sampling localities. Cretaceous and older rocks collected for paleomagnetic studies lie closer to the Tianshan Mountains than the Cenozoic rocks where paleomagnetic data has been obtained. Cretaceous and older poles lie on the same great circle path that passes through the sampling sites. The paleomagnetic data reported by Charreau et al. [2006] come from Miocene rocks that crop out in the anticlines related to thin-skinned style deformation in the fold and thrust belts within the foreland basin south of the Tianshan.
Huang et al. [2006] carried out a magnetostratigraphic study at two sections (called A and B) separated by 2 km. Section B of Huang et al. [2006] is characterized by declinations generally >0° and lies closer to the Tianshan Mountains than Section A, which is characterized by declinations generally <0°. Huang et al. [2006] argued that the change in declination within and between the two sections was progressive, with inferred clockwise rotation taking place from ca. 26 to 12 Ma, followed by counterclockwise rotation from 12 Ma to present. Their scenario is intriguing because correcting both sections for the latest phase of counterclockwise rotation would place the Section B pole on the great circle (Figure 16).
However, an anticline is situated at the northern part of Section A, in-between the two sections (see Figure 1 of Huang et al., 2006). Because anticlines are often an expression of deep-seated thrust faults [Hubert-Ferrari et al., 2007], this structural discontinuity makes it plausible that the relative rotation between the two sections is due to a differential vertical axis block rotation, younger than ca. 5.5 Ma. This is consistent with detailed structural geology work performed at the nearby Yakeng anticline, which is a pure-shear detachment fold having a well-constrained history of growth beginning at 5.5 Ma [Hubert-Ferrari et al., 2007]. Moreover, paleomagnetic declinations from the Yaha section, dated from 12.5 to 5.2 Ma, which lies about 10 km to the south of Section A, are identical to those from Section A, yet display no hint of a progressive rotation [Charreau et al., 2006]. Except for Section B, paleomagnetic rotations in the foreland folds on both sides of the Tianshan are rotated
systematically counterclockwise, which Charreau [2005] and Charreau et al., [Neogene uplift of the Tianshan mountains observed in the magnetic record of the Jingou River section (Northwest China), submitted to Tectonics, 2007] argued are local vertical-axis block
rotations related to sinistral transpression. Under this model, the foreland anticlines absorb the left-lateral shear component while the mountains accommodate the bulk of the compressive-normal stress. Our working hypothesis is that the counterclockwise rotations are 5 Ma or younger in time, that they are local in nature, and that they coincide with the age of the growth strata, and thus folding and deformation in the Tianshan domain. We thus think that the most probable interpretation of the paleomagnetic data from sections A and B is that they are both discrete block rotations with greater amounts of counterclockwise rotation going farther south, away from the mountain chain. In other words, the declination corresponding to the paleomagnetic poles lying on the great circle in Figure 16 would be representative of the Tianshan Mountains at Kuche, while sinistral shear localized in the foreland anticlines rotated those sediments counterclockwise with respect to the older rocks. Section B of Huang et al. [2006] likely sits close to the limit where the sinistral component of deformation ends.
The paleolatitudes of Middle Jurassic and Permian to Lower Triassic rocks from Kuche are higher (e.g., the poles are closer to the sampling site) than those of younger rocks (Figure 16). This could be due to apparent polar wander. However, the older rocks are limestones and volcanic rocks, whereas the younger rocks are continental sedimentary rocks. The latter are widely known to be more prone to inclination shallowing. Also, if it is true that inclination shallowing accounts for the difference, and given the seemingly reliable
magnetostratigraphies obtained in the Kuche region plus the positive fold tests, then it is hard to imagine that the Middle Jurassic rocks are overprinted. For example, the growth of
secondary magnetic minerals during fluid migration preceding folding should be immune to inclination shallowing. Moreover, the Middle Jurassic limestones appear less porous than the continental sandstones both under- and over-lying them; any fluid expulsed during orogenesis would probably migrate through the sandstones and not the carbonates. Thus we infer that the magnetic remanence of the Middle Jurassic Qiakemake Formation is primary. If true, the tectonic consequences are profound.
4.3. Tectonic Implications: A New Reconstruction for Eurasia
Besides the Middle Jurassic pole obtained in this study, Meng et al. [1998] also reported paleomagnetic data from 10 sites (4 to 6 samples per site) of sandstones from the Tuoyun region in western Tarim, which they ascribed to the Middle Jurassic (no age information or formation name provided). Five sites have reverse polarities, four have normal and one site is an outlier. After omitting the outlier, the fold test is positive on the remaining nine sites (ks/kg = 10) with k maximizing at 100% unfolding. The declination of the overall mean direction (D = 35.4°, I = 36.2°, α95 = 6.5°) is very similar to that obtained for Cretaceous and Paleocene
basalts from the area, whereas the inclination is 14° shallower than that of the basalts [Gilder et al., 2003; Huang et al., 2005]. Indeed, the average tilt corrected direction for the Middle Jurassic sandstones is indistinguishable at 95% confidence limits from that for Lower Cretaceous red beds from Tuoyun (D = 37.9°, I = 38.6°, α95 = 6.8°) [Gilder et al., 2003].
Figure 17 plots the Middle Jurassic poles from Meng et al. [1998] and this study, together with the mean poles of the “young” and “old” populations from Tarim and the APWPs from Besse and Courtillot [2002] for Eurasia from 0 to 200 Ma and from Van der Voo [1993] from 210 to 340 Ma. The Middle Jurassic spans from 159 to 180 Ma according to the Geological Society of America [1999] timescale or from 161.2 to 175.6 Ma from Gradstein et al. [2004]. Compared with the 170 Ma reference pole, the Kuche and Tuoyun Middle Jurassic poles experienced 23.6 ± 8.4° and 34.4 ± 7.6° of northward convergence with respect to Siberia, respectively. The shallower paleolatitude found in the Middle Jurassic sandstones from Tuoyun is likely ~10° too shallow as a result of aberrations in the recording process that occurred during sedimentation. This makes sense because the Kuche pole is based on limestones, with low degrees of anisotropy, that should be little or unaffected by inclination shallowing. If one accounted for this, then the Middle Jurassic paleolatitude from Tuoyun would be close to that of Kuche. Thus when compared to Eurasia, the Kuche Middle Jurassic data necessitates >2500 km of northward convergence between Tarim and continental
lithosphere directly north of it (Figure 18a). Because the Lower Cretaceous Tuoyun basalts yield data showing insignificant (3.9 ± 8.1°) poleward displacement with respect to Siberia [Gilder et al., 2003], it would mean that the northward convergence implied by the Middle Jurassic data would have to take place before the Cretaceous (113.3 ± 1.6 Ma—the age of the Cretaceous Tuoyun basalts dated by Sobel and Arnaud [2000]). To our knowledge, no post-Middle Jurassic, pre-Cretaceous suture zone exists north of Tarim that would lend credence to a large paleo-ocean separating Tarim from Siberia; e.g., no middle to late Mesozoic
ophiolites, high-pressure facies metamorphic rocks, etc., crop out in the area. Therefore the reconstruction in Figure 18a, based on the synthetic Middle Jurassic pole for Eurasia [Besse and Courtillot, 2002], is unlikely.
Viable tectonic solutions to explain the discrepancy require that the Middle Jurassic
paleomagnetic poles for Eurasia are not representative of the land east of the Ural Mountains. None of the individual poles used to calculate the mean synthetic Middle Jurassic pole come from rocks east of the Urals [Besse and Courtillot, 2002]. In fact, only one Middle Jurassic pole used in the Besse and Courtillot [2002] compilation comes from Europe (eastern France, [Kadzialko-Hofmokl et al., 1988]). Thus an alternative approach is to assume that the Tarim pole best represents Eurasia, anchor the two together, and then reconfigure the
paleogeography (Figure 18b). The resultant places Mongolia (often referred to as Amuria) near Eurasia, which is more likely than having a large ocean (Mongol-Okhotsk) between the two, as proposed in other reconstructions using the Eurasian reference pole (see Roger et al. [2003] for discussion). It is important to note that Mongolia (Amuria) and Siberia are still separated by ~1000 km in the Middle Jurassic reconstruction using the Tarim pole. This is compatible with Late Jurassic and Cretaceous paleomagnetic and structural observations suggesting that the Mongol-Okhotsk suture was not completed until the lower Cretaceous [Halim et al., 1998; Kravchinsky et al., 2002; Cogné et al., 2005]. On the other hand, the reconstruction in Figure 18b implies that eastern France rotated clockwise with respect to Siberia between the Middle Jurassic and the Early Cretaceous based on the data of Kadzialko-Hofmokl et al. [1988]. A potential solution would be reminiscent of the non-rigid Eurasian block hypothesis of Cogné et al. [1999] proposed for the Cenozoic, except occurring between the Middle Jurassic and the Early Cretaceous.
Finally, a remotely plausible tectonic solution requires that a ca. Late Jurassic, N-S-trending, sinistral mega-shear lies within the N-S-trending Ural Mountains. Such a fault could have facilitated the northward movement of the Chinese blocks with respect to Europe. If viable, the European pole would then effectively represent Europe, while the Tarim pole would represent Asia until the end of motion in the Early Cretaceous.
5. Conclusions
Using the rotational and translational (latitudinal) information inherent in paleomagnetic data, one can begin to understand a region's deformation history to the extent that predictions can be made and tested. This is especially true when compounding the paleomagnetic data in the time domain, as older rocks should express the rotational and/or translational record found in younger rocks from the same area, and if not, the paradox must be explained. In Tarim, inclination shallowing in continental facies sediments, which comprise most Late Jurassic and younger rocks, clearly accounts for their systematically shallower inclinations than those predicted from the Eurasian APWP. Accounting for the inclination shallowing effect, by either comparing data against marine facies or volcanic rocks that are much less prone to inclination shallowing [Bazhenov and Mikolaichuk, 2002; Gilder et al., 2003; Huang et al., 2005], or by using experimental or numerical techniques [Tan et al., 2003; Tauxe and Kent, 2004], suggests there is little paleolatitudinal difference among all rocks from Tarim since the Upper Carboniferous. This is consistent with the fact that Permian paleolatitudes from Tarim and Junggar are indistinguishable at 95% confidence limits from those of the Siberian traps [Gilder et al., 1996; Wang et al., 2007].
Another characteristic of the paleomagnetic data from Tarim is that rocks collected from the same section have the same declinations, e.g., a great circle passes through the poles and the sampling site. This was the second basis of the prediction for the Permian pole at Qimugen, and it implies that Tarim experienced no rotation from the Carboniferous until the most recent phase of deformation in the Miocene. This latter finding is puzzling because, at the Qimugen and Duwa localities in west and south Tarim, a deformation event occurred around the Middle Triassic to Lower Jurassic (e.g., Figure 6), possibly related to amalgamation of the northern Tibetan blocks with southern Tarim [e.g., Roger et al., 2003]. It seems hardly possible this deformation episode had no shear component, as large-scale deformation involving faulting and folding often do. A second problem is to account for the 30° counterclockwise rotation of Tarim with respect to Siberia required by the Permian data. The question then arises as to how to account for this relative rotation if Tarim remained virtually stationary since the Upper Carboniferous?
These observations force us to reconsider the remagnetization hypothesis. Widespread
remagnetization at around 20 Ma affecting all Tarim rocks (1) could explain why some of the paleolatitudes of the pre-20 Ma rocks are similar to present values, (2) could explain why the Middle Jurassic poles are so different from those based on the synthetic Eurasian APWP, and (3) would account for the apparent relative rotation of the Permian rocks with respect to Siberia. However, a hypothetical remagnetization event carries several incompatibilities. As noted above, the data from Tarim show that Permo-Carboniferous rocks typically have reverse polarities, Cretaceous rocks usually have normal polarities, and Tertiary rocks have magnetostratigraphies that correlate with the global polarity timescale. Systematic differences in inclination between various rock types also argue against remagnetization.
We conclude that the paleomagnetic data from Tarim represent primary magnetizations and, when accounting for inclination shallowing of the continental facies rocks, that Tarim experienced little or no apparent polar wander since the Late Carboniferous. Moreover, assigning Tarim's Middle Jurassic pole, instead of the synthetic pole, to Eurasia yields a more geologically compatible solution for the eastern Asian blocks. Our Middle Jurassic
reconstruction (Figure 18b) admittedly represents a drastic change over previous models, yet the converse solution requiring a post-Middle Jurassic suture is in even greater opposition with geologic observations. So, to a first order, the Tarim paleomagnetic paradox seems fairly well disentangled. Further work is required to explain why the Early Jurassic to Middle Triassic deformation event in southern Tarim does not express itself in terms of rigid body rotations and to reconcile the relative rotation of the Permian poles between Tarim and Siberia. Also, the consequences of our reconstruction on the north and central Atlantic coastline fits and kinematics of the opening of the early Atlantic needs to be explored.
Acknowledgments
Randy Enkin, John Geissman and Lothar Ratschbacher provided helpful suggestions that improved this work. We thank Yongan Li, Dongjiang Sun and Shaozhu Wu for logistical support in the field. IPGP contribution 2289.
References
Akimoto, S. (1962), Magnetic properties of FeO-Fe2O3-TiO2 system as a basis of rock
magnetism, J. Phys. Soc. Jpn., 17(suppl. B1), 706–710.
Anson, G. L., and K. P. Kodama (1987), Compaction-induced inclination shallowing of the post- depositional remanent magnetization in a synthetic sediment, Geophys. J. R. Astron. Soc., 88, 673–692.
Bai, Y. H., G. L. Chen, Q. G. Sun, Y. H. Sun, Y. A. Li, Y. J. Dong, and D. J. Sun (1987), Late Paleozoic polar wander path for the Tarim platform and its tectonic significance,
Tectonophysics, 139, 145–153.
Bazhenov, M. L., and A. V. Mikolaichuk (2002), Paleomagnetism of Paleogene basalts from the Tien Shan, Kyrgyzstan: Rigid Eurasia and dipole geomagnetic field, Earth Planet. Sci. Lett., 195, 155–166.
Besse, J., and V. Courtillot (1991), Revised and synthetic apparent polar wander paths of the African, Eurasian, North American and Indian plates, and true polar wander since 200 Ma, J. Geophys. Res., 96, 4029–4050.
Besse, J., and V. Courtillot (2002), Apparent and true polar wander and the geometry of the geomagnetic field in the last 200 million years, J. Geophys. Res, 107(B11), 2300,
doi:10.129/2000JB000050.
Charreau, J. (2005), Evolution tectonique du Tianshan au Cénozoïque liée à la collision Inde-Asie – Apports de la magnétostratigraphie et de la géochronologie isotopique U-Th/He, Ph.D. thesis, Université d'Orléans, Orléans, France.
Charreau, J., S. Gilder, Y. Chen, S. Dominguez, J. P. Avouac, S. Sen, M. Jolivet, Y. A. Li, and W. M. Wang (2006), Magnetostratigraphy of the Yaha section, Tarim Basin (China): 11 Ma acceleration in erosion and uplift of the Tianshan Mountains, Geology, 34, 181–184. Chauvin, A., H. Perroud, and M. L. Bazhenov (1996), Anomalous low paleomagnetic inclinations from Oligocene-Lower Miocene red beds of the south-west Tien Shan, Central Asia, Geophys. J. Int., 126, 303–313.
Chen, J., D. W. Burbank, K. M. Scharer, E. Sobel, J. H. Yin, C. Rubin, and R. B. Zhao (2002), Magnetochronology of the Upper Cenozoic strata in the Southwestern Chinese Tian Shan: Rates of Pleistocene folding and thrusting, Earth Planet. Sci. Lett., 195, 113–130. Chen, Y., et al. (1991), Paleomagnetic study of Mesozoic continental sediments along the northern Tien Shan (China) and heterogeneous strain in Central Asia, J. Geophys. Res., 96, 4062–4082.
Chen, Y., J. P. Cogné, and V. Courtillot (1992), New Cretaceous paleomagnetic poles from the Tarim Basin, northwestern China, Earth Planet. Sci. Lett., 114, 17–38.
Chen, Y., V. Courtillot, J. P. Cogné, J. Besse, Z. Y. Yang, and R. Enkin (1993), The
configuration of Asia prior to the collision of India: Cretaceous paleomagnetic constraints, J. Geophys. Res., 98, 21,927–21,941.
Chen, Y., S. Gilder, N. Halim, J. P. Cogné, and V. Courtillot (2002), New paleomagnetic constraints on central Asian kinematics: Displacement along the Altyn Tagh fault and rotation of the Qaidam Basin, Tectonics, 21(5), 1042, doi:10.1029/2001TC901030.
Cheng, G. L., Y. H. Bai, and Y. A. Li (1983), Paleomagnetism of the Lower Permian in the Wushi-Aksu area of Xinjiang, Seimol. Geol., 4, 12.
Chinese Bureau of Geology (1981), Stratigraphic Tables for Xinjiang Autonomous Region, 496 pp. Geological Publishing House, Beijing, China.
Cogné, J. P. (2003), PaleoMac: A Macintosh™ application for treating paleomagnetic data and making plate reconstructions, Geochem. Geophys. Geosyst., 4(1), 1007,
doi:10.1029/2001GC000227.
Cogné, J. P., N. Halim, Y. Chen, and V. Courtillot (1999), Resolving the problem of shallow magnetizations of Tertiary age in Asia: Insights from paleomagnetic data from the Qiangtang, Kunlun, and Qaidam blocks (Tibet, China), and a new hypothesis, J. Geophys. Res., 104, 17,715–17,734.
Cogné, J. P., V. A. Kravchinsky, N. Halim, and F. Hankard (2005), Late Jurassic–Early Cretaceous closure of the Mongol-Okhotsk Ocean demonstrated by new Mesozoic
palaeomagnetic results from the Trans-Baikal area (SE Siberia), Geophys. J. Int., 163, 813– 832, doi:10.1111/j.1365-246X.2005.02782.x.
Deamer, G. A., and K. P. Kodama (1990), Compaction-induced inclination shallowing in synthetic and natural clay-rich sediments, J. Geophys. Res., 95, 4511–4529.
Dupont-Nivet, G., Z. Guo, R. F. Butler, and C. Jia (2002), Discordant paleomagnetic direction in Miocene rocks from the central Tarim Basin: Evidence for local deformation and
inclination shallowing, Earth Planet. Sci. Lett., 199, 473–482.
Enkin, R. J. (2003), The direction-correction tilt test: An all-purpose tilt/fold test for paleomagnetic studies, Earth Planet. Sci. Lett., 212, 151–166.
Fang, D. J., P. Y. Wang, Z. Y. Shen, and X. D. Tan (1998), Cenozoic paleomagnetic results and Phanerozoic apparent polar wandering path of Tarim block, Sci. China (Series D), 41 suppl., 105–112.
Fisher, R. A. (1953), Dispersion on a sphere, Proc. R. Soc. London, A217, 295–305.
Flinn, D. (1965), On the symmetry principle and the deformation ellipsoid, Geol. Mag., 102, 36–45.
Gilder, S., and V. Courtillot (1997), Timing of the North-South China collision from new middle to late Mesozoic paleomagnetic data from the North China Block, J. Geophys. Res., 102, 17,713–17,727, doi:10.1029/97JB01201.
Gilder, S. A., X. X. Zhao, R. S. Coe, Z. F. Meng, V. Courtillot, and J. Besse (1996),
Paleomagnetism, tectonics and geology of the southern Tarim Basin, northwestern China, J. Geophys. Res., 101, 22,015–22,031, doi:10.1029/96JB01647.
Gilder, S., Y. Chen, and S. Sen (2001), Oligo-Miocene magnetostratigraphy and rock magnetism of the Xishuigou section, Subei (Gansu Province, western China), and
implications for shallow inclinations in central Asia, J. Geophys. Res., 106, 30,505–30,521, doi:10.1029/2001JB000325.
Gilder, S., Y. Chen, J. P. Cogné, X. D. Tan, V. Courtillot, D. J. Sun, and Y. A. Li (2003), Paleomagnetism of Upper Jurassic to Lower Cretaceous volcanic and sedimentary rocks from the western Tarim Basin and implications for inclination shallowing and absolute dating of the M-0 (ISEA?) chron, Earth Planet. Sci. Lett., 206, 587–600,
doi:10.1016/S0012-821X(02)01074-9.
Geological Society of America (1999), 1999 Geological Time Scale, compiled by A. R. Palmer and J. Geissman, Geological Society of America, Boulder, USA.
Gradstein, F. M., J. G. Ogg, and A. G. Smith (2004), A Geologic Time Scale 2004, 610 pp. Cambridge Univ. Press, Cambridge, England.
Halim, N., V. Kravchinsky, S. Gilder, J. P. Cogné, M. Alexutin, A. Sorokin, and V. Courtillot (1998), A paleomagnetic study of the Mongol-Okhotsk region: Rotated Lower Cretaceous volcanics and remagnetized Mesozoic sediments, Earth Planet. Sci. Lett., 159, 133–145. Huang, B. C., J. D. A. Piper, Y. C. Wang, H. Y. He, and R. X. Zhu (2005), Paleomagnetic and geochronological constraints on the post-collisional northward convergence of the southwest Tian Shan, NW China, Tectonophysics, 409, 107–124, 10.1016/j.tecto.2005.08.018.
Huang, B. C., J. D. A. Piper, S. T. Peng, T. Liu, Z. Li, Q. C. Wang, and R. X. Zhu (2006), Magnetostratigraphic study of the Kuche Depression, Tarim Basin, and Cenozoic uplift of the Tian Shan Range, Western China, Earth Planet. Sci. Lett., 251, 346–364,
doi:10.1016/j.epsl.2006.09.020.
Hubert-Ferrari, A., J. Suppe, R. Gonzalez-Mieres, and X. Wang (2007), Mechanisms of active folding of the landscape (southern Tian Shan, China), J. Geophys. Res., 112, B03S09,
doi:10.1029/2006JB004362.
Jelinek, V. (1978), Statistical processing of anisotropy of magnetic susceptibility measured on groups of specimens, Studia Geophys. Geod., 22, 50–62.
Jelinek, V. (1981), Characterization of the magnetic fabric of rocks, Tectonophysics, 79, T63– T67.
Kadzialko-Hofmokl, M., J. Kruczyk, and M. Westphal (1988), Paleomagnetism of Jurassic sediments from the western border of the Rheingraben, Alsace (France), J. Geophys., 62, 102–108.
Kirschvink, J. L. (1980), The least-square line and plane and the analysis of paleomagnetic data, Geophys. J. R. Astron. Soc., 62, 699–712.
Kravchinsky, V. A., J.-P. Cogné, W. P. Harbert, and M. I. Kuzmin (2002), Evolution of the Mongol–Okhotsk Ocean as constrained by new palaeomagnetic data from the Mongol– Okhotsk suture zone, Siberia, Geophys. J. Int., 148, 34–57.
Li, Y. P., Z. K. Zhang, M. McWilliams, R. Sharps, Y. J. Zhai, Y. A. Li, Q. Li, and A. Cox (1988a), Mesozoic paleomagnetic results of the Tarim craton: Tertiary relative motion between China and Siberia, Geophys. Res. Lett., 15, 217–220.
Li, Y. P., M. McWilliams, A. Cox, R. Sharps, Y. A. Li, Z. J. Gao, Z. K. Zhang, and Y. J. Zhai (1988b), Late Permian paleomagnetic pole from dikes of the Tarim craton, China, Geology, 16, 275–278.
McCabe, C., and R. D. Elmore (1989), The occurrence and origin of Late Paleozoic remagnetization in the sedimentary rocks of North America, Rev. Geophys., 27, 471–494. McElhinny, M. W. (1964), Statistical significance of the fold test in paleomagnetism, Geophys. J. R. Astron. Soc, 8, 338–340.
McFadden, P. L. (1990), A new fold test for paleomagnetic studies, Geophys. J. Int., 103, 163–169.
McFadden, P. L., and M. W. McElhinny (1988), The combined analysis of remagnetization great circles and direct observations in paleomagnetism, Earth Planet. Sci. Lett., 87, 161–172. McFadden, P. L., X. H. Ma, M. W. McElhinny, and Z. K. Zhang (1988), Permo-Triassic magnetostratigraphy in China: Northern Tarim, Earth Planet. Sci. Lett., 87, 152–160. Meng, Z. F., Y. S. Deng, Z. H. Ding, Y. P. Zheng, Y. A. Li, and D. J. Sun (1998),
Paleomagnetic results from Ceno-Mesozoic volcanic rocks along southern rim of the Tarim Basin, China, Sci. China (Series D), 41, suppl., 91–104.
Oliver, J. (1986), Fluids expelled tectonically from orogenic belts: Their role in hydrocarbon migration and other geologic phenomena, Geology, 14, 99–102.
Otofuji, Y., T. Itaya, H. C. Wang, and S. Nohda (1995), Palaeomagnetism and K-Ar dating of Pleistocene volcanic rocks along the Altyn Tagh Fault, northern border of Tibet, Geophys. J. Int., 120, 367–374.
Roger, F., N. Arnaud, S. Gilder, P. Tapponnier, M. Jolivet, M. Brunel, J. Malavieille, Z. Q. Xu, and J. S. Yang (2003), Geochronological and geochemical constraints on Mesozoic suturing in East-Central Tibet, Tectonics, 22(4), 1037, doi:10.1029/2002TC001466.
Rumelhart, P., A. Yin, E. Cowgill, R. Butler, Z. Qing, and X. Wang (1999), Cenozoic vertical axis rotation of the Altyn Tagh fault system, Geology, 27, 819–822.
Sharps, R., M. McWilliams, Y. P. Li, A. Cox, Z. K. Zhang, Y. J. Zhai, Z. J. Gao, Y. A. Li, and Q. Li (1989), Lower Permian paleomagnetism of the Tarim block, northwestern China, Earth Planet. Sci. Lett., 92, 275–291.
Si, J. W., and R. Van der Voo (2001), Too-low magnetic inclinations in central Asia: An indication of a long-term Tertiary non-dipole field?, Terra Nova, 13, doi:10.1046/j.1365-3121.2001.00383.x.
Sobel, E. R., and N. Arnaud (2000), Cretaceous-Paleogene basaltic rocks of the Tuyon basin, NW China and the Kyrgyz Tian Shan: The trace of a small plume, Lithos, 50, 191–215. Sun, Z. M., Z. Y. Yang, J. L. Pei, T. S. Yang, and X. S. Wang (2006), New Early Cretaceous paleomagnetic data from volcanic and red beds of the eastern Qaidam Block and its
implications for tectonics of Central Asia, Earth Planet. Sci. Lett., 243, 268–281, doi:10.1016/j.epsl.2005.12.016.
Tan, X. D., K. P. Kodama, H. L. Chen, D. J. Fang, D. J. Sun, and Y. A. Li (2003), Paleomagnetism and magnetic anisotropy of Cretaceous red beds from the Tarim Basin, northwest China: Evidence for a rock magnetic cause of anomalously shallow paleomagnetic inclinations from central Asia, J. Geophys. Res., 108(B2), 2107, doi:10.1029/2001JB001608 Tarling, D. H., and F. Hrouda (1993), The Magnetic Anisotropy of Rocks, Chapman & Hall, London.
Tauxe, L., and D. V. Kent (2004), A simplified statistical model for the geomagnetic field and the detection of shallow bias in paleomagnetic inclinations: Was the ancient magnetic field dipolar?, in Timescales of the Paleomagnetic Field, edited by J. E. T. Channell, et al., Geophysical Monograph, 145, 101–116.
Thomas, J. C., H. Perroud, P. R. Cobbold, M. L. Bazhenov, V. S. Burtman, A. Chauvin, and E. Sadybakasov (1993), A paleomagnetic study of Tertiary formations from the Kyrgyz Tien-Shan and its tectonic implications, J. Geophys. Res., 98, 9571–9589.
Van der Voo, R. (1993), Paleomagnetism of the Atlantic, Tethys and Iapetus Oceans, 411 pp., Cambridge Univ. Press, Cambridge.
Wang, B., Y. Chen, S. Zhan, L. S. Shu, M. Faure, D. Cluzel, J. Charvet, and S. Laurent-Charvet (2007), Primary Carboniferous and Permian paleomagnetic results from the Yili Block (NW China) and their geodynamic implications on the evolution of Chinese Tianshan Belt, Earth Planet. Sci. Lett, revised.
Westphal, M. (1993), Did a large departure from the geocentric axial dipole hypothesis occur during the Eocene? Evidence from the magnetic polar wander path of Eurasia, Earth Planet. Sci. Lett., 117, 15–28.
Xinjiang Bureau of Geology and Mineral Resources (1993), Regional Geology of Xinjiang Uygur Autonomous Region, 841 pp., Geological Publishing House, Beijing.
Yang, Z. Y., M.-G. Moreau, H. Bucher, J.-L. Dommergues, and A. Trouiller (1996), Hettangian and Sinemurian magnetostratigraphy from Paris Basin, J. Geophys. Res., 1012(B4), 8025–8042, doi:10.1029/95JB03717.
Figures
Topographic map of central Asia and a simplified geologic map of Xinjiang Province [after Xinjiang Bureau of Geology and Mineral Resources, 1993]
Figure 2. Upper Jurassic to Neogene paleomagnetic poles from central Asian red beds [from Gilder et al., 2001]. (a) Poles from individual studies (sampling sites represented as stars on map). (b) Paleomagnetic poles from Figure 2a are rotated about a small circle centered on their sampling sites. Mean poles are calculated at 21.1, 44.2, 72.8, and 119.5 Ma and
compared against the synthetic apparent polar wander path for Eurasia [Besse and Courtillot, 2002]. Note the remarkable long-term stability in paleolatitude, expressed as a constant distance between the poles and the sampling sites.
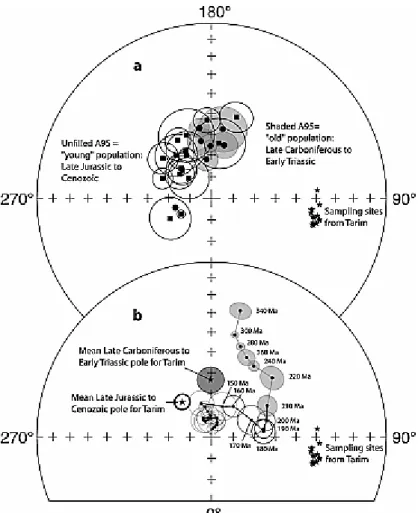
Figure 3. Paleomagnetic poles from Tarim (data from Table 1). (a) Poles from individual studies. (b) Mean paleomagnetic poles from Tarim for the Late Carboniferous to Early Triassic (“old” population) and for the Late Jurassic to Present (“young” population). The small circle intersection method was used for the latter. Apparent polar wander path for Eurasia is from Van der Voo [1993] for >210 Ma poles; the rest are from Besse and Courtillot [2002]
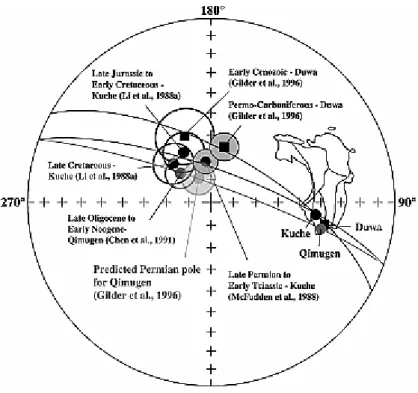
Figure 4. In two cases where paleomagnetic samples were collected from “young” (Late Jurassic to Upper Cenozoic) and “old” (Permo-Carboniferous) rocks in the same area, a great circle passes through both the young and old poles and the sampling site. This could imply that no relative rotation occurred between the time represented by the old and young rocks collected at the same place. Moreover, declination differences from one place to another in Tarim would be due to local vertical-axis block rotations occurring approximately in the past 20 million years [after Gilder et al., 1996]. The predicted Permian pole for Qimugen was calculated by drawing a great circle through the Late Oligocene to Early Neogene pole of Chen et al. [1991] and the sampling site, then moving along the great circle 9° closer to the sampling site. The A95 of the predicted Permian pole is the mean A95 of the “old” population
Figure 5. Paleomagnetic poles from Tarim averaged in times ranging from the Late
Carboniferous to the Early Triassic (the “old” population), from the Early to Middle Jurassic, and from the Late Jurassic to the Cenozoic (the “young” population) [from Gilder et al., 1996]. Because the difference in mean poles between the “old” and “young” populations could be due to inclination shallowing and differential rotation, and because the mean Early to Middle Jurassic pole is indistinguishable from both, it is possible that there has been no polar wander of Tarim since the Late Carboniferous. The Eurasian apparent polar wander path is from Besse and Courtillot [1991] and Van der Voo [1993].
Figure 6. Simplified geologic map of the Qimugen area [after Xinjiang Bureau of Geology and Mineral Resources, 1993] (see Figure 1 for regional map).
Figure 7. Simplified geologic map of the Kuche area [after Xinjiang Bureau of Geology and Mineral Resources, 1993] (see Figure 1 for regional map).
Figure 8. Thermal vector demagnetization diagrams of Permian red beds from the Qimugen section (in tilt corrected coordinates). Site and sample numbers are indicated on each figure. Temperature steps are in degrees Celsius.
Figure 9. Stereonet plots of the site mean directions of Permian red beds from the Qimugen section (data from Table 2). The left side is the north and downward directed (in situ coordinates) component while the right side is the south and upward directed (tilt corrected coordinates) component.
Figure 10. Thermal vector demagnetization diagrams of Middle Jurassic limestones from the Kuche section (in in situ coordinates): (a) Alternating fields in milliTesla; (b-h) temperature steps in degrees Celsius. Site and sample numbers are indicated on each figure.
Figure 11. Stereonet plots of low and high temperature component site mean and individual sample directions of Middle Jurassic limestones from the Kuche section (data from Table 2)
Figure 12. Scanning electron microscope images of the Middle Jurassic Qiakemake
Formation limestones from Kuche. (a) Scanning electron image of sample 963B (site c019). (b) Close-up view of area shown in Figure 12a. Energy dispersive spectroscopy (EDS) of C0963B-01 has the following weight percentages expressed as oxides: Fe (86.43%), Mn (2.81%), Ca (0.94%), S (0.95%), Si (6.48%) and Mg (2.40%); that of C0963B-02 has Fe (93.77%), Mn (0.03%), Ca (0.95%), S (0.34%), Si (3.98%) and Mg (0.92%). The Fe-rich oxide zones follow the margins and are not truncated, suggesting this material either replaced CaCO3 or filled pre-existing pore spaces. The low aspect ratios of the zoned iron oxides may
suggest that they formed soon after deposition, likely during diagenesis. C0963B-03 yields a composition of rutile (TiO2) while C0963B-04 yields CaCO3. (c) Scanning electron image of
sample 844B (site c006) showing a detrital, Fe-pure magnetite grain embedded in a rounded quartz grain. (d) Scanning electron image of sample 905B (site c013) showing barite filling a stylolite in calcium carbonate. No iron oxides were observed in this sample.
Figure 13. Thermomagnetic diagrams for three Middle Jurassic Qiakemake Formation limestones; sample name and site number are shown on each figure.
Figure 14. Anisotropy of magnetic susceptibility (AMS) data for 56 samples from the Middle Jurassic Qiakemake Formation carbonates. k1, k2 and k3, are the maximum, intermediate and minimum anisotropy axes, respectively, in in situ (a) and tilt corrected (b) coordinates. Large symbols in the stereonet plots represent the mean directions with the uncertainties [Jelinek, 1978]. (c) Flinn [1965] diagram. (d) Diagram plotting the shape factor (T) versus the corrected degree of anisotropy (P′) [Jelinek, 1981].
Figure 15. Paleomagnetic poles from the Tarim Basin. Gilder et al. [1996] predicted that the Permian pole from Qimugen would lie at 78°N, 208°E (A95 = 7.3°). The observed Permian
pole from Qimugen (this study) lies within 95% confidence limits of the predicted pole. The basis for the prediction was that (1) no rotation occurred in rocks for the same section since the Upper Carboniferous, although local vertical axis block rotations may have occurred between localities and (2) the Cretaceous and Cenozoic poles were affected by inclination shallowing, thus displacing them farther from the sampling site than expected.
Figure 16. Paleomagnetic poles from the Kuche region (data from Table 1). Cretaceous and older sites are located closer to the Tianshan Mountains than the Cenozoic sites. The
Cretaceous and older poles lie on the same great circle path that passes through the sampling sites. Charreau et al. [2006] collected samples in the anticlines related to more thin-skinned style of deformation in the fold and thrust belts within the foreland basin. Section B of Huang et al. [2006] lies closer to the Tianshan than Section A. Huang et al. [2006] argued that the rotation within and between the two sections was progressive. However, an anticline separates the two sections, making it also plausible that the relative rotation between the two is due to a differential vertical axis block rotation whose age would be younger than ~5.5 Ma. Points representing the poles from Charreau et al. [2006] and Section A of Huang et al. [2006] are larger than the uncertainties (A95).
Figure 17. The mean Late Carboniferous to Early Triassic pole and the mean Late Jurassic to Cenozoic pole, together with Middle Jurassic paleomagnetic poles from individual studies from Tarim (data from Table 1). The Eurasian apparent polar wander path (APWP) with open or no A95 and with shaded A95 are from Besse and Courtillot [2002] and Van der Voo [1993],
respectively. The Middle Jurassic spans from 159 to 180 Ma according to the Geological Society of America [1999] timescale or from 161.2 to 175.6 Ma from Gradstein et al. [2004].
Figure 18. Paleogeographic reconstructions of the major Asian blocks in the Middle Jurassic. The difference between the models is the choice in poles for the Eurasian plate. Figure 18a uses the Eurasian reference pole from Besse and Courtillot [2002]. Figure 18b uses the Middle Jurassic reference pole from Tarim (this study) with Tarim fixed to Eurasia.
Abbreviations for tectonic units (using present-day boundaries) are: Eur, Europe; Sib, Siberia; Kaz, Kazakhstan; IND, India; Mon, Mongolia; NCB, North China Block; SCB, South China Block; Ta, Tarim; Jun, Junggar. Rotation parameters and poles for Gondwanaland, Mongolia, the NCB and SCB are from Besse and Courtillot [2002] and Gilder and Courtillot [1997]. A discussion on the Early Jurassic reconstruction and details on the Tethyan blocks (not shown here) are given by Roger et al. [2003].
Tables
Table 1. Carboniferous to Present Paleomagnetic Poles From Tarima
Age Lat. Site Lon. Site Pole Lat. Lon. APole 95 (dm/dp) N Reference
3.3–1.1 Ma 39.8 76.2 73.9 297.5 1.9 258 s J. Chen et al., 2002 12.6–5.2 Ma 41.9 83.3 72.5 284.5 1.4/2.2 406 s Charreau et al., 2006 16.5–5.7 Ma 42.0 83.3 75.5 285.1 2.2 44 L Huang et al., 2006: Section A 29.0–15.5 Ma 42.0 83.3 73.0 242.2 73.0 30 L Huang et al., 2006: Section B N1 38.5 80.5 58.5 210.5 5.9 30 L Dupont-Nivet et al., 2002
E3-N1b 38.5 76.4 71.2 226.7 6.7 9 L Chen et al., 1991
E3 38.1 76.4 66.8 210.5 3.4/5.9 ms Rumelhart et al.,
1999
E3 39.2 94.3 63.9 219.7 9.8 6 L Y. Chen et al., 2002
E-N? 38.1 86.6 75.8 229.5 9.6 7 L Y. Chen et al., 2002d
E2 37.1 78.4 65.3 248.3 4.8/9.0 ms Rumelhart et al.,
1999
E1-2 41.6 83.5 68.4 296.0 9.7 10 L Fang et al., 1998e
E1v 40.2 75.3 49.9 162.9 7.4 20 L Huang et al., 2005
E1 37.0 79.0 58.1 202.0 12.7 5 L Gilder et al., 1996 K2 38.1 76.4 71.4 233.6 6.8/11.6 ms Rumelhart et al., 1999 K2 42.0 81.6 64.6 208.9 9.0 6 L Li et al., 1988a K 39.5 75.0 70.1 225.8 7.0 18 L Chen et al., 1992 K 42.1 83.2 60.5 230.7 7.2 21 L Tan et al., 2003 K1 40.2 75.3 53.2 183.4 6.1 5 L Gilder et al., 2003 K1v 40.2 75.3 64.1 172.1 12.0 13 L Gilder et al., 2003 J3 to K1 42.0 81.6 64.6 208.9 9.0 6 L Li et al., 1988a J2 40.2 75.3 54.0 188.3 6.8 9 L Meng et al., 1998 J2 42.1 83.2 75.7 198.0 8.1 6 L This study
P2 to T1
& 42.1 83.3 71.8 187.6 5.5 16 L McFadden et al., 1988
P2 39.9 78.9 65.6 181.2 3.9 21 L Li et al., 1988b C3 to P2 40.6 79.3 57.1 170.7 11.0 3 S Sharps et al., 1989 P2 40.8 79.8 62.9 190.7 6.3c 24 L Cheng et al., 1983 P1 40.8 79.8 56.5 190.1 4.6 26 L Bai et al., 1987 C3 to P2 37.0 79.0 64.6 166.5 6.3 15 L Gilder et al., 1996 P1-2 38.4 76.4 85.0 199.4 12.4 8 L This study
aAbbreviations are: Lon., longitude (°E); Lat., latitude (°N); age of magnetostratigraphy
sections put in absolute time when possible; N, Neogene; E, Paleogene; K, Cretaceous; J, Jurassic; T, Triassic; P, Permian; C, Carboniferous; 1, Early; 2, Middle; 3, Late (2, Late for the Cretaceous and Permian); v, data obtained from volcanic rocks; dp, dm and A95, the radius
that the mean pole lies within 95% confidence limits; N, number of localities (L), samples (s), or studies (S) used to determine pole.
bAge of beds was originally reported as Cretaceous– they are now known to be
Oligo-Miocene.
cEstimated.
dSupercedes Rumelhart et al. [1999].
eAge constraints of the strata sampled by Fang et al. [1998] were never provided; the site
longitude and latitude listed in the publication is likely misplaced as it lies in the Takalamagan desert, and we thus neglect this pole from consideration. Results from volcanic rocks reported by Otofuji et al. [1995] not included because they do not average secular variation.
Table 2. Paleomagnetic Data From This Studya
Permian: high temperature component paleomagnetic data from the Qimugen section Site n/N Dg Ig Ds Is k α95 Strike Dip Slon Slat
c950 8/8 206. 3 −50. 6 153. 9 −62. 6 110. 4 5.3 162.1 34. 0 76°21′49.0 ′′ 38°24′12.0 ′′ c951 8/8 202.2 −40. 1 166. 9 −54. 1 38.9 9.0 162.1 34.0 5 m below c950 c952 0/8 162.1 34.0 76°21′48.9′′ 38°24′11.7′′ c953 5/9 72.1 −39. 0 177. 2 −47. 4 39.5 12. 3 307.7 80. 5 120 m east of c952 c954 5/8 72.1 −39.0 177.2 −47.4 39.5 12.3 307.7 80.5 20 m below c953 c955 4/8 71.8 −73. 7 223. 6 −57. 1 54.6 12. 5 323.1 48. 0 76°22′41.1 ′′ 38°24′32.5 ′′ c956 7/7 89.2 −77. 6 195. 6 −53. 7 42.2 9.4 303.1 42. 0 10 m above c955 c957 8/8 114.2 −82.6 188.1 −51.9 68.0 6.8 290.2 37.0 10 m above c956 c958 7/8 213. 5 −18. 4 198. 2 −51. 1 40.8 9.6 149.2 38. 3 150 m east of c957 mean 8/9 147. 6 −72. 7 3.9 32. 9 Site means
mean 8/9 185.3 −54.6 39.6 8.9 Site means
Middle Jurassic: high temperature component paleomagnetic data from the Kuche and Yaha river valleys
Site n/N Dg Ig Ds Is k α95 Strike Dip Slon Slat
c006 1/9 88.5 77. 0 83°22′07.8 ′′ 42°06′47.3 ′′ c007 6/9 194. 4 13.7 196.3 −43.0 38.0 11.8 98.6 57.0 5 m below c006 c008 2/7 99.5 57. 0 5 m below c007 c009 6/10 194. 6 5.5 202. 5 −60. 5 56.7 9.3 97.0 67. 0 10 m below c008 c010 4/9 202. 3 10.0 213. 0 −55. 2 164. 9 7.2 98.2 68. 0 10 m below c009
c011 0/9 92.6 68. 0 83°21′28.6′′ 42°07′01.5′′ c012 0/10 135.0 41. 0 83°21′33.5 ′′ 42°06′59.3 ′′ c013 3/10 91.3 73. 0 83°06′25.0 ′′ 42°08′31.1 ′′ c014 0/11 85.3 73. 0 20 m below c013 c015 4/10 185. 2 17.8 8.0 34. 6 variabl e 3 m below c014 c015 4/10 192. 0 −54. 9 36.4 15. 4 variabl e 3 m below c014 c015 A 3/4 182. 9 35.0 181. 3 −54. 8 25.4 25. 0 96.8 90. 0 15 m below c015 c016 1/6 87.8 81. 5 83°06′52.4 ′′ 42°08′28.2 ′′ c017 4/10 90.1 86. 0 5 m below c016 c018 8/8 189. 4 31.6 192. 4 −49. 4 81.1 6.2 89.9 82. 0 5 m below c017 c019 6/10 86.3 90. 0 10 m below c018 mean 6/15 191. 8 19.0 35.5 11.4 Site means mean 6/15 196. 0 −53. 4 87.1 7.2 Site means mean 26/13 2 192. 4
20.6 19.7 6.6 Best fit only
mean 26/13
2 196.9 −53.0 42.2 4.4 Best fit only
mean 48/13 2
190. 0
20.5 23.1 4.4 Great circles + Best fit
mean 48/13 2 193. 6 −53. 5
44.0 3.1 Great circles + Best fit aAbbreviations are: n/N, number of samples used to calculate mean direction/number of samples demagnetized– note that site mean directions are not listed when sample directions are based solely on great circle analyses; D, declination; I, inclination; g, in-situ (geographic) coordinates; s, tilt-corrected (stratigraphic) coordinates (at 100% unfolding); k, the best estimate of the precision parameter; α95, the radius that the mean direction lies within 95% confidence; strike is dip direction minus 90°; Slon and Slat, longitude and latitude of site.
![Figure 2. Upper Jurassic to Neogene paleomagnetic poles from central Asian red beds [from Gilder et al., 2001]](https://thumb-eu.123doks.com/thumbv2/123doknet/14792474.602010/19.892.106.524.100.762/figure-upper-jurassic-neogene-paleomagnetic-central-asian-gilder.webp)

![Figure 6. Simplified geologic map of the Qimugen area [after Xinjiang Bureau of Geology and Mineral Resources, 1993] (see Figure 1 for regional map)](https://thumb-eu.123doks.com/thumbv2/123doknet/14792474.602010/23.892.108.526.102.951/simplified-geologic-qimugen-xinjiang-geology-mineral-resources-regional.webp)
![Figure 7. Simplified geologic map of the Kuche area [after Xinjiang Bureau of Geology and Mineral Resources, 1993] (see Figure 1 for regional map)](https://thumb-eu.123doks.com/thumbv2/123doknet/14792474.602010/24.892.113.524.98.663/figure-simplified-geologic-xinjiang-geology-mineral-resources-regional.webp)