Ecometrics for Life Cycle Management
A Conflict Between Sustainable Development and Family Values?
David H u n k e l e rDepartment of Chemistry, Swiss Federal Institute of Technology, CH-1015 Lausanne, Switzerland Corresponding address: Prof. Dr. David Hunkeler; e-mail: [email protected]
Abstract
Metrics are a prerequisite for the successful monitoring and man- agement of progress toward goals. Within the context of sus- tainable development these "values" are stakeholder dependent with the interests of the individual, society, the environmental infrastructure and intergenerational liability differing signifi- cantly. These stakeholder priorities may also be mutually in- consistent or simultaneously unattainable. Therefore, a set of scale- and value-specific indicators will be required to represent the priorities of individuals, religions organizations, political and public interest groups, non-government organizations, firms and industry associations, as well as national and international in- stitutions. Restricting the number of ecometrics, or creating aggregated sustainability indicators, risks disenfranchisement and invalidation respectively.
Over the past three decades a series of microecometrics have been developed to account for the impact of human activity, technology or products over regional, national, and sub-conti- nental scales. These include life cycle energy consumption, de- materialization, waste minimization, as well as design for en- vironment and eco-efficiency indicators, the latter two combining technological or economic aspects respectively with environmental factors. Metrics which evaluate the impact of a service, or the utility provided l?y a product, are lacking. A series of global measures, or macroecometrics have also been defined and include the average annual temperature as well as atmospheric compositions and concentrations, sea level, and earth based resources such as topsoil quantities. The validity of microecometrics as measures of global phenomena can be established through life cycle impact assessments which evalu- ate the "system's" response to effects of products or services throughout their life cycle. However, the link between microecometrics and macroecometrics, their validity as indi- cators of sustainability, the subjectivity of sustainable devel- opment per se as a value, and the relationship of metrics and sustainable development with family values has not extensively been addressed. This paper summarizes recently proposed ecometrics, calls for the recognition of the subjectivity of indi- cators, the distinction between ecometrics used for internal cor- porate reporting and external decision making, and the estab- lishment of a representative multistakeholder debate. Keywords: Ecoindicators; environment; family values; inter- generational debt; life cycle assessment; sustainable develop- ment; values
Int. d. LCA 4 (5) 291 - 298 (1999)
9 ecomed publishers, D-86899 Landsberg, Germany
1 I n t r o d u c t i o n
1.1 S u s t a i n a b l e d e v e l o p m e n t is a v a l u e
The environment is a system whose complexity rivals argu- ably that of only the human physiology. One could, there- fore, question how one measures the environmental state or its "health". For example, are indicators required which reflect current conditions, such as global temperatures or concentrations, or will metrics with predictive powers, akin to a barometric readings, be definable? This debate is im- portant and fuels the current disagreements between stake- holders such as religious and environmental groups, since measurement and reporting influence behavior. These also represent values. Therefore, while the augmentation of the quality o f life o f individuals or families, the preservation of the well-being of the human population, the maintenance of an enviromnental infrastructure and intergenerational responsibility may be values which the majority of people, or societies, can agree to, their ranking will almost certainly be stakeholder dependent. Furthermore, although it has not been stated to date, sustainable development is a value and can be c o n t r a d i c t o r y with other beliefs. Therefore, the premise that sustainable development will, or "must", be beneficial for everyone, alienates some shareholder groups from participating in discussions. In this sense, the parties advocating sustainable development, through their norma- tive statements, have not yet acknowledged the right of other interest groups to their values.
One could question if, and if so how, one can measure the environment, the sustainability of species as well as indi- vidual and collective welfare, all the while recognizing that the very act of deciding what we measure is subjective. Related to this is the identification of the ultimate clients for such evaluations: families, societies, future generations, or the ecosystem, to name just a few. Therefore, it seems quite r e a s o n a b l e , and justifiable, t h a t the s t a k e h o l d e r groups w h o m have not participated, or been invited, into the sustainability debate (e.g. religious o r g a n i z a t i o n s ) , could feel that some of the environmental aims are con- t r a d i c t o r y with their fundamental beliefs. F u r t h e r m o r e , the values of certain religious and political organizations are not novel, or responses to the sustainability movement, but rather inherent in the founding documents and priori- ties of their respective nations.
1.2 Metric aggregation
One can argue that systems cannot reasonably be character- ized by a single index. Furthermore, aggregated metrics, while useful in actuarial, financial and, perhaps, quality of life com- putations, certainly cannot be unambiguously applied to multi- stakeholder decisions which involve the weighting of relatively uncertain qualitative information. Aggregated indices can also require periodic adjustment, as is seen in the changes in the typical "basket of goods" which constitute the basis for the consumer price index. Furthermore, composite indicators tend to be reflective of short term events and lack the proactive predictability one would desire in a sustainability metric. There- fore, without entering into the semantic ~ debate as to the ter- minology we are implying that a
set
of macroecometrics will be required to permit us to monitor the global environmental state. Microecometrics, while subjective, can nonetheless be validated through approaches such as life cycle assessment. They can also be used to adjust the behavior of the stake- holder group(s) subscribing to the metric.1.3 Sustainable development's lack of authority The question as to which stakeholders, if any, should be au- thorized to act for the public is at the heart of the politico- religious debate. Furthermore, the recent flurry of North American and European bank mergers have created interna- tional institutes with the same competitive potential as the majority of nations. If, as has been proposed, ecoindicators are used as credit screens, then there will exist a microeconomic risk that arbitrarily defined metrics, or values, can be used as filters which discriminate in terms of access to capital accord- ing to fundamental stakeholder belief. This is analogous to the macroeconomic cash crises facing developing countries as the World bank imposes its conditions, or values, in terms of social restructuring, on loan availability. It is unlikely that the access to credit will be decoupled from the values of the domi- nant, now global, institutions. However, this author is recom- mending that we recognize that this bias does exist and penal- izes certain stakeholders.
1.4 Economic and environmental time scales
The economy and financial markets can serve as examples of the utility, and daily functioning, of families of metrics. Cu- mulative measures such as the money supply indicate the amount of currency in various forms of liquidity in the economy while, on the firm level, ratios such as the price-to-earnings data are used to represent investor confidence and shareholder value. Metrics can also be redundant. For example, the Dow Jones Industrial Index, while biased to thirty large multina- tional manufacturing corporations, generally leads broader based indices such as the technology based NASDAQ and the entrepreneurial Russell 2000. In retrospect historical trends in the indices become obvious and, over the long term, the metrics often mimic each other. However, on a daily basis, the ap- proximate time constant for monetary activity, the indices of- ten move in opposite directions indicating that the means of
Various groups utilize "metric" or "indicator" as a suffix, with a variety of prefixes proposed, though "eco" is the most common.
averaging and data normalization are additional factors to consider in the establishment and validation of metrics, and may themselves be stakeholder dependent values.
One index of the environmental state is the global average temperature which shows, with the exception of a plateau in the mid-twentieth century, a steady rise over the past 150 years. However, annual fluctuations are significant and de- cades are required to observe trends. Nobel laureate Mario Molina has recently shown that the effect of the CFC pro- duction ban (Montreal Protocol, 1990) can now be atmo- spherically observed in terms of a plateau in CFC-11 con- centration [1]. He offers this as the first example that human activity can positively influence a measurable global envi- ronmental parameter. However, CFC-11 has a half-life of fifty years and the carbon cycle is orders of magnitude longer than the human life expectancy. Therefore, temporal aspects must be considered when one creates or averages ecometrics whether use for private or public sector decision making. There is also the issue of ecometric lag to consider
121
which represents the time required to incorporate environmental indices into routine statistical studies and reports.1.5 Ecometrics
This paper reviews the micro- and macro-ecometrics which have been recently proposed, or reevaluated. The list tabu- lated herein is a "snapshot" and one should recognize that microecometrics in particular will develop through a vari- ety of industrial, governmental and academic exercises over the next decade. Many of these are already in place includ- ing the World Business Council for Sustainable Develop- ment's Ecoefficiency work group
[31,
the President's Coun- cil on Sustainable Development (USA), the Ecometrics committee within the Japan Life Cycle Assessment society [4] as well as a series of Ecometrics workshops [51. Addi- tionally, internal corporate committees are evaluating eco- indicators for performance tracking and decision making as is evident from recent environmental reports.1.6 Subjectivity of metrics and stakeholder rights A collection of ecometrics is not controversial
per se,
al- though there is some judgment involved in scaling the index (e.g. per capita or per unit of GDP) as well as in the bound- ary definition. However, if an attempt is made to prioritize such a list, for example as a means to move toward sustain- able development, the result becomes subjective. The use of a metric also requires data collection, the act of which de- pends on stakeholder dependent interpretation and filter- ing. Therefore, we recommend thatthose working on defin-
ing potential ecometrics decouple themselves from the
sociopolitical process involved in determining the suitabil-
ity of indices.
One could also question if the freedom to define metrics, given the values they imbibe, should not be constitutionally recognized as are, in some countries, free- dom of religious preference and speech.1.7 Needs forecometrics
There is an immediate need for ecometrics in order to make corporate and macroeconomic allocation decisions as well as to communicate the progress towards "ecoefficiency" [6].
Furthermore, Total Quality Management, and commitments to continuous improvement, require metrics. ISO standard 14031 also addresses the evaluation of a firm's environmen- tal performance and their management system. What kind of indicators will those seeking international standardiza- tion use? Will they be flow based metrics or will they seek to measure impacts on local environmental regions? This pa- per will discuss recent progress in measuring the environ- ment, categorize the status of current projects in the ecometric area, and make recommendations as to underrepresented areas in the sustainability and ecometric debates.
2 D i s c u s s i o n
Tables 1 and 2 ( ~ Appendix) provide a non-exhaustive list of recently proposed ecometrics. Macroecometrics include those related to material and energy flows, climate, emis- sions, sociopolitical and population-based attributes and cost-based indices, while microecometrics have been defined over a more limited, generally product- or firm-based range, as will be detailed in the following section. It is evident from Tables 1 and 2 that the proposed indices can be measured. However, some data will require international aggregation while microecometrics are often based on confidential cor- porate information. Given the divergent continental prefer- ences voiced at the recent climate summit in Kyoto, and the consensus to reduce CO emissions over the coming 15 years [321, the organizatio~as which tabulate and validate ecometrics becomes an issue, as does the question of whom is responsible for this selection. Over the short term, while global trends are difficult to distinguish from data fluctua- tions, prompting debate over tendencies, the identification of the appropriate direction for improvement would be a significant step toward sustainable development. If we will need to establish valid metrics which locally monitor the environment and are valid indicators of global environmen- tal states, several caveats must also be considered. For ex- ample, in reporting one always seeks a balance between the volatility in the data versus the lack of short term tendencies in moving average based calculations. Furthermore behav- ior is modified by metrics and it has been established that the organization and screening of information influences perception of what is being measured [33]. Finally, it should be recognized that metrics are subjective and may have im- plicit, non-transparent, value systems.
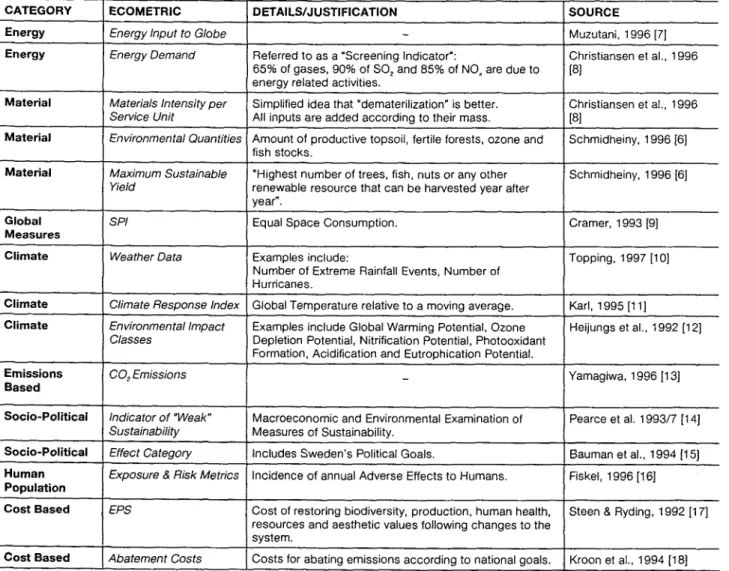
2.1 Macroecometrics
Table 1 (-+ Appendix) shows macroecometrics for global energy input and demand, material utilization, climate and weather-based events and overall emissions. These imply, either explicitly, or implicitly for climate-based metrics, that reduced consumption and dematerialization is, to some ex- tent, required for sustainability, though the thresholds for required action remain undefined. Furthermore, one cannot specify the system's (Earth's) proximity to these "limits". Even with these uncertainties, the aforementioned macro- ecometrics are the least subjective of the list in Tables 1 and 2
( ~ Appendix). In contrast, the sociopolitical measures can include national political goals in the calculation. Similarly,
the tabulation of annual "adverse" effects requires a defini- tion, or value system, which influences not only the calcu- lated metric but the data to be collected. The series of finan- cial based measures are unambiguous. However, if data collection is incomplete, their validity as an ecometric must be questioned. The same is also true of energy and material based ecometrics.
Macroecometrics can be established which qualitatively rep- resent global sustainability in a relatively unambiguous man- ner. These would include material and energy demand, con- centrations of certain species and climate data. However, the threshold levels which indicate above or below which action is required, and the intensity of an action 2 for a given effect should be debated, as they are now, in the arenas of national and international affairs .~. Nonetheless, the macro- ecometrics can be qualitatively linked to sustainable devel- opment. While this may seem a meek statement, the same cannot be claimed for microecometrics, where even the di- rection of the change is context dependent, as will be dis- cussed in the following section.
2.2 Linkages between micro- and macroecometrics An example of the difficulty in linking microecometrics to global environmental effects is the use of the percentage of recycled parts as a measure of the environmental burden of the automobile. Certainly, in a product where the use phase presents the dominant burden, an indicator which reflects production and end of life cycle (disposal) issues is, while perhaps still valid, likely not critical. Furthermore, even if the metric "percentage recycling" or another such as vehicle energy consumption is validated as representative of the overall burden of the automobile, it is the transportation service system burden which needs to be sustainable and not the vehicle as a product. Therefore, while automobiles are more energy efficient and of lighter weight then 40 years ago [2], the overall burden of the transportation infrastruc- ture has, arguably, increased considerably. Therefore, under such conditions, the microecometrics "percent recycled com- ponents" or "energy efficiency", while intuitively satisfy- ing, are actually metrics of non-sustainability. This example, while certainly not general, illustrates that service-based microecometrics should be considered as alternatives to ecoindicators of products.
The relationship between microecometrics, which are likely the most tempting to measure in the private sector, and macroecometrics, or global indicators, must be established. One method to accomplish this is life cycle assessment which could be employed as a means to validate proposed micro- ecometrics. For example, Sweden determined that it was less of an environmental burden to burn plastic drinking bottles than to wash and re-use them. In this analysis, life cycle
2 The preferred, individual or collective, response to a given metric is stake- holder value dependent.
3 The extension of macroecometrics to indices of sustainable development will require a definition of sustainability. Such a specific definition has, to date, been avoided. While this builds consensus towards sustainable devel- opment as a goal, it hinders the acceptance of action toward sustainability by some stakeholder groups.
energy and life cycle atmospheric emissions were the most burdensome and hence emerge as key microecometrics for this p r o d u c t line, or service (delivery of beverage). This im- plies that microecometrics wil I. be product or service spe- cific and require a systems-based valuation, and periodic re- evaluation.
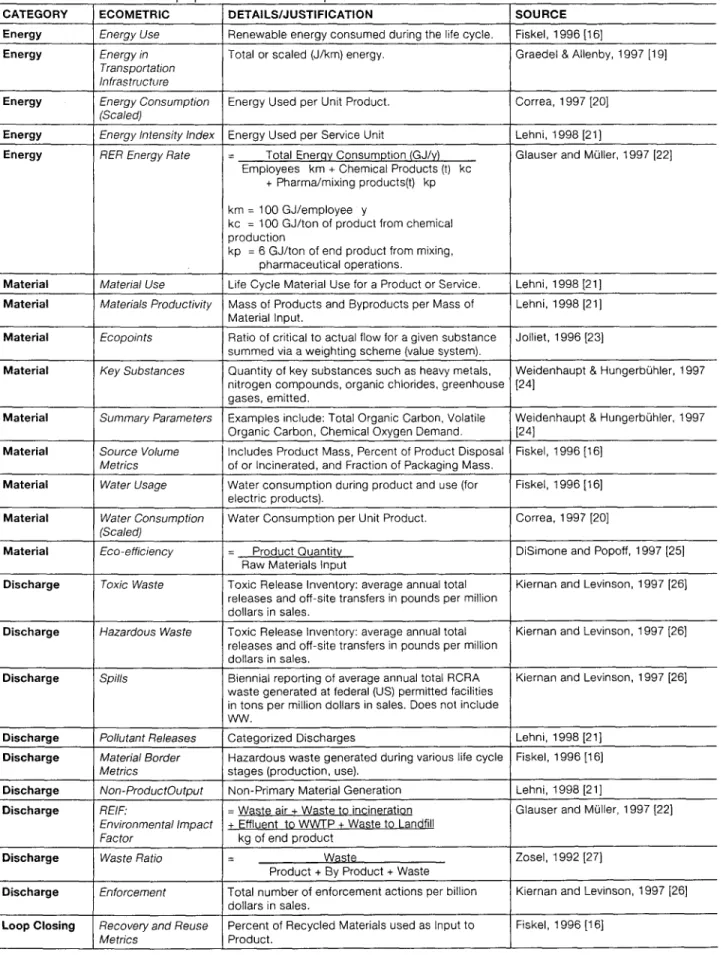
2.3 Microecometrics
C h a l l e n g e s in i n t e g r a t i n g e n v i r o n m e n t a l p e r f o r m a n c e across business functions have been encountered even by organizations pioneering the use of ecoindicators. Further- more, m a n y firms have chosen environmental performance indicators based on data which they are either required to collect, for example toxic release inventory, or are relatively easy to obtain. Indexing has also become "cultural" within enterprises and many companies find it useful to aggregate. Given these observations it is not surprising that micro- ecometrics (-~ Table 2, see Appendix) focus on material or energy reduction and reuse, closing the loop or product- based statistics 4.
Microecometrics are typically expressed in units of material or energy consumption, production, discharge, waste or byproducts, numbers of employees, cost and reuse/recycling statistics. The figures are, more often than not, scaled per unit of production or sales s. Clearly, while scaling is neces- sary for standardization, the choice of the denominator is a value judgment and will influence the validity of the metric. Furthermore, the decision as to what to include in the nu- merator as a "key substance" or component of Toxic Re- lease Inventory and "hazardous" waste is also subjective, even if established by multistakeholder committees ~. None- theless, if a sufficiently large number of micrometrics are tabulated, perhaps even using historic data to move back- ward in time, the validity of a micrometric for a product/ service, and as a measure of global sustainability could be determined. Clearly there is a tradeoff between simplicity and completeness [33]. Therefore, the recommendation is to accept that a specific microecometric is subjective, and to require it to be transparent and validated over the long term through life cycle assessments and correlations with macro- ecometrics. T h a t is, not to filter data, or metrics, rapidly but to accept time as a c o m p o n e n t of the debate. As stated in the introduction, one philosophy which could be adopted is the collection and tabulation of ecometrics such that gen- erations, and their stakeholder groups, present and future, can use the indicators which are deemed most appropriate
Microecometrics are proliferating much more rapidly than macroindicators. These will require validation if the metric is proposed for use for in multi- stakeholder decision making frameworks.
s Most of the proposed microecometrics are, de facto, extensions of life cycle inventory data. This implies that relatively significant time and human
r e s o u r c e commitments will be required in the data collection stage. This
may reduce the acceptance of metrics by some organizations, particularly those who employ streamlined life cycle management and design for envi- ronment approaches in place of more comprehensive life cycle assessments. Some investigators have called for ecometrics, and the data which com- prise the statistic, to be transparent specifying the forum/agency that has proposed averaged and normalized the indicator.
given the environmental crises which are prevalent, or an- t i c i p a t e d . In such a l i g h t , e c o m e t r i c s t a b u l a t e intergenerational currency or exchange. However, we are, at present, unable to establish a link between eco-efficiency and either macroecometrics or sustainability.
It is not the purpose of this paper to evaluate the metrics pro- posed. Those listed herein have, and likely will continue to, serve as a basis for the generation of modified indicators, as has been observed at recent workshops [4]. Can we say which ecometrics are needed to enable a family-based, collective, organizational or national movement toward sustainability? At this point perhaps not, at least uncontroversially. How- ever, it has been the opinion of various forums that filtering ecometrics at this point may be more harmful than beneficial. Until, and this may be decades, it can be agreed amongst the stakeholders which course of action will be required for suste- nance of the individual, family, population, environment, fu- ture generations, or any other value one may aspire to, our greatest service may be to elaborate, to the best of our abili- ties, a set of ecometrics which will likely increase in number with time, and to tabulate them. The following section dis- cusses current efforts toward ecometric resolution as well as the actors involved.
2.4 Current status
Overall, the efforts towards the development of metrics can be categorized as:
9 Microecometrics, or ecoefficiency indicators, are aimed at the profitability and environmental responsibility of institu- tions on a global scale and focusing on societal goals. ~ Macroecometrics measure long term global effects and are
oriented towards the environment and intergenerational re- sponsibility as a dominant value.
9 Sustainable development metrics, while not yet established, require thresholds to determine critical levels of global vari- ables. The emphasis is on intergenerational values. 9 Individual quality-of-life measures represent, in the 20th
century "developed" countries, a nuclear-family orientation. While qualitative and quantitative metrics exist to indicate trends in, for example, the standard of living, how these re- late to sustainabilit}; or even collective welfare and environ- mental maintenance, has not been discussed.
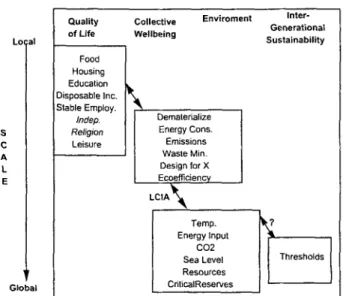
Figure 1 relates the scale to be considered (local to global) to the specific goal or value. A series of microecometrics have been developed for issues largely related to the collective well- being of the human species or society v. These indicators gen- erally correspond to industrial variables which can be collected, most readily, on a facility-specific or local basis. However, while micrometrics can be measured an life cycle impact assessment s is required to establish their validity as sustainable develop- ment indicators. In contrast macroecometrics which represent global attributes such as temperatures, compositions and con-
7 It has been argued that the maximization of the wellbeing of "society" is context dependent and that even the optimal tendency for metrics may differ in developed and "developing" regions [5].
Life cycle impact assessment is an established, though still evolving tool. Nonetheless, it provides a means to forge this local-global link.
centrations require long periods to measure and distinguish
from historical baselines. Furthermore, the critical level of the majority of macroecometrics have either not been determined or lack consensus. Therefore, macroecometrics are not pre- dictive. This, and the general tack o f validation of specific microecometrics are the forefront of the debate regarding
movement towards sustainability. It is this controversy which risks disenfranchising several interest groups which are gener- ally underrepresented in sustainability debates, particularly re- ligious organizations.
VALUE
Lo
Global
Quality Collective Enviroment Inter-
Generational of L i f e Wellbeing Sustainability Food Housing Education Disposable Inc. Stable Employ. Indep. Religion Leisure Dematedalize Energy Cons. Emissions Waste Min. Design for X Ecoemciency L C I A ~ Temp. I Energy Input C02
Sea Level Thresholds
Resources CriticalReserves
Fig. 1: Categorization of the scale and values involved in the ecometric and sustainable development debates. The question mark designates linkages which have yet to be established.
3 Conclusions
One may question who needs, or will require, ecometrics. It has been argued herein that individuals, societies, the environ- ment and various generations are all stakeholders. One may measure the environmental "health" through traditional macroecometrics (temperatures, compositions, concentrations) and these represent the current state of the ecosystem. How- ever, they are not predictive indicators. Links are also required which validate microecometrics and tie sustainability thresh- olds to global conditions. Therefore, until metrics can be vali- dated, the human population collectively runs the risk of mov- ing towards non-sustainability, even if sustainable development can be agreed to as a goal. The author of this paper recom- mends the following course of action:
1)The recognition of the inherent subjectivity of ecometrics. 2)The distinction between ecometrics used for "internal"
organisational accounting and ecometrics employed in "ex- ternal" multi-stakeholder decisions.
3)The acceptance of homogeneous stakeholder groups to de- fine internal ecometrics for their own uses.
4) The establishment of representative stakeholder debates and review processes for external ecometrics.
5)The validation of proposed external ecometrics using system- atic assessments across a products, technologies or service's life cycle.
4 References
I11 I~'IOLINA, M. (1998): Ozone and Climate Change. Keynote Address to the Alliance for Global Sustainability, Zurich, January 22
12 t GltaED~L, T.; ALLENBY, B. (1997): Industrial Ecology of the Automobile. Prentice Hall, Upper Saddle River, N]
[3] WBSCD Ecoefficiency Workgroup, Geneva, Switzerland; Marcus Lehni, Director
[4] Japan LCA Society Ecometrics Committee. For details, see, for example: M. Morimoto (1997): Int. J. LCA 2, 90; 2, 153 [5] Ecometrics'98 was the first in an annual series of multistake-
holder workshops: Ecometrics'98, January 18-19, 1998, Lausanne, Switzerland; D. Hunkeler, Organizer
[61 SCH.XUDHEiXY, 8.; Zo~aoquls, E (1996): Financing Change: The Financial Community, Eco-efficiency and Sustainable Devel- opment. MIT Press, Cambridge, MA
[71 MuztrrAxl, H. (1996): Open Energy and Closed Materials: Are they compatible in LCA? Proceeding of the 2nd Interna- tional Conference in Ecobalances, Tsukuba, Japan, p. 141 18J CulusTiaXsF.x, K. et al. (1996): Simplifying LCA: Just a Cut?
SETAC Europe LCA Screening and Streamlining Working Group, Final Report
J91 CltaMEIt, J.; QU.&KEtL~aa% T., et. al. (I 993): Theory and Prac- tice of Integrated Chain Management. TNO Apeldoorn, The Netherlands
[101 Anon (1997): New Approach for Greenhouse Talks. Chemi- cal and Engineering News, p. 22., Sept. 22
I1 I I K,\at., T.R.; KNI(;HT, R.W.; EATHtI.IN(;, D.R.; QtJaYts R.G. ( 1995): Trends in US Climate During the Twentieth Century. Consequences, 1, 3
1121 Hrijus(;s, R.; GutNl@:, J.B.; Hul,t, rs, G.; l...XNt)Rt~llt~lt, R.M.; Ut)o Dr Hal-S, H.A.; Wt~(;t~Nt]{ St.tTSWINK, A.; ANSI-:MS, A.M.M.; E(;(;ri_s, P.G.; \ o x DuiN, R.; Dr GOIDI~, H.P. (1992): Environ- mental Life Cycle Assessment of Products - Guide & Back- grounds. Reprints No. 9266 & 9267, National Revise and Water Research Program NOH and Center of Environmental Science (CML), l.eiden
1131 YaMA(;tWA, Y.; NE(;tSlti, T. (1996): DAC-LCA-A Life Cycle Design Tool Enabling Designers to Simultaneously Evaluate Environmental Impacts and Assembly/Disassembly Ease. Pro- ceedings of the 2nd International Conference on Ecobalances, Tsukuba, Japan, p. 153
[141 PEARCE, D.\V.; ATKINSON, G.D. (1993): Captial Theory and the Measurement of Sustainable Development: An Indicator of "Weak" Sustainability. Ecological Economics 8, 103; Atkinson, G. D., Dubourg, R., Hamilton, K., Munasinghe, M., Pearce, D., Younc, C., (1997): Measuring Sustainable Development - Macroeconomics and the Environment. Cheltenham, UK, Edward Elgar
[15] BaUMaNN, H.; RYDBERG, T. (1997): A Comparison of Three Methods of Impact Analysis and Valuation. J. Cleaner Prod. 2,13
[16] FISKEL, J. (1996): Design for Environment: Creating Eco-Ef- ficient Products and Processes. pp. 77-99 McGraw Hill, New York, NY
[17] S'rEEN, B.A.; RYDiNO, S.O. (1992): The EPS Enviro-account- ing Method. IVL, G6teborg, Sweden
[18] KROON, P.; YBEaXta, J.R.; SLANINA, J.; ARENDS, B.G. (1994): Weighting Factors for Air Emissions. ECNR 94-006, Petten, The Netherlands
[19] GRAmEL, T.; ALLENUV B. (1995): Industrial Ecology. Prentice Hall, Upper Saddle River, NJ
[20] CORt~Ea, M.E. (1997):ConsejoEmpresarialColombiano para el Desarrollo Sostenible (CECODES), Draft Report
[21 ] LI:.HNI, M. (1998): State-of-Play Report of the World Business Council for Sustainable Development's Project on Eco-Effi- ciency Metrics and Reporting. Geneva, Switzerland 1221 Gt.^usrR, M.; MOLmq P. (1997): Eco-Efficiency: A Prerequi-
site for Future Success. Chimia 51,201
[23] JOt.LIE'r, O. (ed.) (1996): Impact Assessment of Human Eco- toxicity in Life Cycle Assessment. SETAC-working group on Impact Assessment in LCA, Toxicology Subgroup, 6th and Final Draft, 28/8
1241 WEIDENHAUPT, A.; HUNGERBOHLER, K. (1997): Integrated Prod- uct Design in Chemical Industry. A Plea for Adequate Life- Cycle Screening Indicators. Chimia 51,217
[251 DESIMoNr, L.; POt'OFF E (1997): Eco-Efficiency: The Business Link to Sustainable Development. MIT Press, Cambridge, MA [26] Klt:aNaN, M.J.; LEVINSON, J. (1997): Environment Drives Fi- nancial Performance: The Jury is In. Environmental Quality Management7, 1
[27J ZOSEL, T.W. (1992): Pollution Prevention Pans: The 3M Ap- proach. Proc. 1st International Congress on Environmentally-
Conscious Design and Manufacturing, Management Round Table, Boston
[281 S~GER, U. (1996): Managerial Issues in Closing the Loop. Business Strategy and the Environment 5,252
129]
MEYER, G.E. (1997): Adam Smith, the States and the Finan- cial Eco-Metric Imperative. Environmental Quality Manage- ment 7, 81[30] GOEDKOOe, M. (1995): Ecoindicator 95. Pr6 & DUISF Con- sultency, Amersfoort, NL
[31] Storebrand-Scuder Mutual Fund (see M. Lehni, ref. 21) [32] Kyoto Global Climate Conference (1997): Kyoto, Japan, De-
cember 8-12
[33] LARSON, T.J.; BkOWN, H.J. (1997): Designing Metrics that Fit: Rethinking Corporate Environmental Performance Systems. Environmental Quality Management 81, Spring
Received: March 17th, 1999 Accepted: June 2nd, 1999
A p p e n d i x
Table 1: Various macroecometrics proposed over the 1992-98 period
CATEGORY ECOMETRIC DETAILS/JUSTIFICATION SOURCE
Energy Energy Input to Globe - Muzutani, 1996 [7]
Energy Energy Demand Referred to as a "Screening Indicator": Christiansen et al., 1996
65% of gases, 90% of SO 2 and 85% of NO. are due to [8]
energy related activities.
Material Materials Intensity per Simplified idea that "dematerilization" is better. Christiansen et al., 1996
Service Unit All inputs are added according to their mass. [8]
Material Environmental Quantities Amount of productive topsoil, fertile forests, ozone and Schmidheiny, 1996 [6]
fish stocks.
Material Maximum Sustainable "Highest number of trees, fish, nuts or any other Schmidheiny, 1996 [6]
Yield renewable resource that can be harvested year after
year".
Global SPI Equal Space Consumption. Cramer, 1993 [9]
Measures
Climate Weather Data Examples include: Topping, 1997 [10]
Number of Extreme Rainfall Events, Number of Hurricanes.
Climate Climate Response Index Global Temperature relative to a moving average. Karl, 1995 [11]
Climate Environmental Impact Examples include Global Warming Potential, Ozone Heijungs et al., 1992 [12] Classes Depletion Potential, Nitrification Potential, Photooxidant
Formation, Acidification and Eutrophication Potential.
Emissions CO 2 Emissions _ Yamagiwa, 1996 [13]
Based
Socio-Political Indicator of "Weak" Macroeconomic and Environmental Examination of Pearce et al. 1993/7 [14]
Sustainability Measures of Sustainability.
Socio-Political Effect Category Includes Sweden's Political Goals. Bauman et al., 1994 [15]
Human Exposure & Risk Metrics Incidence of annual Adverse Effects to Humans. Fiskel, 1996 [16]
Population
Cost Based EPS Cost of restoring biodiversity, production, human health, Steen & Ryding, 1992 [17] resources and aesthetic values following changes to the
system.
Cost Based Abatement Costs Costs for abating emissions according to national goals. Kroon et al., 1994 [18]
Table 2: Various microecometrics proposed over the 1992-98 period
CATEGORY ECOMETRIC DETAILS/JUSTIFICATION SOURCE
Energy Energy Use Renewable energy consumed during the life cycle. Fiskel, 1996 [16]
Energy Energy in Total or scaled (J/kin) energy. Graedel & Allenby, 1997 [19] Transportation
Infrastructure
Energy Energy Consumption ' Energy Used per Unit Product. Correa, 1997 [20] (Scaled)
Energy Energy Intensity Index ' Energy Used per Service Unit Lehni, 1998 [21]
Energy RER Energy Rate = Total Ener,qy Consumption (G J/y) Glauser and MOiler, 1997 [22] Employees km + Chemical Products (t) kc
+ Pharma/mixing products(t) kp km = 100 G J/employee y
kc = 100 G J/ton of product from chemical production
kp = 6 G J/ton of end product from mixing, pharmaceutical operations.
Material Material Use Life Cycle Material Use for a Product or Service. Lehni, 1998 [21 ]
Material Materials Productivity ! Mass of Products and Byproducts per Mass of Lehni, 1998 [21] Material Input.
Material Ecopoints Ratio of critical to actual flow for a given substance Jolliet, 1996 [23} summed via a weighting scheme (value system).
Material Key Substances Quantity of key substances such as heavy metals, Weidenhaupt & HungerbQhler, 1997 nitrogen compounds, organic chlorides, greenhouse [24]
, gases, emitted.
Material Summary Parameters Examples include: Total Organic Carbon, Volatile Weidenhaupt & HungerbL)hler, 1997 , Organic Carbon, Chemical Oxygen Demand. [24]
Material Source Volume Includes Product Mass, Percent of Product Disposal Fiskel, 1996 [16] Metrics of or Incinerated, and Fraction of Packaging Mass.
Material Water Usage Fiskel, 1996 [16]
Material Material Water Consumption (Scaled) Eco-efficiency Toxic Waste Hazardous Waste Discharge Discharge
Water consumption during product and use (for electric products).
Water Consumption per Unit Product.
Product Quantity Raw Materials tnput
Toxic Release Inventory: average annual total releases and off-site transfers in pounds per million dollars in sales.
Toxic Release Inventory: average annual total releases and off-site transfers in pounds per million dollars in sales.
Correa, 1997 [20]
DiSimone and Popoff, 1997 [25]
Kiernan and Levinson, 1997 [26]
Kiernan and Levinson, 1997 [26]
Discharge Spills Biennial reporting of average annual total RCRA Kiernan and Levinson, 1997 [26] waste generated at federal (US) permitted facilities
in tons per million dollars in sales. Does not include WW.
i
Discharge Pollutant Releases Categorized Discharges Lehni, 1998 [21]
Discharge Material Border Hazardous waste generated during various life cycle Fiskel, 1996 [16] Metrics i stages (production, use).
Discharge Non-ProductOutput Non-Primary Material Generation Lehni, 1998 [21]
Discharge = Waste air + Waste to incineration Glauser and M011er, 1997 [22] + Effluent to WWTP + Waste to Landfill
kg of end product RE~F:
Environmental Impact Factor
Discharge Waste Ratio = Waste Zosel, 1992 [27]
Product + By Product + Waste
Discharge Enforcement Total number of enforcement actions per billion Kiernan and Levinson, 1997 [26] dollars in sales.
Loop Closing Recovery and Reuse Percent of Recycled Materials used as Input to Fiskel, 1996 [16]
Metrics I Product.
Table 2 c o n t ' d
CATEGORY ECOMETRIC DETAILS/JUSTIFICATION SOURCE
Financial Economic Metrics Life Cycle Cost Incurred by Manufacturer, or Life Fiskel, 1996 [16]
Based Cycle Cost Savings Associated with Design
Improvements.
Financial Life Cycle Profit Value chain over complete product life cycle. Steger, 1996 [28]
Based
Financial Environmental Risk Credit Rating (e.g. Moody's). Schmidheiny, 1996 [6]
Based Environmental risks could be incorporated into
credit ratings.
Financial Eco-Productivity Index Turnover per Input of Key Materials, Energy, Water Novo Nordisk
Based and Packaging
Financial Resource Productivity = (Economic Value Added)xProduct Life Sony Europe
Based Material (Consumed-Recycled) + Energy in
Production, Use and Recycling
Financial Cost-to-Durability = Purchase Price + Material Cost + Energy Use + Lehni, 1998 [21]
Based Ratio Disposal Cost per year of Product Life
Financial Value Added per Value Added to National GDP per unit of Water or Correa, 1997 [20]
Based Resource Unit Energy Consumed
Financial Variance in Profit Less environmentally burdensome firms tend to Meyer, 1997 [29]
Based have smaller quarterly and annual profit swings.
Aggregated Eco-indicator Numeric Valuation of Various Impacts ! Goedkoop, 1995 [30]
Indicators
Aggregated Sustainability Risk Rates Investment Risk according to the Potential for Storebrand, 1997 [31]
Indicators Index Global Warming, Ozone Depletion, Materials Intensity, Toxic Release, Energy Intensity, Water Use and Environmental Liabilities
T h e International Conference and Exhibition on Life Cycle Assessment:
Tools for Sustainability
9 Date: April 25-27, 2000
9 Location: Crystal City Hyatt, Arlington, Virginia, Washington DC Metro Area 9 Contact: [email protected]
Sponsored by the USEPA's National Risk Management Research Laboratory National Center for Environmental Research and Quality Assurance (USEPA)
Institute for Environmental Research & Education Environmental Quality Management Institute
LCA is being developed and applied internationally by corporations, governments, and environmental groups to incorporate environmental concerns into the decision-making process. It is being widely adopted as a means to evaluate commercial systems
and develop sustainable solutions.
Presentations and discussions during InLCA will focus on approaches that integrate environmental, economic, and social values for decision-making, with emphasis on LCA applications and case studies. The conference will bring together practitioners and
decision-makers, peakers will discuss how LCA can be used to: 9 c r e a t e marketing advantages
9 i m p r o v e environmental decision-making 9 s a v e organizations money
9 o r g a n i z e environmental management systems
9 m e a s u r e environmental performance and progress towards sustainability 9 c o m m u n i c a t e within and outside of organizations.
Fee:
$175 - Early Registration $200 - Registration after 2/14/00 $150 - Government and Students