HAL Id: insu-01570745
https://hal-insu.archives-ouvertes.fr/insu-01570745
Submitted on 31 Jul 2017
HAL is a multi-disciplinary open access
archive for the deposit and dissemination of
sci-entific research documents, whether they are
pub-lished or not. The documents may come from
teaching and research institutions in France or
abroad, or from public or private research centers.
L’archive ouverte pluridisciplinaire HAL, est
destinée au dépôt et à la diffusion de documents
scientifiques de niveau recherche, publiés ou non,
émanant des établissements d’enseignement et de
recherche français ou étrangers, des laboratoires
publics ou privés.
Paleomagnetic directions and K/Ar dating of 0 to 1 Ma
lava flows from La Guadeloupe Island (French West
Indies): Implications for time-averaged field models
J Carlut, X Quidelleur, V Courtillot, G Boudon
To cite this version:
J Carlut, X Quidelleur, V Courtillot, G Boudon. Paleomagnetic directions and K/Ar dating of 0 to 1
Ma lava flows from La Guadeloupe Island (French West Indies): Implications for time-averaged field
models. Journal of Geophysical Research : Solid Earth, American Geophysical Union, 1999, 105 (B1),
pp.835-849. �10.1111/j.1365-246X.1971.tb03616.x�. �insu-01570745�
JOURNAL OF GEOPHYSICAL RESEARCH, VOL. 105, NO. BI, PAGES 835-849, JANUARY 10, 2000
Paleomagnetic
directions and K/Ar dating of 0 to 1 Ma
lava flows from La Guadeloupe Island (French West
Indies)' Implications for time-averaged field models
J. Carlut,
t X. Quidelleur,
•'2 V. Courtillot,
l and G. Boudon
'•
Abstract.
Twenty-six
lava
flows
spanning
the last
million
years
were
sampled
in La Guadeloupe,
French
West
Indies.
Because
of the lack
of continuous
volcano-stratigraphic
sections
in La
Guadeloupe,
dating
is necessary
in order
to describe
the
temporal
evolution
of the geomagnetic
field in this time interval.
New K/Ar ages
ranging
from 50 ka to I Ma have
been
obtained
on
andesires
using
the Cassignol-Gillot
technique
at the
Universitd
Paris
Sud
- Institut
de Physique
du
Globe
de Paris
Orsay
laboratory.
Additional
flows
(with
K/At ages
obtained
using
the same
dating
technique)
were
also
sampled
for paleomagnetic
investigations.
More
than
200 samples
were
analyzed
using
both
alternating
field
AF and
thermal
stepwise
demagnetization
techniques.
Duplicate
samplings
of two flows
at three
different
sites
demonstrate
that
within-How
dispersion
is
negligible
for the andesitic
lava flows
sampled
in this
study.
Direct
comparison
with an earlier
paleomagnetic
study
performed
on the island
indicates
that,
for the three
investigated
flows,
modern
demagnetization
techniques
yield
much
better
defined
paleomagnetic
directions.
The Matuyama-
Brunhes
transition
was
recorded
in a three-flow
section
and
is dated
at 781 + 18 ka, in good
agreement
with other
recent
radiometric
age
determinations.
The mean
paleomagnetic
pole
calculated
from the 23 normal
polarity
flows
is indistinguishable
t¾om
geographic
north,
which
implies
that no significant
persistent
axial quadrupole
term can be identified
at this site for the last
million
years.
This result
contradicts
earlier
results
and has
important
implications
for models
of
the time-averaged
field (TAF). An Occam
algorithm
was used
to construct
a TAF model
from the
global volcanic database from the last 5 Ma. Substitution of the mean direction calculated from the
earlier
study
for the Lesser
Antilles
by our new mean
value
reduces
the quadrupole
term
by more
than 30•. This effect,
which
was produced
by changing
data
from a single
site, demonstrates
that
older
paleomagnetic
sites
may need
to be reinvestigated.
Furthermore,
it also
highlights
the
limitations
of TAF models
that
can
be inferred
from
paleomagnetic
databases
in their
present
state.
1. Introduction
The time-averaged geomagnetic field can be satisfactorily accounted for by a geocentric axial dipole [Courtillot et al., 1992], and second-order features can be resolved only with data of high quality and with well-distributed sites [e.g., Johnson and Constable, 1997; Carhtt and Courtillot, 1998]. Despite recent efforts to reanalyze paleomagnetic data from the last 5 Ma, many data sets that contribute to global databases require revision, and large geographic areas remain devoid of data that satisfy modern criteria [McEIhim:y and McFadden, 1997]. Limitations related to poor site distribution and resulting difficulties in identifying certain terms in time- averaged geomagnetic field (TAF) models have recently been
investigated by Carhit and Courtillot [1998]. These authors showed that, given the present site distribution in
• Laboratoire
de Pal6omagn•tisme,
lnstitut
de Physique
du Globe
de
Paris, Paris, France.
2 Laboratoire de Gdochronologie UPS - IPGP, Sciences de la Terre,
Universit• Paris Sud, Orsay, France.
3 Laboratoire
des
G6omat6riaux
et D•partement
de Volcanologie,
Institut de Physique du Globe de Paris, Paris, France.
Copyright 2000 by the Panerican Geophysical Union.
Paper number 1999JB900238.
0148-0227/00/1999JB900238509.00
paleomagnetic
databases
I¾om lava flows, only a 5%
persistent
axial quadrupole
term, superimposed
on the axial
dipole,
could
be resolved
for the TAF over
the last
5 Ma. Deep-
sea sediments
are not considered
because,
usually, only
inclination
is available
and because
the fidelity
of sedimentary
records has often been questioned. The time interval that is often used when studying the TAF is 0-5 Ma. This is because
biases
due to plate motions can be neglected,
and the natural
reinanent magnetization (NRM)is less likely to have been affected by overprints or remagnetizations. Three subdivisions of the data are often made, including data from
the Brunhes
chron
only, which
is the most
easily
recognized
in lava Ilow sequences,
and
from
normal
and
reverse
polarity
data
from
the whole
0-5 Ma interval.
However,
it would
clearly
be instructive
to investigate
geomagnetic
field features
for
data
from smaller
time intervals.
Unfortunately,
most studies
lack the necessary
high-quality
age determination
which would
allow more precise data selection.
The Caribbean
plate, and a wide surrounding
area, is
represented
in paleomagnetic
databases
by only a single
study
[Briden et al., 1979]. Numerous K/Ar dates obtained for most islands from the Lesser Antilles have demonstrated that a migration of volcanism occurred in the mid-Miocene from the
outer
volcanic
arc toward
the inner volcanic
arc (Figure
l a).
However,
the quality
of dates
obtained
for La Guadeloupe
Island has been questioned
[Blanc, 1983]. Individual
paleomagnetic directions should also be considered with836 CARLUT ET AL.: PALEOMAGNETISM AND K]AR FROM LA GUADELOUPE ISLAND
a)
20
ø
b)
/ / 15 ø- / /Puerto-Rico
Trench
... o•:•:,•"-'•'•.-.'.•:•½:,
artin •[lll•x•6o•.
NAM
• ""'"•' d -•'"" ' '••••: "•••••••.••.••olomew•' • ... • ... V" "•'"'-•• "•'••••••••- - - •N %. •:':':'":'::•:::::'• •::'* ' 74•*•:g}•[*)5•.:.- ":'•4-• •'
•'
...
'•
tigua
•• •
'
fiGuadelo•eM•O.•
•
:•"'•<• • ½::•' Martinique ... :•[• .•.. •' •. ...>/
295
o
300ø
\ \ \ \ :: • 1000 ß 900 ß '.v' ;* 600•'g
400500
300 200 140 100 80 60 40 20 [ ... j o gul gu33 u17 18gul
...
'
4 km
61ø45 61ø35 ' , g•
Chaine
de
Bouillante
(>700
ka)
•
LP
area
(650-400
ka)
Monts
Caraibes
(650-400
ka)
Grande
Decouverte
composite
volcano
(<200
ka)
Figure
1. (a) Map of the
Lesser
Antilles
arc which
was
built
by subduction
of the North
America
(NAM) plate
under
the Carribean
plate.
Locations
of the older
volcanic
arc (,OVA)
and
the younger
volcanic
arc (,YVA)
are
shown.
Shallower
bathymetry
is shown
in grey. (b) Enlargement
of the topographic
map (N. Feuillet,
personal
communication,
1998)
of the southern
part
of Basse
Terre,
in La Guadeloupe
Island,
French
West
Indies.
Paleomagnetic
sites
are shown
by open
triangles.
Triangles
with solid
dots
are dated
sites
with K/At
age
obtained
in this
study,
open
triangles
with dots
are sites
previously
dated
by Blanc
[1983].
Also
shown
are
838 CARLUT ET AL.: PALEOMAGNETISM AND K/AR FROM LA GUADELOUPE ISLAND
Entreprises cryogenic and JR5 spinner magnetometers were
used for the measurements. Three samples per flow were subjected to alternating field (AF)demagnetization, and three
to seven samples underwent thermal treatment. Stepwise
demagnetization, with no less than 10 steps, was used for each
sample. Evolution of the magnetization vector was scrutinized
using Zijderveld [1967] diagrams and primary NRM directions were determined using least squares principal component
analysis [Kirshvink, 1980].
Low-field susceptibility measurements were performed for
one sample in each flow using a Bartington Instruments MS2 susceptometer. During the course of thermal demagnetization, susceptibility measurements were performed on selected samples, in order to detect any mineralogical changes. No significant changes were observed, which indicate that no strong oxidation of Fe-bearing minerals took place during
thermal treatment. 4.2. K/Ar Procedure
Nine andesitic lava flows from Basse Terre have been K/Ar
dated in the UPS-IPGP geochronology laboratory at Orsay, France. The Cassignol-Gillot technique [Cassignol and Gi!!ot,
1982], which is based on an atmospheric argon comparison, was chosen because it allows accurate dating of young lavas and/or lavas with low radiogenic content [Gillot and Cornene, 1986]. Preliminary examination of petrographic thin sections validated the choice of selected samples. The low K content of plagioclase phenocrysts from calc-alkaline magmas of the Lesser Antilles arc, which probably arise from partial fusion of subducted hydrous oceanic crust, prevented dating of such phase [Blanc, 1983]. Early fractional crystallization of amphibole and plagioclase, followed by plagioclase, pyroxene, and Fe-Ti oxides, characterize the differentiation process of magmas from the geodynamic setting of the Lesser Antilles [Westercamp and Mervoyer, 1976; Brown et al.,
1977]. In order to avoid excess argon phenomena linked to crystallization of amphibole and plagioclase at depth, only the groundmass was kept for dating. Samples were crushed to a 250 - 400 gm size fraction and were ultrasonically cleaned for 1 hour in a 20% nitric acid solution. A magnetic separator was used, in order to remove Fe-Ti oxide rich phases, and then heavy liquids, in order to remove the early crystallizing phases from the microlithic groundmass which was used for both K and Ar measurements. K was measured by flame emission spectroscopy and was compared with reference values of MDO-G and ISH-G standards [Gi!!ot eta!., 1992]. Ar was measured with a mass spectrometer identical to the one described by Gi!iot and Coruette [1986]. The interlaboratory standard GL-O, with the recommended value of 6.679x10 •4
atom/g of 4øAr*
[Odin et al., 1982], was used
for 4øAr
signal
calibration. Typical uncertainties of 1% are achieved for the4øAr signal calibration and for the K determination.
The
uncertainty
on the 4øAr* determination
is a function
of the
radiogenic content of the sample. The detection limit of thesystem is presently of 0.1% of 4øAr*, which makes the
Cassignol-Gillot technique specially suitable for these samples. In order to avoid isotopic fractionation, no predegassing of the sample was performed. Decay constants and isotopic ratios of Steiger aud Jiiger[1977] were used.5. Results
5.1. Paleomagnetic Directions
The NRM intensity for most samples is of the order of 10
A/re. A low unblocking temperature, low coercivity overprint, probably held by multidomain magnetite grains, is easily
removed at 120 -200øC or by 10 mT. The magnetization remaining above 540- 575øC is, in most cases, negligible,
which indicates that titanomagnetite, with high unblocking
temperatures, is the main remanence carrier. Above 120 -
200øC (or above 10 mT), specimens exhibit simple linear on
demagnetization, and determination of the primary remanence directions is straightforward. Only three flows (GUI2, GU23, and GU32)did not yield reliable paleofield directions. Flow
GU32 shows evidence for an isothermal remanent
magnetization (IRM), probably due to a lightning strike (i.e., very high NRM intensity values that are easily demagnetized by AF treatment, while thermal treatment was inefficient). However, despite sampling across a wide area (about 30 m), no reliable mean direction could be determined after AF cleaning. Flow GU12 displays unstable behavior, probably due to high magnetic viscosity. Susceptibility values are significantly lower for this flow, which suggests the presence of multidomain titanomagnetite. Finally, flow GU23 seems to contain displaced blocks. Field observations indicated this possibility, which was subsequently confirmed by palcomagnetic measurelnents. Results from this flow were therefore discarded. Because of dense vegetation, outcrop visibility is often limited, and postemplacement fractures cannot always be detected in the field, but hopefully can be detected palcomagnetic analyses. Typical Zijderveld [1967] diagrams for normal and reverse polarity samples from the southern part of Basse Terre are shown in Figure 2. Palcomagnetic directions are reported in Table 1 and are shown in Figure 3.
5.2. K/Ar Results
5.2.1. Previous work. Briden et al. [1979] presented extensive K/Ar geochronological and paleomagnetic data from
the Lesser Antilles. There is a marked contrast between K/At
dates from the outer arc (from 38 to 10 Ma) and the inner arc
(less than 7.7 Ma). Fourteen whole rock K/Ar dates, ranging from 0.91 to 2.52 Ma, were reported for Basse Terre. Dates
obtained on andesitic flows from Monts CaraYbes and Chaine
de Bouillante are significantly older than those reported by Biattt' [1983]. This discrepancy can only be explained by potassium loss due to alteration processes leading to overestimation of the K/Ar ages. This hypothesis is supported by the poor correlation between the geomagnetic polarity of dated flows [of. Briden et al., 1979], when available, and a recent geomagnetic polarity timescale [Cande and Kent,
1995].
An important amount of geochronological data from Basse Terre has been reported by Blanc [1983]. Two different
methods were used. First, thermoluminescence dates of 140 +
14 ka and 244 _+ 18 ka were obtained on quartz from andesitic pumice layers of the Chai'ne de Bouillante and 108 + 10 ka for the early stage of the CVGD. Second, 14 K/Ar age determinations using the Cassignol-Gillot technique were
CARLUT ET AL.: PALEOMAGNETISM AND K/AR FROM LA GUADELOUPE ISLAND 839
TH
El-Down
Scale: le-1 A/m
NRlVI
GU01
w (;17) E Scale: Up AF Down e-1 Nm NRM M/Mmax 1.0 0.5 0.0 Mmax = 5.04e-1 Nm 100 200 300 400 500 600 TH w up I I E I Down Scale: leo Nm T (øC) Z (10 -5 SI)GU28
6OOO 5OOO 4OOO 3OOO 2OOO 1000 00
'"id6" fido'''
&d6"
e%o
T (øC) AF w s' ¸ Up ,7, C i E Down Scale: leo Nm NRM M/Mma• 1.0•- 4 Mmax = 1.81e 0 Nm ß ß ß , ß ß 0 100 200 300 400 500 600 Z (10 -5 SI) 35OO 3000 2500 2OOO 1500 1000 5OO 0
T (øC)
o'"i66"•66" •60" •66"•&•" •6o
T (øC)
Figure 2. Typical Zijde/'vehl [1967] diagrams (one with thermal and one with AF treatment) for normal and reverse polarity data (flows GU28 and GU 10, respectively). Solid symbols correspond to projections onto the horizontal plane, while open symbols are projections onto the vertical plane. Also shown for these two flows are the NRM intensity decay (M) normalized to the maximum value (M ... ), and changes of magnetic
840 CARLUT ET AL.: PALEOMAGNETISM AND K/AR FROM LA GUADELOUPE ISLAND
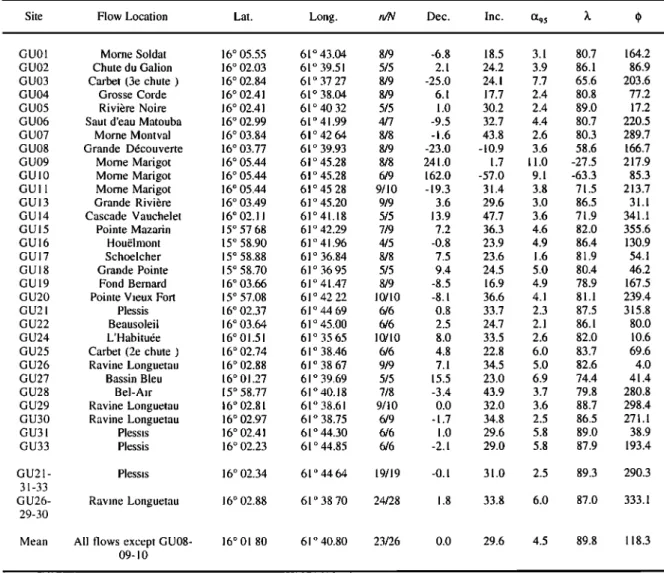
Table 1, Paleomagnetic Directions From Basse Terre
Site
Flow
Location
Lat.
Long•
n,W
Dec.
Inc.
ot0s
),.
q)
,
GU01 Morne Soldat 16 ø 05.55 61 ø 43.04 8/9 -6.8 18.5 3.1 80.7 164.2 GU02 Chute du Galion 16 ø 02.03 61 ø 39.51 5/5 2.1 24.2 3.9 86.1 86.9
GU03 Carbet (3e chute ) 16 ø 02.84 61 ø 37.27 8/9 -25.0 24.1 7.7 65.6 203.6
GU04 Grosse Corde 16 ø 02.41 61 ø 38.04 8/9 6.1 17.7 2.4 80.8 77.2 GU05 Rivi•re Noire 16 ø 02.41 61 ø 40.32 5/5 1.0 30.2 2.4 89.0 17.2 GU06 Saut d'eau Matouba 16 ø 02.99 61 ø 41.99 4/7 -9.5 32.7 4.4 80.7 220.5 GU07 Morne Montval 16 ø 03.84 61 ø 42.64 8/8 -1.6 43.8 2.6 80.3 289.7 GU08 Grande D½couverte 16 ø 03.77 61 ø 39.93 8/9 -23.0 -10.9 3.6 58.6 166.7
GU09 Morne Marlgot 16 ø 05.44 61 ø 45.28 8/8 241.0 1.7 11.0 -27.5 217.9 GUI0 Morne Marigot 16 ø 05.44 61 ø 45.28 6/9 162.0 -57.0 9.1 -63.3 85.3 GUII Morne Marigot 16 ø 05.44 61 ø 45.28 9/10 -19.3 31.4 3.8 71.5 213.7
GUI3 Grande Rivi•re 16ø03.49 61 ø 45.20 9/9 3.6 29.6 3.0 86.5 31.1 GUI4 Cascade Vauchelet 16 ø 02.11 61 ø 41.18 5/5 13.9 47.7 3.6 71.9 341.1 GUI5 Pointe Mazarin 15 ø 57.68 61 ø 42.29 7/9 7.2 36.3 4.6 82.0 355.6 GUI6 Hou•lmont 15 ø 58.90 61 ø 41.96 4/5 -0.8 23.9 4.9 86.4 130.9 GUI7 Schoelcher 15 ø 58.88 61 ø 36.84 8/8 7.5 23.6 1.6 81.9 54.1 GUI 8 Grande Pointe 15 ø 58.70 61 ø 36.95 5/5 9.4 24.5 5.0 80.4 46.2 GUI9 Fond Bernard 16 ø 03.66 61 ø 41.47 8/9 -8.5 16.9 4.9 78.9 167.5 GU20 Pointe Vieux Fort 15 ø 57.08 61 ø 42.22 10/10 -8.1 36.6 4.1 81.1 239.4 GU21 Piessis 16 ø 02.37 61 ø 44.69 6/6 0.8 33.7 2.3 87.5 315.8 GU22 Beausoleil 16 ø 03.64 61 ø 45.00 6/6 2.5 24.7 2.1 86.1 80.0 GU24 L'Habitu•e 16 ø 01.51 61 ø 35.65 10/10 8.0 33.5 2.6 82.0 10.6
GU25 Carbet (2e chute ) 16 ø 02.74 61 ø 38.46 6/6 4.8 22.8 6.0 83.7 69.6
GU26 Ravine Longuetau 16 ø 02.88 61 ø 38.67 9/9 7.1 34.5 5.0 82.6 4.0
GU27 Bassin Bleu 16 ø 01.27 61 ø 39.69 5/5 15.5 23.0 6.9 74.4 41.4 GU28 Bel-Air 15 ø 58.77 61 ø 40.18 7/8 -3.4 43.9 3.7 79.8 280.8
GU29 Ravine Longuetau 16 ø 02.81 61 ø 38.61 9/10 0.0 32.0 3.6 88.7 298.4 GU30 Ravine Longuetau 16 ø 02.97 61 ø 38.75 6/9 -1.7 34.8 2.5 86.5 271.1
GU31 Piessis 16 ø 02.41 61 ø 44.30 6/6 1.0 29.6 5.8 89.0 38.9 GU33 Piessis 16 ø 02.23 61 ø 44.85 6/6 -2.1 29.0 5.8 87.9 193.4
GU21- Piessis 16 ø 02.34 61 ø 44.64 19/19 -0.1 31.0 2.5 89.3 290.3
31-33
GU26- Ravine Longuetau 16 ø 02.88 61 ø 38.70 24/28 1.8 33.8 6.0 87.0 333.1
29-30
Mean All flows except GU08- 16 ø 01.80 61 ø 40.80 23/26 0.0 29.6 4.5 89.8 118.3
09-10
Column headings indicate site number, flow location, n/N (number of data used/total number of samples measured), Lat. (site latitude), Long. (Site longitude), Dec. (declination, in degree), Inc. (inclination, in degree), 595 (radius of the 95% confidence cone fi'om Fisher [1953] statistics), k (virtual geomagnetic pole latitude), and q• (virtual geomagnetic pole longitude). The mean directions obtained from three sites for the Piessis and Ravine Longueteau flows are indicated. The overall mean direction calculated from 23
out of 26 flows is also given.
obtained at the Centre des Faibles Radioactivitds (CFR)
laboratory, where the technique was first developed [Cassignol at•d Giilot, 1982]. An additional K/At date of 400 _+ 20 ka was obtained at the CFR laboratory for flow GU28 (P.-Y. Gillot, personal co•nmunication, 1998). Two flows from the recent Madeleine episode [Blanc, 1983] have been used for
comparison
with 14C
dating. Radiogenic
4øAr
values
that are
lower than the detection threshold suggest ages lower than 35ka for a scoriaceous flow and lower than 10 ka for a massive
flow. These
upper
bounds
agree
with the •4C
ages
of 10.5 +_
2.0
ka obtained for this episode [Paterne, 1980]. Thirteen out of 16 dated lava flows have been sampled for paleomagnetic investigation. The "Morne Goyavier" and "Tul" flows could not be accessed, and "Habitation Griveliare" displayed indications of fracture. The K/At ages of Blanc [1983] for which a paleomagnetic direction could also be determined arelisted in Table 2.
5.2.2. New age determinations. New K/At dating results are reported in Table 3. Potassium contents range from
0.6 to 1%, as expected for groundmass from calc-alkaline lavas. Apart from GU05, which is the youngest dated flow, and
GU08, which has a vitreous texture, all flows have radiogenic
4•'Ar
content
higher than 2%, allowing relatively
small age
uncertainties. Dated flows are preferentially located in theCVGD (Figure lb); the insights brought by these new ages
regarding formation of the recent volcanic complex will be discussed elsewhere. New (this study) and older [Blanc, 1983] ages are consistent, notably in the northwestern part of the studied area (GU09-13 and GU22-23), where only ages in the
700 - 900 ka range have been found. Indistinguishable ages of
746 _ 13 (Table 3) and 735 _ 47 ka [Blauc, 1983] have been obtained for GU22 and D1402a, respectively, which from field observations seem to be from coeval volcanic series. The age
of 445 _ 6 ka for GUI4, which is located within the GDVC,
appears to be rather old compared to GU05 (47 _+ 2 l ka), which is located only slightly higher in La Soufri•re massif stratigraphic sequence. However, the very small atmospheric contamination of this sample, as attested by the highest
CARLUT ET AL.: PALEOMAGNETISM AND K/AR FROM LA GUADELOUPE ISLAND 841
GU08
0
270
90
180
Figure 3. Stereoplot
(equal-area
projection)
of the mean
paleomagnetic
directions
obtained
for each
flow. Closed
and
open symbols
indicate
directions
in the upper
and lower
hemisphere,
respectively.
The directions
of the transitional
three flows are labeled (GU08, GU09, GU10).
percentage
of radiogenic
4øAt,
implies
that this age is reliable.
It is therefore probably related to an older volcanic series, as revealed by the age of 629 + 13 ka [Blanc, 1983] obtained for
the nearby GU06 flow.
All ages agree with the measured paleomagnetic polarity
[Cande and Kent, 1995], an observation that is also true for
previous age determinations [Blanc, 1983]. Flow GU08 displays a well defined direction with an anomalous
inclination of -11 ø (Table 1). The relatively low VGP latitude (59 ø) and the weak NRM argue for a transitional field direction.
The obtained age of 205 + 28 ka places this flow within the age interval estimated for the Pringle Falls excursion [Herrero-
Bervera et al., 1994; Guvodo and Valet, 1999]. A transitional
paleomagnetic direction was recorded by flow GU09. It is overlain by reversed (GU10) and normal (GUll) polarity flows. Age determinations (Table 3) indicate that the Matuyama-Brunhes (M-B) transition has been recorded in this sequence. The indistinguishable ages of 777 + 14 ka and 785 +
22 ka, obtained for GU09 and GUll, respectively, are in
agreement with a recent geomagnetic polarity timescale [Cande and Keut, 1995] and with other dating of this transition performed using the same dating technique [Valet et
al., 1999] on lavas from La Palma (Canary Islands).
6. Discussion
6.1. Volcanic Stages
A volcanic chronostratigraphy stands out from the present age data set (Tables 2 and 3). As already observed by Blanc [1983], ages obtained for lava flows from southern Basse Terre
decrease from north to south. The oldest ages, from about 1 to
0.75 Ma, are only found in the northwestern part of the area
and are associated with the Chaine de Bouillante volcanic
stage. The numerous ages found in the 800 - 750 ka interval could represent a burst of activity at the end of this phase. For
the 650 - 400 ka interval, lava emissions occurred both south of the Chatne de Bouillante (in Le Plessis area) and in the
Monts CaraYbes (southernmost part of Basse Terre). In between, in a wide east-west trending zone, approximately
located at 16øN latitude, there is no evidence for volcanic
eruptions during this interval. Only more recent lava flows have been reported there [Blanc, 1983]. This zone could correspond to a recent rift system, inferred from regional bathymetric analysis [Feuillet et al., 1997]. A period of relative volcanic quiescence is suggested by the lack of ages for the 400 - 200 ka interval, which following the above hypothesis, could be attributed to inland westward rift propagation. Finally, ages younger than 200 ka are only found within the composite volcano of La Grande Ddcouverte
(CVGD [Boudon et al., 1989]) and in the 16øN zone, where
recent activity is concentrated. In order to better constrain the different volcanic phases observed in southern Basse Terre, which is beyond the scope of the present paper, geochemical and petrological analyses have been undertaken. Further age
determinations are needed to demonstrate that the above
observations are not due to insufficient sampling. 6.2. Testing Within-Flow Dispersion
Magnetic variations recorded within a single flow have recently been reported. Up to 10 ø of directional changes have been measured by Rolph [1997] on investigation of the vertical variation of the paleomagnetic vector within two historical flows. Similar variations have been observed by Bohnel et al. [1997] on a Holocene flow that was also sampled along a vertical profile. However, t•w studies have been devoted to the exploration of spatial variations within massive flows exposed on a kilometer scale. In order to
quantify the directional within-site dispersion for andesitic
lava flows of La Guadeloupe, we sampled two representative
flows, "Le Piessis" (LP) and "Ravine Longueteau" (RL), at
three distinct locations (GU21-31-33 and GU26-29-30,
respectively). The 83 + 2 ka RL flow (Table 3) is centrally located within the CVGD, while the older LP flow (600 + 17 ka
[Blauc', 1983]) is located on the west side of the island and
belongs to the Chaine Axiale volcanism. The topography and position of sampling sites are shown in Figure 4. In both cases, sampling sites are at least 100 m apart. Indistinguishable results were obtained for the three locations from each flow with a confidence parameter (tx,)•) of 4.5 ø and 6.3 ø for the LP and RL flows, respectively. Although the mean directions are indistinguishable, the greater uncertainty observed for RL might be explained by the absence of Sun- azimuth orientation for this site, which is located deep in the rain forest. Considering each flow as a single site, all samples
from the three locations have been combined to calculate the
mean directions given in Table 1.
6.3. Comparison With Earlier Study
Three flows (GU15, GU20, and GU21) had already been sampled in the previous study of Briden et al. [1979]. Directions of remanent magnetization obtained for these three flows are reported in Table 4. These directions are quite different and statistically agree only because of the high
values of the 95% confidence levels associated with the
842 CARLUT ET AL.: PALEOMAGNETISM AND K/AR FROM LA GUADELOUPE ISLAND
Table 2. K/Ar Ages [Blanc, 1983] for Lava Flows From Basse Terre for Which a
Paleomagnetic Direction Could Also Be Determined
Site K, % Rad. 4øAr, % Age _ 1o ka Mean Age, ka
GU01 0.516 7.14 I 030 _ 30 8.36 1 017 _ 20 I 023 _ 25 GU03 1.006 3.76 132 _ 6 5.55 127 _ 4 129 _ 5 GU06 0.488 12.40 642 _ 13 17.10 6!6 _ 14 629 _ 13 GU07 0.735 11.50 630 _ 15 14.80 613 ___ 15 620 ___ 15 GU 12 0.711 2.74 855 _ 50 2.81 872 _ 50 863 _ 50 GUI3 0.733 12.92 777 _ 18 10.72 792 _ 20 784 _ 19 GUI5 0.408 3.48 555 _ 26 555 _ 26 GU 19 0.926 4.15 149 _ 6 3.54 137 _ 6 143 _ 6 GU20 0.644 5.61 469 _ 16 5.46 475 _ 16 472 _ 16 GU21 0.745 7.22 600___ 17 600___ 17
Column headings indicate site number, K (potassium concentration in percent), Rad. 4øAr (concentration of radiogenic 4øAt in percent), age and one sigma uncertainty (in ka). For each flow, weighted mean age and
uncertainty are also indicated.
Table 3. New K/Ar Ages Obtained in This Study
Site K, % Rad. 4øAr Age_ l c•, ka Mean age, ka
% x 10 TM atoms/g GU02 0.694 3.16 5.960 82 _ 4 4.55 5.532 76 _ 3 79 _ 3 GU04 0.651 2.41 5.311 78 _ 5 3.41 5.193 76 _ 3 77 _ 4 GU05 0.636 0.33 3.058 46 _ 21 0.35 3.232 49 _ 21 47 _ 21 GU08 1.063 I. 17 24.09 217 +_ 28 1.05 21.19 191 _ 28 205 _ 28 GU09 0.622 8.38 49.85 767 _ 16 11.94 50.91 783 _ 13 12.26 50.55 778 _ 13 777 _ 14 GUll 1.031 6.29 83.09 771 ___20 5.13 86.36 802 _ 25 785 _ 22 GU 14 0.867 23.08 40.07 442 _ 6 29.99 40.53 447 _ 5 445 _ 6 GU22 0.884 9.40 68.86 746 _ 15 13.46 68.98 747 _ 12 746_ 13 GU29 1.048 5.95 8.793 80 _ 2 5.54 9.428 86 +_ 3 83 _ 2
Colunto
headings
indicate
site
number,
K (potassium
concentration,
in percent),
Rad.
4øAt
(concentration
of radiogenic
4øAr
in
percent and number of atoms/g of radiogenic 4øAr), age and one sigma uncertainty (in ka). For each flow, weighted mean age and
CARLUT ET AL.: PALEOMAGNETISM AND K/AR FROM LA GUADELOUPE ISLAND 843
NW
100 m
GU30
Ravine Longueteau
SE
•
GU26
lat
= 16ø02.97
[
GU29
::•i•i•.
Ion
= 61ø38.75
]
I
i'•!ii'•i• 790 miiiii???:::•:....O...:
... lat
=
16ø02.88
I
::::?:::::::?:?:::::::::::::::::::::?:::?:::::::...`.:.•:..:...::::::::::::::::::::::::::::::::::: ... Ion = 61ø38 67 • 200 m 125 mDec = 358.3 ø Dec = 7.1 ø Dec = 0.0 ø Inc = 34.8 ø Inc = 34.5 ø Inc = 32.0 ø
c•95
= 2.5
ø
c•95
= 5.0
ø
c•95
= 3.6
ø
270Mean:
Dec
= 1.8
ø
•
Inc
= 33.8
ø
c•95
= 6.3 ø
90WSW
Le Piessis
NNE
GU31GU33
GU21
•
lat
Ion = 61ø44.30=
16ø02.41
80 mlat
= 16ø02.37
...
•::::::::*•*•:•:•*•:•:•*•.:..•.`..:•!•i•i..`.:•:`.:•::•:...•:..•.
""."•...-!i?:ii
1øn
=
61ø44'69
iii.:...•iii
"•'•••••":•':'"'
•'•"'"
'
'"'
:'""'
'•
'"'":"
'"'
'
lat
= 16ø02.23
50
m
lon= 61ø44.85 ...375 m 750 m
80 m
Dec = 357.9 ø Dec = 0.8 ø Dec = 1.0 ø Inc = 29.0 ø Inc = 33.7 ø Inc = 29.6 ø
o•95
= 5.8 ø
c•95
= 2.3 ø
o•95
= 5.8 ø
0 ß Dec = 359.9 ø Inc = 30.8 øc•95
= 4.5 ø
270 90Figure 4. Topography and position of sampling sites for the two flows used for testing within-flow dispersion. For each flow the mean direction and o•95 [Fisher, 1953] obtained for each of the three sites is given and is shown on a stereoplot.
844 CARLUT ET AL.: PALEOMAGNETISM AND K/AR FROM LA GUADELOUPE ISLAND
Table 4. Comparison of Paleomagnetic Directions Obtained for Three Flows From This Study and That of Briden et
al., [1979]
Flow Location Site n/N Dec. Inc. 0%5 Demag. Reference
,
Pointe Mazarin G23413 9 3 25 13.2 NRM Briden et al. [1979]
GU 15 7/9 7.2 36.3 4.6 AF and TH This study
Pointe Vieux Fort G23254 5 n.d. n.d. - Briden et al. [1979]
GU20 10/10 -8.1 36.6 4.1 AF and TH This study
Piessis G23201 5 87 23 48.5 NRM Briden et al. [1979] GU21 6/6 0.8 33.7 2.3 AF and TH This study
Column headings indicate flow location, Site number, n/N (number of data used/total number of samples measured), Dec.
(declination, in degrees), Inc. (inclination, in degrees), 0% (radius of the 95% confidence cone from Fisher [1953] statistics), Demag.
(demagnetization method). NRM indicates that no demagnetization was performed for these flows; AF, alternating field; and TH,
thermal.
between the two studies can be explained by the presence of undetected overprints, IRMs due to lightning strikes (in the case of GU15) and by the lack of demagnetization performed for these flows in the earlier study. For each flow, our
specimens display straightforward behavior, both in thermal
and AF stepwise demagnetization (Figure 5): viscous components are removed after the first l•w demagnetization steps. The lack of significant susceptibility changes during thermal treatment suggests the absence of dramatic changes in mineralogical properties. This comparison casts doubt onto the accuracy of individual paleomagnetic directions reported in the earlier study of Briden et al. [1979]. More generally, it clearly demonstrates the necessity of using only stepwise demagnetized samples when characteristics of the past
geomagnetic field are to be inl•rred.
6.4. Transitional Directions
Because andesitic volcanism is dominantly explosive,
sequences of superposed lava flows are rare in Basse Terre.
Only one site, exposed by quarry activity, allowed sequential
sampling. From the three superposed flows found at Morne Marigor, the lower flow (GU09) is transitional with a VGP latitude of-27.4 ø, the intermediate flow (GU10) has reversed
polarity and the upper flow (GUI 1) has normal polarity (Table
1). K/Ar dating (Table 3) demonstrated that the M-B transition has been recorded in this sequence, making this site the fifth
location on Earth were the M-B transition has unambiguously been identified in lava flow sequences. Each flow is 5 to 10 m
thick and is capped by 5 to 10 m of scoria. Possible remagnetization of the underlying reversed polarity llow by the upper normal polarity flow when it was still hot, a phenomenon sometimes observed in transitional records [Valet et al., 1998], is therefore not of concern here. Absolute paleointensity determinations (J. Carlut and X. Quidelleur, submitted manuscript, 1999) indicate that GUI0 is associated
with low paleointensity and, despite an apparently reversed
polarity direction, is well within the transition period [Linet al., 1994; Quidelleur and Valet, 1996].
6.5. Time Evolution
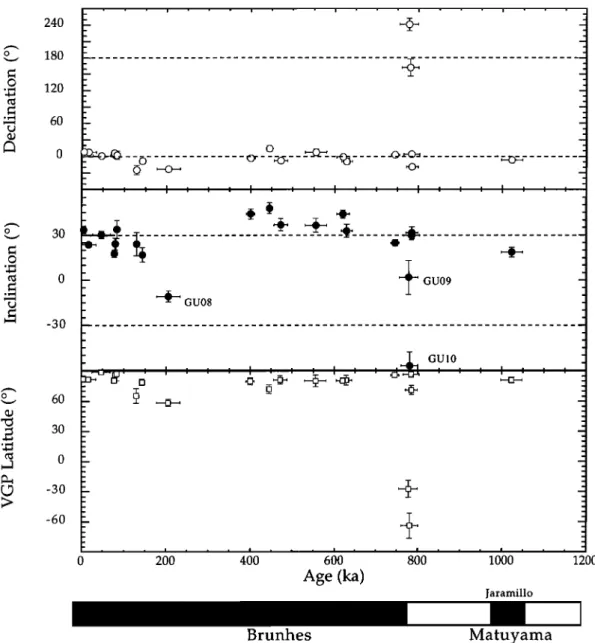
For the 20 dated flows, paleomagnetic directions recorded in Basse Terre have been plotted as a function of age (Figure 6). A
relatively good temporal distribution is observed within the
Brunhes chron, which indicates that secular variation has
largely been averaged in this study. Although declination
values oscillate around 0 ø, a striking difference can be observed in the inclination pattern between the intervals 700 - 400 ka and 200- 0 ka. In the former interval, all inclinations are above the expected value (under the axial dipole hypothesis) at this site, while in the latter interval, on average, they are shallower. This difference cannot be easily explained in terms of local tectonics because sites from the
700 - 400 ka interval are distributed on both sides and within
the CVGD rifting system [Feuillet et al., 1997]. Another argument that may rule out tectonic influence on these data is
the relatively low dispersion observed in paleomagnetic
directions, especially for inclination values. Such different
behavior suggests that it would be instructive to use sub-data
sets from different time intervals within the Brunhes chron to
compute TAF models. Signifi•,antly different mean directions
are evident for the two 800 - 400 and 400 - 0 time intervals at
Basse Terre. Overall dating in the global database is, unfortunately, not yet of sufficient quality to allow this. 6.6. Normal Polarity Mean
Twenty-six directions from independent
paleomagnetic
sites are shown on a stereoplot in Figure 3. All flows are of
normal
polarity
except
GUI0, GU09, and GU08. Although
its
VGP is not strongly transitional (58.7øN), the latter flow
represents an outlier from the overall mean distribution and, as
discussed
above, could be associated
with a geomagnetic
excursion.
The mean
direction
(D = 0.0
ø, I = 29.6
ø, or0.
• = 4.5 ø)
calculated
from the remaining
23 flows is indistinguishable
from the expected
axial dipole
field direction
at La Guadeloupe
Island (D = 0 ø, I = 29.7 ø, Table 1). Each flow direction has been successively removed from the data set in order to test thestability of this mean direction
using a Jacknife approach.
Nonsignificant
variations
result, making this mean direction
quite robust (mean declination ranges from -0.7 ø to 1.2 ø and
inclination from 28.7 ø to 30.2ø).
The angular standard deviation of poles (ASD) has often been used to monitor paleosecular variation [Cox, 1970]. The
predominant
feature associated
with this parameter
is the
significant increase observed as a function of site latitude, from about 12 ø close to the equator to more than 20 ø for
latitudes higher than 60 ø. The ASD value of 11.3 ø obtained at
La Guadeloupe is therefore in agreement with this overall
CARLUT ET AL.: PALEOMAGNETISM AND K/AR FROM LA GUADELOUPE ISLAND 845
w up AF
S ß o I E Scale: le 0 A/m ,NAF
E Down Scale' le 0 A/mGUI5
z
(10-5 SI)TH
3000
.w uop
2500
S •. = ___.j,•_•
•1. N
• • ...
•
2000
1500E IDown
1000
Scale: le 0 •m 500 0GU20
w E Down Scale: le 0 A/mUoP
TH
o.1(30
' 260'3•)0' 4•)0'560
• (øc) z (10 -5 SI)3000
[
2000
[
1500
[
lOOO
[
500
I
øo ' 160 ' 2bo
' 360
' 4bo' s60
T (øC)
w Uop AF
E Down Scale: le 0 A/mGU21
TH
w up S ' o 'oN. ' -_Q N'""o E Down Scale: le 0 A/m z (10-5 SI)3000 •
2500 "'- 2000 1500 1000 500O0 ' 1•)0' 2bO' 3•)0' 4bO'
5•)0
T (øC)Figure 5. Zijderveld [1967] plot of stepwise demagnetization of two samples per flow (one with thermal
and one with AF treatment) for the three sites also sampled by Briden et al. [1979]. See Figure 3 for convention of plots, and Table 4 for comparison of mean directions.
latitudinal band included in paleomagnetic data sets for the last 5 Myr, this value can be considered representative of the ASD at this site latitude (it is only slightly lower than the expected ASD of 13.5 ø [Quidelleur and Courtillot, 1996]). The wide range of ages available for this study, which are well
distributed within the 0- 1 Ma interval, rules out the
hypothesis of insufficient averaging of secular variation. Furthermore, it can be emphasized that, as the number of high- resolution paleomagnetic studies, such as the one presented
here, increase, ASD values tend to decrease.
The overall mean direction obtained at La Guadeloupe (this
study) for the 0- 1 Ma interval is therefore indistinguishable from that predicted by a centered axial dipole, and the corresponding mean pole located at the geographic pole.
Briden et al. [1979] reached a similar conclusion for their
whole Lesser Antilles dataset for the 0 - 10 Ma interval.
However, when only directions from the last 5 Myr are
considered, the mean pole calculated from their data shows a
far-sided effect [Wilson, 1970] amounting to about 4 ø . Although this result is not statistically different at the 95%
846 CARLUT ET AL.' PALEOMAGNETISM AND K/AR FROM LA GUADELOUPE ISLAND 240 180 120 60 -30 -60 _- o - -30
60
2 30 :- - - _ - 0 - _- 2 _- 2 . . i i i i i•
GU08
I I I [ I I I GU090 ' ' '60'
' '460'
' '60 ....
0'00'
200
Age (ka)
JaramilloBrunhes
Matuyama
Figure 6. Evolution of paleomagnetic declination, inclination, and VGP latitude as a function of time for the 20 dated flows discussed in this paper. The direction expected for the axial dipole field at La Guadeloupe is shown by dashed lines. A geomagnetic polarity timescale [Cande and Kent, 1995] is shown at bottom (black,
normal polarity; white, reversed polarity).
confidence level from the 0 ø far-sided effect that we obtain,
this difference has large implications when constructing a TAF
model.
6.7. Implications for TAF Models
The far-sided effect, first identified by Wilson [1970], has been attributed to the presence of a persistent axial quadrupole superimposed on the main axial dipole [Wilson, 1971]. A
persistent g'• (axial quadrupole Gauss coefficient) amounting to about 4-5% of the gi' axial dipole term has been reported in
most TAF studies covering the 0-5 Ma interval [i.e.,
Constable and Parker, 1988; Schneider and Kent, 1990;
McElhinny et al., 1996; Quidelleur and Courtillot, 1996]. The existence of persistent second-order (nonaxial) terms cannot be established from the present state of available databases [Carlut and Courtillot, 1998]. However, Carlut and Courtillot
[1998] also find robust evidence for a 5% g• term. These
conclusions have been reached from the analysis of directions
from lava flows from globally distributed paleomagnetic sites.
However, these data sets [i.e., Quidelleur et al., 1994] have a small number of low-latitude northern hemisphere sites,
particularly in a wide area around the Lesser Antilles, including
the central and southern Atlantic Ocean and South America.
This scarcity strongly enhanced the importance of the Lesser Antilles site. There is no general agreement regarding the incorporation of the Briden et al. [1979] study in global
databases used for TAF models. Gubbins and Kelly [1993],
Kelly and Gubbins [1997], and Johnson and Constable [ 1997] included this study to construct their final TAF model.
Johnson and Constable [1995] noted its strong influence; yet
they included
it in one of their models.
Based
on a jack-knife
approach,
Carhtt
and Cottrtillot [1998] rejected
the Briden et
al. [1979] data set.
In order to test the influence of this site on TAF models, we
performed
two successive
numerical calculations
using an
updated
version of the Quidelleur
et al. [1994] data set (J.
CARLUT ET AL.: PALEOMAGNETISM AND K/AR FROM LA GUADELOUPE ISLAND 847 o
b)
45
'
5
ø
O'
--._- '::'":•/f•':•:)-:-
O'
_4•11}
•
,-
• [ -"•-45ø_
_
c)
0 ø
0 o
Difference
Figure 7. Radial component
(Br, in I.
tT) of the geomagnetic
field at the core-mantle
boundary
obtained
by
fitting the paleomagnetic
database
from the last 5 Ma [Carlut
and Courtillot, 1998] (see text). Geographic
location of sites from the database are shown as triangles. The larger triangle shows the location of the Lesser
Antilles. (a) Model obtained
using the mean direction
calculated
t¾om
Briden et al. [1979] for the Lesser
Antilles
(Model A). (b) Same
as Figure
7a but using
the mean
direction
calculated
from this study.
See Table 5
for listing
of the Gauss
coefficients
obtained
for each
model.
(c) Difference
of Br tin I.
tT) between
models
A and
B.
Carlut and X. Quidelleur, available at http://www.ipgp.jussieu.
fr/depts/PALEoMAG/VARSECU/lntro.html). First, the mean
direction calculated from the Briden et al. [1979] study has
been used for the Lesser Antilles site (model A), while in the second calculation (model B), it has been replaced by the mean
direction obtained in the present study. TAF models were determined using the Occam algorithm of Constable et al. [1987], developed up to degree 4 (see Carlut and Courtillot [1998] for a description of the method). The radial component of the field (Br) at the core mantle boundary (CMB) is shown
in Figures 7a and 7b for models A and B, respectively. The most striking change between models A and B is the significant southward displacement of the magnetic equator
south of the Lesser Antilles in model B. This corresponds to a
lower axial-quadrupole
Gauss
coefficient (g•) in model B
(3.4%) compared to model A (4.8%) (Table 5). The 30% decrease in the g• term, from -1448 nT to -1034 nT, represents the major change t¾om model A to B. Other terms do not show such strong changes, though they appear, overall, to be slightly smaller. The simpler field configuration obtained for
848 CARLUT ET AL.: PALEOMAGNETISM AND K/AR FROM LA GUADELOUPE ISLAND
Table 5, Gauss Coefficients and Energy Spectrum [Lowes, 1974] of the Model Fitting the Paleomagnetic Database From the last 5 Ma [Carlut and Courtillot, 1998]
Model A Model B I 0 -30.000 -30.000 I I 0.198 0.194 0.053 0.246 2 0 -1.448 -1.034 2 I 0.049 -0.275 0.037 -0.304 2 2 0.250 -0.449 7.315 0.340 -0.264 4.046 3 0 -0.498 -0.402 3 I 0.133 -0.241 0.177 -0.257 3 2 -0.145 0.096 -0.100 0.050 3 3 -0.085 0.006 1.444 0.029 0.056 1.1Ol 4 0 0.079 0.022 4 I 0.117 0.046 0.092 0.018 4 2 0.026 -0.068 0.009 -0.087 4 3 -0.081 -0.095 -0.040 -0.074 4 4 0.084 0.011 0.249 0.129 -0.009 0.204
For Model A the mean direction calculated from Briden et al. [1979] was used for the Lesser Antilles, while in Model B the mean direction obtained in this study was used. Colunto headings indicate degree (l), order (nt), and Gauss coefficients
g•" and h[" in gT, and energy spectrum (R) in [t2T 2 (see text).
model B (Figure 7b and Table 5) corresponds to a lower energy
spectrum [Lowes, 1974] for each degree (l = 2 to 4) of the
spherical harmonic representation (Table 5; because the value of the axial dipole coefficient is set to 30 gT, the energy
spectrum is not calculated for degree I = 1). The differences
between the two models are more easily analyzed using the
difference of the Br component at the CMB (Figure 7c). This
shows strong differences of up to 35 IaT (9% of maximum B r at
the poles), representing an increase of more than 50O1 over a wide region centered on the Lesser Antilles. This underlines
the strong influence of this site on the TAF model because it is
located in an area with no other data. Similar conclusions
regarding site distribution effects have recently been drawn by
Carhtt at•d Courti!lot [1998].
7. Conclusions
Paleomagnetic and gcochronologic investigations of 23 independent andesitic lava flows have been conducted in La Guadeloupe Island, French West Indies. Previous [Blat•c, 1983] and new K/At ages obtained at the UPS-IPGP laboratory '
indicate that the time interval covered by the present sampling is between 0 and 1 Ma. In the only sequence of superposed
flows, the Matuyama-Brunhes transition, with a mean age of
781 + 18 ka obtained for two flows, has been recorded. Only
one out of three flows displays intermediate directions, with a
VGP located in the southern Pacific Ocean.
The mean paleomagnetic direction calculated from the
present
data
set
leads
to a significant
revisi•3n
of the direction
deduced for the last 5 Ma from a previously published study of
the Lesser Antilles [Briden et al., 1979]. This is of major
importance because for this time interval, it is the only site available in paleomagnetic databases for a wide area surrounding the Lesser Antilles. Iterative calculations which were performed using an Occam algorithm [Constable et al.,
1987] indicate that substituting the mean direction obtained in this study for that of Briden et al. [1979] significantly changes the TAF model. The major difference is observed for the axial quadrupole term, which is reduced by more than 30%.
The resulting g'•/gi' ratio is reduced from 4.8 to 3.4%, which compares well with the 3.6øI, estimate of Carha and Courtillot
[1998].
The high-quality dating obtained in the present study suggests that it could be quite instructive to perform analyses of the TAF in sinailet tilne intervals than what is usually done.
The difference in inclination found in the Lesser Antilles between 600 - 400 and 200 - 0 ka could indicate characteristic
changes in the axial quadrupole over timescales of the order of
several hundred thousand years. Unfortunately, the present
state of global databases does not allow testing of this hypothesis, and much more temporally well-constrained paleomagnetic data are needed from all over Earth's surface.
Finally, this study strongly suggests that TAF models may
be significantly inllucnccd by both the poor site distribution and the use of old studies that require revision [McElhim•y and
McFaddet•, 1997]. These models are therefore likely to change as more high-quality data are included in global data sets.
Acknowledgments. We thank Mike McElhinny and Nell Opdyke for
reviews and Andrew Roberts /'or careful editorial assistance. We
gratefully acknowledge N. Feuillet for discussions and J.C. Komorowski, G. Hamouya, and the staff of the IPGP Observatoire Volcanologique de la Soufi'iere for help and logistical support throughout the sampling trip. This work was supported by the CNRS/INSU program lnterieur de la Terre (grant 97IT24) and by the Rdgion lie de France (,grant SESAME 947). IPGP contribution 1617.
References
Blanc, F., Corr6lations chronologiques et g•ochimiques des formations volcaniques du sud de la Basse-Terre de Guadeloupe (Petites

![Table 2. K/Ar Ages [Blanc, 1983] for Lava Flows From Basse Terre for Which a Paleomagnetic Direction Could Also Be Determined](https://thumb-eu.123doks.com/thumbv2/123doknet/14792081.601853/9.910.182.738.138.550/table-blanc-flows-basse-terre-paleomagnetic-direction-determined.webp)

![Table 4. Comparison of Paleomagnetic Directions Obtained for Three Flows From This Study and That of Briden et al., [1979]](https://thumb-eu.123doks.com/thumbv2/123doknet/14792081.601853/11.910.117.790.137.300/table-comparison-paleomagnetic-directions-obtained-flows-study-briden.webp)
![Figure 7. Radial component (Br, in I. tT) of the geomagnetic field at the core-mantle boundary obtained by fitting the paleomagnetic database from the last 5 Ma [Carlut and Courtillot, 1998] (see text)](https://thumb-eu.123doks.com/thumbv2/123doknet/14792081.601853/14.910.206.695.96.826/figure-component-geomagnetic-boundary-obtained-paleomagnetic-database-courtillot.webp)
![Table 5, Gauss Coefficients and Energy Spectrum [Lowes, 1974] of the Model Fitting the Paleomagnetic Database From the last 5 Ma [Carlut and Courtillot, 1998]](https://thumb-eu.123doks.com/thumbv2/123doknet/14792081.601853/15.910.143.765.144.478/coefficients-energy-spectrum-fitting-paleomagnetic-database-carlut-courtillot.webp)
