HAL Id: hal-00296178
https://hal.archives-ouvertes.fr/hal-00296178
Submitted on 23 Mar 2007
HAL is a multi-disciplinary open access
archive for the deposit and dissemination of
sci-entific research documents, whether they are
pub-lished or not. The documents may come from
teaching and research institutions in France or
abroad, or from public or private research centers.
L’archive ouverte pluridisciplinaire HAL, est
destinée au dépôt et à la diffusion de documents
scientifiques de niveau recherche, publiés ou non,
émanant des établissements d’enseignement et de
recherche français ou étrangers, des laboratoires
publics ou privés.
downwind of Mexico City
J. C. Doran, J. C. Barnard, W. P. Arnott, R. Cary, R. Coulter, J. D. Fast, E.
I. Kassianov, L. Kleinman, N. S. Laulainen, T. Martin, et al.
To cite this version:
J. C. Doran, J. C. Barnard, W. P. Arnott, R. Cary, R. Coulter, et al.. The T1-T2 study:
evolu-tion of aerosol properties downwind of Mexico City. Atmospheric Chemistry and Physics, European
Geosciences Union, 2007, 7 (6), pp.1585-1598. �hal-00296178�
www.atmos-chem-phys.net/7/1585/2007/ © Author(s) 2007. This work is licensed under a Creative Commons License.
Chemistry
and Physics
The T1-T2 study: evolution of aerosol properties downwind of
Mexico City
J. C. Doran1, J. C. Barnard1, W. P. Arnott2, R. Cary3, R. Coulter4, J. D. Fast1, E. I. Kassianov1, L. Kleinman5, N. S. Laulainen1, T. Martin4, G. Paredes-Miranda2, M. S. Pekour1, W. J. Shaw1, D. F. Smith3, S. R. Springston5, and X.-Y. Yu1
1Pacific Northwest National Laboratory, Richland, WA, USA 2Desert Research Institute, Reno, NV, USA
3Sunset Laboratory, Inc., Tigard, OR, USA 4Argonne National Laboratory, Argonne, IL, USA 5Brookhaven National Laboratory, Upton, NY, USA
Received: 6 November 2006 – Published in Atmos. Chem. Phys. Discuss.: 12 December 2006 Revised: 22 February 2007 – Accepted: 15 March 2007 – Published: 23 March 2007
Abstract. As part of a major atmospheric chemistry and
aerosol field program carried out in March 2006, a study was conducted in the area to the north and northeast of Mexico City to investigate the evolution of aerosols and their associ-ated optical properties in the first few hours after their emis-sion. The focus of the T1-T2 aerosol study was to investi-gate changes in the specific absorption αABS(absorption per
unit mass, with unit of m2g−1) of black carbon as it aged and became coated with compounds such as sulfate and or-ganic carbon, evolving from an external to an internal mix-ture. Such evolution has been reported in previous studies. The T1 site was located just to the north of the Mexico City metropolitan area; the T2 site was situated approximately 35 km farther to the northeast. Nephelometers, particle soot absorption photometers, photoacoustic absorption spectrom-eters, and organic and elemental carbon analyzers were used to measure the optical properties of the aerosols and the car-bon concentrations at each of the sites. Radar wind profilers and radiosonde systems helped to characterize the meteorol-ogy and to identify periods when transport from Mexico City over T1 and T2 occurred. Organic and elemental carbon con-centrations at T1 showed diurnal cycles reflecting the noc-turnal and early morning buildup from nearby sources, while concentrations at T2 appeared to be more affected by trans-port from Mexico City. Specific absorption during transtrans-port periods was lower than during other times, consistent with the likelihood of fresher emissions being found when the winds blew from Mexico City over T1 and T2. The
spe-Correspondence to: J. C. Doran
cific absorption at T2 was larger than at T1, which is also consistent with the expectation of more aged particles with encapsulated black carbon being found at the more distant lo-cation. In situ measurements of single scattering albedo with an aircraft and a ground station showed general agreement with column-averaged values derived from rotating shadow-band radiometer data, although some differences were found that may be related to boundary-layer evolution.
1 Introduction
The MILAGRO (Megacity Initiative: Local and Global Research Observations; http://www.eol.ucar.edu/projects/ milagro/) field campaign was designed to follow the urban plume originating in Mexico City in order to study the evo-lution of the properties of trace gases and aerosols as they drifted downwind from a megacity. The study was con-ducted over multiple scales, ranging from ground-based in-vestigations centered in the Mexico City metropolitan area to aircraft sampling over distances of hundreds of kilome-ters. A major component of the MILAGRO campaign was the MAX-MEX experiment (Megacity Aerosol Experiment in Mexico City; http://www.asp.bnl.gov/MAX-Mex.html), which focused on measurements within, over, and a few tens of kilometers downwind from Mexico City. MAX-MEX was supported by the U.S. Department of Energy through its At-mospheric Sciences Program. In this paper we describe some aspects of one element of the MAX-MEX experiment that we refer to as the T1-T2 study.
The T1-T2 study was motivated by the desire to investi-gate the evolution of aerosols and their associated optical properties in the first few hours after their formation. We hypothesized that the shift from an externally mixed state characteristic of fresh emissions to an internally mixed one would result in significant modifications to the optical prop-erties of aerosols as they were advected downstream from Mexico City. Evidence for changes in aerosol composition due to aging in the Mexico City area has been found by other investigators (e.g., Baumgardner et al., 2000; Johnson et al., 2005). We were particularly interested in changes in the mass absorption efficiency or specific absorption αABS(absorption
per unit mass, with unit of m2g−1) of black carbon (BC)
be-cause of its potential importance for climate change. The specific absorption is one of two key parameters that deter-mine the magnitude of the aerosol forcing by BC, the other being the atmospheric burden (Chung and Seinfeld, 2002; Sato et al., 2003). In this paper we will use the terms black carbon and elemental carbon (EC) interchangeably, but we note here that Andreae and Gelencs´er (2006) warn that the term “black carbon” has been used somewhat carelessly in the literature. For the moment we will not deal with this dif-ficulty but will return to it when we discuss our absorption measurements in Sect. 5.
In the past, field estimates of the specific absorption of black carbon have varied by an order of magnitude, ranging from 2 m2g−1 to 25 m2g−1 at ∼500 nm. (e.g., Waggoner et al., 1981; Horvath, 1993; Liousse et al., 1993; Petzold et al., 1997; Penner et al., 1998; Moosm¨uller, 1998; Marley et al., 2001; Baumgartner, 2002; Arnott et al., 2003; Schnaiter et al., 2003; Schuster et al., 2005; Mikhailov et al., 2006). While BC is normally assumed to be present as an external mixture close to the source (e.g., Mallet et al., 2003; Jacob-son and Seinfeld, 2004), processes such as heterocoagulation and condensation can alter the mixing state as the particles age (e.g., Jacobson, 2001). Such processes likely have con-tributed to the order of magnitude differences in the estimates of αABSnoted above. Recently, Bond and Bergstrom (2006)
suggested that freshly emitted, uncoated soot particles have a value of αABS=7.5±1.2 m2g−1at 550 nm. This “uncoated”
value will increase as the particles age and become coated, e.g., with substances such as sulfate or organic carbon, but the rates at which aging occurs and direct observations of the change in αABSas this occurs downstream from a source
have been difficult to determine in the field. In contrast, the theoretical study of Fuller et al. (1999) suggests that αABSis
unlikely to exceed 10 m2g−1unless most of the BC is
encap-sulated in aerosol distributions whose geometric mean radius is greater than 0.06 µm. In light of these and other studies, we are led to ask: to what extent and at what rate does aging affect αABSfor BC-containing aerosols that were originally
uncoated?
The campaign in the Mexico City area provided an op-portunity to address this question by measuring values of
αABS at two or more locations, one relatively close to
ma-jor sources of BC and one farther downstream. Unless an aerosol is somehow tagged to a specific source, the precise location and time of the formation, t0, of an aerosol over
Mexico City is essentially impossible to determine after it has drifted downwind by a few kilometers. Once outside the primary source region, however, it is possible, at least in prin-ciple, to track air masses containing aerosols. Our approach was to measure aerosol properties at two sites downwind of the Mexico City urban area and to use meteorological mea-surements and modeling to determine periods when aerosols originating in Mexico City passed over the two sites. During those periods a segment of the urban plume can be assumed to arrive at the first downwind location at a time t1and at the
second location at a time t2, thereby giving rise to the T1-T2
identifying label for this study. The differences in aerosol properties as a function of the time difference t2–t1can then
be studied.
In the remainder of this paper we describe the design of the T1-T2 study, compare some of the meteorological conditions found over the T1 and T2 sites, identify periods when the Mexico City plume was expected to flow over both sites, and present some preliminary comparisons of specific absorption and other aerosol properties at the two locations. More exten-sive and detailed comparisons, as well as analyses of results obtained at T0, will be the subjects of future papers.
2 Study design
The T1 site was located at Tecamac University at 19.703 N latitude and 98.982 W longitude, at an altitude of 2273 m. This site is near built-up regions and a major highway and is just to the north of the main metropolitan area of Mexico City. Because the site is close to the city we expected it would frequently be affected by the ur-ban plume drifting over the region. An analysis com-bining computer modeling, radar wind profiler and ra-diosonde data collected during the 1997 IMADA-AVER ex-periment (Doran et al., 1998), and rawinsonde data from 2002 and 2003 (http://mirage-mex.acd.ucar.edu/Documents/ MIRAGE-Mex SOD 040324.pdf) indicated that, in the up-per portions of the boundary layer and above, flows from Mexico City to the north, northeast, or northwest could be ex-pected roughly 50% of the time during the month of March. Closer to the surface the winds tend to be lighter and less well organized. It was also estimated that winds throughout the depth of the boundary layer would carry the Mexico City urban plume to the north-northeast over the city of Pachuca between 20 and 30% of the time. Additional information about the meteorology encountered during the MILAGRO campaign will be published elsewhere.
Although the expected frequency of favorable wind direc-tions was not as high as we might have wished, it was de-cided nonetheless that it would still be worthwhile to locate the T2 site in the general area of Pachuca. Accordingly, the
Fig. 1. Map of study area showing locations of T1 and T2 sites.
Topography contour intervals are 200 m.
T2 site was situated 35 km to the north-northeast of T1 at Rancho la Bisnaga, 20.010 N latitude and 98.909 W longi-tude, at an altitude of 2542 m. The locations of these two sites are shown in Fig. 1. The region between T1 and T2 is much less densely developed than the Mexico City urban area. Some local sources of BC and other aerosols can be found between T1 and T2, primarily along the highway be-tween Mexico City and Pachuca, but their impact was ex-pected to be small compared to that of the urban plume orig-inating in Mexico City. Also shown in Fig. 1 is the location of the Insituto Mexicano del Petr´oleo, labeled T0 in the figure, which was an observation site considered to be representative of the Mexico City metropolitan area.
The T1 site was one of the two major ground sites for the MILAGRO campaign, with investigators from approxi-mately a dozen laboratories and universities making a wide range of meteorological, chemical, aerosol, and atmospheric radiation measurements. In contrast, the T2 site featured a much smaller number of investigators and instruments, con-sistent with the expected infrequency of urban plume pas-sages over that location. In this paper we will consider data from pairs of instruments, with one of each pair located at both T1 and T2: radar wind profilers, radiosondes, organic and elemental carbon (OCEC) analyzers, photoacoustic ab-sorption spectrometers (PASs), 3-wavelength nephelometers, particle soot absorption photometers (PSAPs), and multi-filter rotating shadowband radiometers (MFRSRs). Informa-tion about these instruments is provided below. In addiInforma-tion to these ground-based instruments, several aircraft made flights over T1 and T2 during the campaign. We will briefly
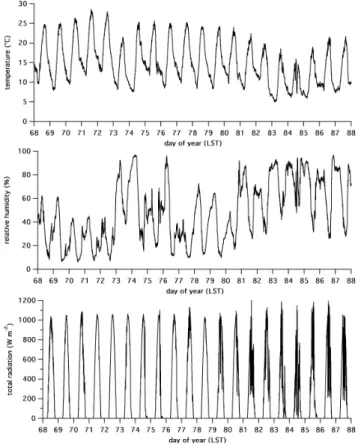
dis-Fig. 2. Time series of temperature, humidity, and total solar
radia-tion measured with surface instruments located at T2.
cuss some results from measurements with a nephelometer and PSAP on board DOE’s Gulfstream-1 (G-1) aircraft taken during periods when the Mexico City plume was expected to drift over those sites.
Although some instruments were operational earlier, full-scale operations at T1 and T2 commenced approximately on day of year (DOY) 70 (11 March). Measurements at both sites continued from that time through DOY 87 (28 March). Figure 2 shows time series of temperature, humidity, and to-tal solar radiation measured with surface instruments located at T2. The first two weeks of the measurement period were generally warmer, drier, and had less cloudiness than the last week. Rain showers occurred on a daily basis during the last week.
3 Instruments
The radar wind profilers (RWPs) used at T1 and T2 were 915 MHz models manufactured by Vaisala. They were oper-ated in a 5-beam mode with nominal 192-m range gates. We applied the NCAR Improved Moment Algorithm (Morse et al., 2002) to the moments data from the profilers to obtain 30-min average consensus winds. The radiosonde systems were Vaisala DigiCORA™ systems and used model RS-92
sondes, also manufactured by Vaisala. The sondes released at T2 measured temperature and humidity while some of the sondes released at T1 also measured winds with a GPS sys-tem. On days when the G-1 was expected to fly in the vicinity of T1, up to five radiosondes were released there, nominally at 09:00, 11:00, 13:00, 15:00, and 17:00 local standard time (LST). If the anticipated G-1 flights included sampling in the T2 area, up to three additional sondes were launched at T2 at 11:00, 13:00, and 15:00 LST.
The OCEC analyzers were manufactured by Sunset Labo-ratory Inc., and are similar to the thermal-optical instrument described in Birch and Cary (1996). Samples collected on a quartz filter are volatilized under controlled conditions of temperature and processing gas mixtures. The process is used to differentiate between organic and elemental carbon, with an optical correction technique applied to correct for pyrolytically generated carbon. Sampling times were 45 min in length, with an additional 15 min allocated to analysis and cooling after each sampling period. The OCEC unit was cal-ibrated on-site using external standard filters before ambi-ent sampling. The external standard was analyzed in off-line mode. The data acquisition parameters were adjusted after the calibration to reflect the known OC/EC ratio. The esti-mated detection limit is 0.02 µgC m−3and the estimated un-certainty of the OCEC measurement is 0.2 µgC m−3. Quartz filters were changed every few days before a significant re-duction in the intensity of the laser signal used for the optical corrections was observed. A blank sample was scheduled for midnight (LST) daily. We restricted our analyses to pe-riods when the OC and EC concentrations were greater than or equal to 0.1 µgC m−3.
The PAS measures sound pressure produced by light ab-sorption in an acoustic resonator and has been described by Arnott et al. (1999). The instruments at T1 and T2 operated at a wavelength of 870 nm. Operation at 870 nm is advan-tageous because BC does absorb at this wavelength but the absorption of other atmospheric constituents such as dust and OC is quite weak (Jacobson, 1999; Sokolik and Toon, 1999; Sato et al., 2003; Kirchstetter et al., 2004). Average absorp-tion values were computed every two minutes, and we com-bined absorption values averaged over 46-min periods with EC values from the OCEC analyzers to obtain estimates of the specific absorption of EC at T1 and T2.
The nephelometers (TSI 3563) and PSAPs (Radiance Re-search) at T1 and T2 were configured as parts of aerosol op-tical measurement systems developed by NOAA’s Climate Modeling & Diagnostics Laboratory (CMDL). Ambient air is diverted alternately through 1 µm and 10 µm impactors at 6-min intervals, and the humidity is controlled so that it is less than or equal to 40% RH before the air is introduced into the nephleometer or PSAP. The nephelometers oper-ated at three wavelengths: 450 nm, 550 nm, and 700 nm; the PSAPs also operated at three wavelengths: 470 nm, 530 nm, and 660 nm. Scattering and absorption measurements were averaged and recorded every minute. The nephelometer
and PSAP on the G-1 operated at the same wavelengths as the surface units. Corrections to the PSAP absorption and the nephelometer scattering were carried out using the ap-proach described by Bond et al. (1999) and Anderson and Ogren (1998). Additional information on the nephelome-ters and PSAPs can be found at the CMDL website http: //www.cmdl.noaa.gov/aero/instrumentation/instrum.html.
The MFRSRs (Harrison et al., 1994) measured the direct normal, diffuse horizontal, and total horizontal components of the broadband irradiances using a silicon detector, and these same components at six wavelengths (415, 500, 615, 673, 870, and 940 nm) with an interference filter/silicon de-tector combination having a nominal passband of 10 nm at each wavelength. Data were averaged and recorded at 20-s interval20-s. From the20-se mea20-surement20-s, we can determine aerosol optical thickness, τ . By applying the technique of Kassianov et al. (2005) it is also possible to determine the aerosol single scattering albedo, ̟0, and asymmetry
param-eter, g. In contrast to the aerosol quantities measured by our other surface instruments, these quantities should be consid-ered as averages over the atmospheric column.
4 Boundary-layer structure and winds
Doran et al. (1998) found that on clear days the bound-ary layer (BL) in Mexico City during March typically grew slowly after sunrise (approximately 06:40 LST) to a depth on the order of 1000 m by 11:00 or 12:00 LST, after which it grew rapidly to heights of 3000 m or more in the next few hours. This behavior was observed at T1 during the MILA-GRO campaign as well, although the heights tended to be somewhat smaller during this campaign, and the BL behav-ior at the T1 and T2 sites appeared to be similar. Figure 3 shows a comparison of BL depths estimated from potential temperature profiles measured with radiosondes at ∼11:00, 13:00, and 15:00 LST on days for which nearly simulta-neous releases were made at the two sites. The regression line is given by h2=0.90×h1+25 m, with R2=0.89, where h1 and h2 are the BL depths at T1 and T2, respectively. We have also compared boundary-layer depths at T1 and T2 by examining the signal-to-noise ratio of the reflected signals from the RWPs at the two sites (not shown). The agreement between the two sites is again reasonable (R2=0.90), with h2=0.79×h1+260 m. The similarity of the boundary layer depths at the two sites simplifies some aspects of the anal-ysis. It makes plume trajectory analyses easier (see below) and it helps ensure that aircraft operations in the mixed layer at one site will also be in the mixed layer at the second site, providing the flight altitudes are not too different. Further in-formation on boundary layer characteristics during the cam-paign will be the subject of other papers.
We were particularly interested in days when the winds were likely to blow the urban plume over both T1 and T2. A detailed analysis identifying times when this occurred will
be carried out in the future using a mesoscale model that in-corporates a data assimilation scheme, parameterizations of vertical mixing, and estimates of source locations in the Mex-ico City metropolitan area. For this initial analysis, however, we have simply used the wind data obtained from the RWP at T1 to calculate forward and back trajectories of air masses that passed over T1. Figure 4 shows examples of trajectories calculated at 1000 m above ground level (AGL) for daylight hours over a 20-day period. The most favorable conditions for T1-T2 transport are seen to have occurred on DOY 69, 77, 78, 79, and 83, (10, 18, 19, 20, and 24 March, respec-tively) with briefer periods of preferred wind directions oc-curring on several other days. On some days (e.g., DOY 81 [22 March]) the calculated trajectories showed the Mexico City plume traveled close to T2, and lateral spreading of the plume may well have resulted in some impact of Mexico City emissions on both T1 and T2. On other days (e.g., DOY 74 [14 March]), the trajectories show near-misses at T2 but the back trajectories at T1 suggest that the air mass traveling from T1 to T2 did not originate over the urban region. In some cases the wind directions exhibited substantial vertical shear (not shown), which makes interpretation of the plume transport problematic.
On many days, and especially on those with wind direc-tions favorable for T1-T2 transport, the boundary layer was quite dry. For example, by 11:00 LST on each of DOY 70, 77, 78, and 79 (10, 18, 19, and 20 March) radiosonde sound-ings at T1 showed relative humidities in the boundary layer of 46% or less (usually much less), with similar values found from the T2 sondes. Above the boundary layer there was often a very dry layer that could extend over depths of hun-dreds of meters or more. Figure 5 shows an example of this feature. Hygroscopic growth of aerosols and the consequent effects on aerosol light scattering can be assumed to be es-sentially negligible under such dry conditions (Nemesure et al., 1995; Baumgardner and Clarke, 1998; Im et al., 2001; Redemann et al., 2001; Carrico et al., 2003; Markowicz et al., 2003). Thus, the optical properties of aerosols measured near the surface are likely to be similar to those aloft in a well-mixed boundary layer, which is advantageous for some radiative closure analyses.
5 Results and discussion
5.1 OC and EC concentrations
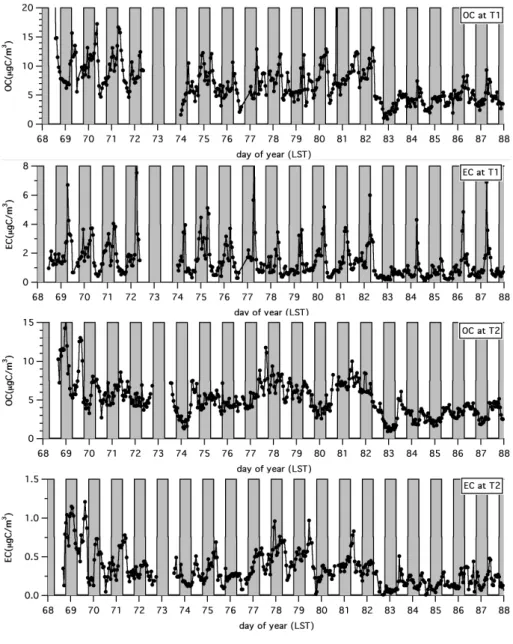
Figure 6 shows plots of the organic (OC) and elemental (EC) carbon concentrations at T1 and T2 as a function of time. At T1 there was often a strong diurnal variation in OC and EC concentrations during the first two weeks, with concentra-tions increasing during the nighttime hours and the largest values occurring in the morning hours around sunrise or shortly after. This behavior is consistent with the trapping of pollutants in the Mexico City area overnight and during
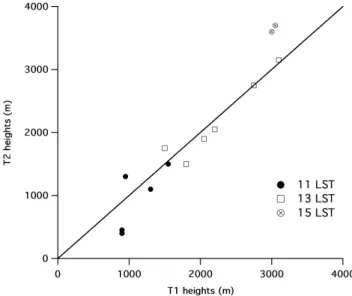
Fig. 3. Comparison of boundary-layer depths at T1 and T2
esti-mated from potential temperature profiles measured with radioson-des at ∼11:00, 13:00, and 15:00 LST on days for which nearly simultaneous releases were made at the two sites: 11:00 LST (DOY 68, 74, 77-78), 13:00 LST (DOY 68, 69, 76–79), and 15:00 LST (DOY 68 and 79).
the morning hours in a shallow surface layer before the rapid growth of the mixed layer commences in the late morning. Although the boundary layer structure and evolution at T2 were similar to those at T1, the OC and EC behavior at T2 was much less regular; there were often multiple peaks dur-ing a 24-h period, and mid- to late-afternoon peaks were common. No significant accumulations of pollutants, com-parable to what was found at T1, developed overnight at T2. This was expected, given the absence of local sources in the area around and immediately upwind of T2.
Transport from Mexico City to T2 appears to account for a substantial fraction of the variations in OC and EC concentra-tions at T2. OC and EC concentraconcentra-tions were generally lowest at both sites during the last week of the campaign when the weather conditions were most unsettled and there were peri-ods of rain. On days with the most favorable wind directions for T1-T2 transport (DOY 69, 77, 78, and 79 (10, 18, 19, and 20 March)), both the OC and EC values at T2 tended to reach higher values than on other occasions, although DOY 70, 71, and 81 (11, 12 and 22 March) also have elevated readings. At T1, which was considerably closer to the local and Mexico City sources than T2, the carbon concentrations showed less sensitivity to wind directions.
DOY 83 (24 March) has been identified as a transport day but shows some unusual features. The OC and EC concen-trations at T1 were low throughout the night, but the OC val-ues were considerably higher during the day while the EC values were not. At T2, OC and EC were low at night but both increased substantially shortly after sunrise. Rain fell at T1 and T2 just after sunset the previous night and during
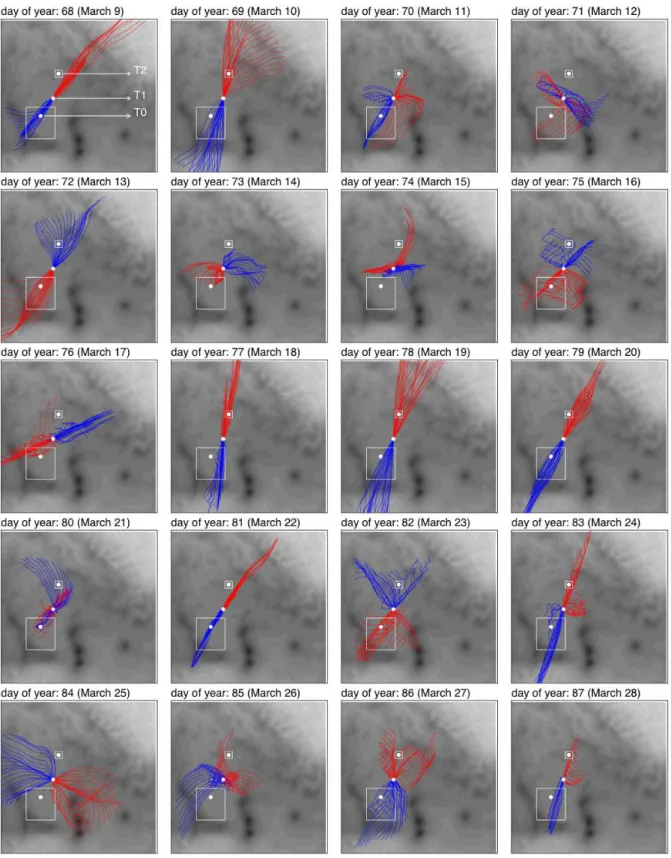
Fig. 4. Trajectories of air parcels passing over T1 at 1000 m a.g.l. for the hours 06:00–18:00 LST based on 30-min RWP data at T1. Blue
indicates flow into T1 and red indicates flow away from T1. The small box around T2 is 10 km on a side; the larger box around T0 is an approximate boundary of Mexico City.
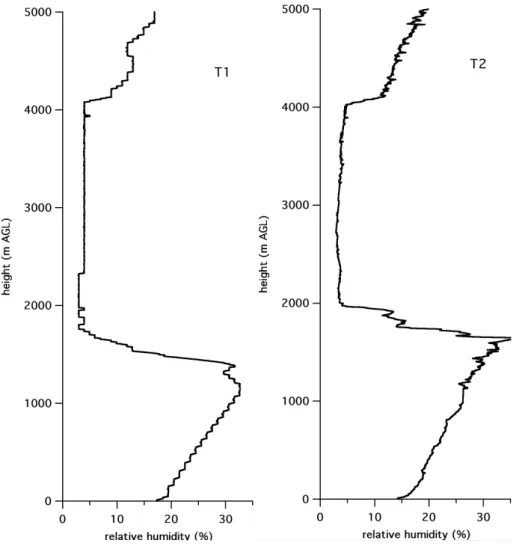
Fig. 5. Example of relative humidity profiles at T1 and T2 showing dry layer above the boundary layer for sounding taken at 13:00 LST
on DOY 78 (19 March). The stair-step pattern at T1 is due to the limited resolution of the humidity measurements for the system deployed there.
the afternoon of DOY 83. The rain may have contributed to the lower carbon concentrations and the specific absorption values are somewhat higher than the median values found for other transport periods. While this is consistent with the results found by Redemann et al. (2001) and Mikhailov et al. (2006), the sampling period is rather small and we hesi-tate to attach too much significance to this result at this time. There is considerable scatter about the means, but for the period shown in Fig. 6 the OC concentrations at T2 were approximately 23% lower than at T1 while the EC concen-trations were smaller by almost a factor of four. The average EC/OC ratio at T1 was 0.210, while that at T2 was approxi-mately three times smaller with a value of 0.063. Assuming the Mexico City metropolitan area is the primary source of EC in the area, the decrease in this quantity between T1 and T2 was anticipated, given the dilution expected in traveling between the two sites. Conversely, the much smaller change in OC concentrations presumably reflects the rapid and ongo-ing generation of OC over the region (Volkamer et al., 2006).
5.2 Specific absorption of EC
There is still some debate about exactly what is measured by an OCEC analyzer. Andreae and Gelencs´er (2006) propose an operational definition for apparent elemental carbon, as “the fraction of carbon that is oxidized above a certain tem-perature threshold in the presence of an oxygen-containing atmosphere”, and denote this quantity as ECa. For
simplic-ity in this paper we have retained the more commonly used designation EC, but we are mindful of this potentially im-portant distinction. Under some circumstances EC may only be loosely related to soot particles, but the connection should be considerably better in regions with high concentrations of petroleum combustion sources, and Mexico City is one such region. Andreae and Gelencs´er also note that BC is often used to denote the result of a light-absorbing carbon mea-surement by an optical absorption technique. In any event, our interest for this study was not the measurement of the specific absorption of soot per se but rather the absorption
Fig. 6. Time series of the organic (OC) and elemental (EC) carbon concentrations at T1 and T2. Nighttime periods are indicated by the
shaded areas. Note differences in scales for T1 and T2.
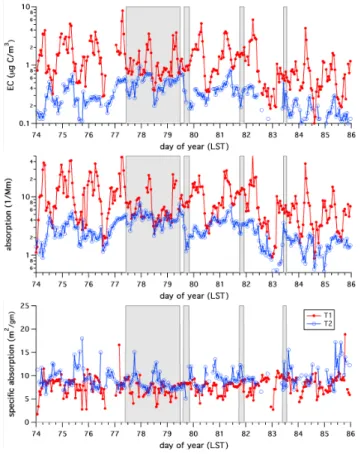
per unit mass of EC and how that may be modified as EC be-comes coated in the hours or days after emission. We again note that almost all of the absorption measured by the PASs at T1 and T2 is likely due to the EC at the respective sites because dust and OC do not absorb significantly at the wave-length of the PAS measurements. Figure 7 shows time series of EC concentrations, absorption measured by the PASs, and specific absorption computed from the ratio of the absorp-tion determined from the PASs and the EC concentraabsorp-tions measured by the OCEC analyzers, for a 12-day period dur-ing which the OCEC analyzers and PASs at both sites had good data recovery.
Figure 8 shows a scatter plot of the absorption as a func-tion of EC concentrafunc-tions at the two sites. There is a greater
degree of scatter at T2 than at T1, which is expected given the substantially lower EC concentrations and absorption found at the former site. At T1 the EC concentrations and absorp-tion values were as much as an order of magnitude higher than at T2 but the specific absorption was generally higher at T2 than at T1.
The figure shows that reasonably robust fits to the data at each site can be obtained with linear fits that are constrained to go through the origin. The R2 values in each case are
∼0.96. The slopes of the lines in the figure correspond to the mean values of specific absorption at the two sites, with the value at T2 about 9% higher than that at T1 for the full sampling period. One can also obtain a least squares fit to the data at each site while leaving the intercept as a free
Fig. 7. Time series of EC concentrations, absorption measured by
the PASs, and specific absorption of EC at T1 and T2 for a 12-day period during which the OCEC analyzers and PASs at both sites had good data recovery. Transport periods are indicated by the shaded areas.
parameter. The results are virtually unchanged at T1 but result in a smaller slope at T2 and an intercept on the or-der of 0.6 Mm−1. A non-zero intercept is unphysical (if the
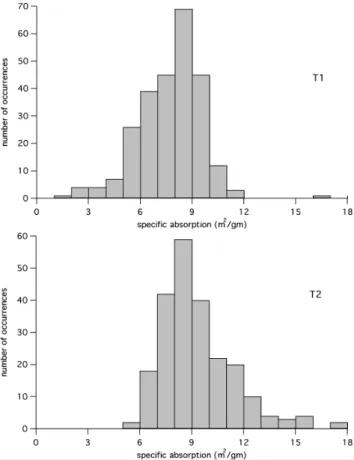
EC concentration is zero the absorption should be zero) and may indicate errors in the measurements, another absorbing species, or that the specific absorption is not necessarily in-dependent of concentration. At this time we have no way of distinguishing among these possibilities. Partly for this rea-son, and partly to mitigate the effects of possible outliers in the data, we prefer to use the median values of specific ab-sorption at T1 and T2 rather than mean values. Moreover, given the skewed nature of the distributions of specific ab-sorption shown in Fig. 9, we believe the median is a more useful indicator of the behavior than the mean.
Histograms of specific absorption at the two sites are shown in Fig. 9 and indicate that the distributions were skewed toward higher values at T2 but not at T1. This is what would be expected if the differences between the sites are attributable to the greater aging of the EC sampled at the site more distant from sources in Mexico City.
Fig. 8. Scatter plots of absorption as a function of EC concentration
at T1 (top) and T2 (bottom). The straight lines are least squares fits to the data that are constrained to pass through the origin.
It is interesting to compare the values of specific absorp-tion at the two sites during times when the Mexico City plume was traveling from the city over T1 and then T2 with the values found when such transport was not occurring. Us-ing the T1 RWP data, we identified “transport” periods when air parcels passing through T1 were likely to have originated over the city and subsequently passed within 5 km of T2 ap-proximately 4 h or less after exiting the city. In some cases near-surface trajectories did not have favorable directions but trajectories further aloft (e.g., 1 km) did. If these cases oc-curred when a convective boundary layer was present that could mix air parcels throughout the boundary layer to the surface, then those periods were also included in the trans-port category. All other periods were lumped into the “non-transport” category. Without using a detailed mesoscale model constrained by data assimilation of RWP data there is some uncertainty and subjectivity in the choice of the partic-ular time periods to include in each category, but our results are not especially sensitive to the details of the selection cri-teria. Table 1 gives median and 10th and 90th percentile val-ues of the specific absorption at T1 and T2 for the transport and non-transport periods. We have also included values of
Fig. 9. Histograms of specific absorption of EC at 870 nm at T1
(top) and T2 (bottom). The histogram for T1 represents 264 h of data while that for T2 represents 236 h.
specific absorption extrapolated to a wavelength of 550 nm, assuming a λ−1dependence for the absorption between 870
and 550 nm as suggested by Bergstrom et al. (2002). Two features stand out in the table. The first is that larger values of specific absorption are found at both T1 and T2 during non-transport times than during transport times. This is consistent with the expectation that longer-aged EC with greater coating is more likely to be found at both sites if the wind is not blowing directly from the city. The second fea-ture is that the specific absorption at T2 is larger than at T1 for both transport and non-transport periods. This suggests that the specific absorption of EC can be modified after only a few hours of aging, the time required for transport from T1 to T2. On non-transport days the results indicate that fresher emissions from Mexico City or nearby local sources are still more likely to be found at T1 than at T2. Although the dif-ferences in specific absorption noted here are not large, a Mann-Whitney test indicates that the differences are statis-tically significant at the 1% level.
The median values extrapolated to 550 nm displayed in the table are considerably larger than the value of 7.5±1.2 m2g−1 reported by Bond and Bergstrom (2006)
for uncoated soot particles. However, Bond et al. (2006) suggest that absorption by aged aerosol is about 1.5 times greater than that of fresh aerosol at 550 nm. Johnson et al. (2005) note that while in Mexico City “fresh particulate emissions from mixed-traffic are almost entirely carbona-ceous. . . ambient soot particles which have been processed for less than a few hours are heavily internally mixed. . . ” Our larger values of specific absorption are thus consistent with this characterization of the emissions.
It is interesting that the 10th percentile value of spe-cific absorption at T1 during transport conditions is 8.7 m2g−1(extrapolated to 550 nm), which is near the upper end of the range of values suggested by Bond and Bergstrom for freshly emitted soot. In contrast, the 10th percentile value of specific absorption at T2 is 10.8, well beyond the sug-gested range. For non-transport periods, the 10th percentile value at T1 is still 8.7, which is consistent with our expec-tation that even during non-transport periods T1 would often be influenced by nearby sources. This is less likely to be the case at T2, and the 10th percentile value there is indeed substantially larger than for transport conditions.
The extrapolations of the specific absorption values from 870 nm to 550 nm shown in the table may be problematic. Bergstrom et al. (2002) found a σA∼λ−1dependence, where σAis the cross section for aerosol scattering, but Moosm¨uller
et al. (1998) derived a λ−2.7relationship from their analysis.
Using PSAP data at three wavelengths we have examined the wavelength dependence of absorption between 470 and 660 nm. We found the median exponent in the expression
σA∼λbis close to −1, but there is considerable scatter about
this value. Moreover, an extrapolation derived from 660 and 530 nm PSAP data cannot be applied with much confidence to the much larger extrapolation of the 870 nm photoacoustic results to 550 nm. Thus we do not believe that a point-by-point comparison of 530 nm PSAP and 870 nm PAS absorp-tion values is warranted. The extrapolaabsorp-tion of the summary statistics shown in the table may still be useful, but we sug-gest that the 550 nm values be treated with considerable cau-tion.
The G-1 aircraft did not measure EC so it is not possible to use G-1 data to directly extract values of specific absorption as it passed through the Mexico City urban plumes.
5.3 Single scattering albedo
We have made an initial examination of the single scatter-ing albedo determined from the airborne nephelometer and PSAP data to see if significant changes could be discerned between the T1 and T2 locations on days when the urban plume was carried over or near both sites. The single scat-tering albedo is defined by ̟0=6S6+6S A, where 6S and 6A
are the extinction coefficients for aerosol scattering and ab-sorption, respectively. Values of ̟0 were calculated when
the G-1 was sampling within 5 km of T1 or T2 on DOY 77, 78, and 79 (18, 19, and 20 March). From the PSAP and
Table 1. Median, 10th and 90th percentile values of specific absorption of EC in m2g−1for transport and non-transport periods.
T1 T2
10th percentile median 90th percentile 10th percentile median 90th percentile transport peri-ods 870 nm 5.5 7.7 9.2 6.8 8.3 11.9 non-transport periods 870 nm 5.5 8.1 9.7 7.5 9.0 12.2 transport peri-ods 550 nm 8.7 12.2 14.5 10.8 13.1 18.8 non-transport periods 550 nm 8.7 12.8 15.4 11.8 14.3 19.3
Table 2. Mean values of ̟0derived from the T1 and T2 MFRSRs (at 500 nm) and from the T2 surface aerosol system (nephelometer and
PSAP) data (at 530 nm) for DOY 71, 78, and 86 (12, 19, and 27 March). Note that surface values were available only at T2. DOY Time (LST) ̟0 from T1
MFRSR ̟0from T2 sur-face system Time (LST) ̟0from T2 MFRSR ̟0 from T2 sur-face system 71 08:00–09:36 0.84 0.88 08:00–09:36 0.91 0.88 78 07:30–09:30 0.85 0.92 07:30–11:28 0.83 0.91 86 08:00–10:00 0.89 0.92 07:30–08:00 0.90 0.90
nephelometer data, ̟0 was on the order of 0.9 for most of
the flights during these transport periods, so that σA∼σS/9.
From Table 1, the median specific absorption at the surface at T2 was ∼10% larger than that at T1. We can assume that the variations in the surface absorption values were approxi-mately the same as those at the G-1 sampling elevations be-cause the boundary layer was generally well developed at the times of the G-1 overflights. Thus, reductions in ̟0between
T1 and T2 arising from changes in σA(and assuming σSwas
unchanged) would only be on the order of 0.01. Given the observed fluctuations in the values of ̟0, consistent
differ-ences between T1 and T2 were expected to be difficult to identify in the G-1’s data stream (although such accuracy has been suggested as needed for climate studies (Heintzenberg et al., 1997)). This expectation was confirmed in our initial examination of the G-1 data time series. Further analyses are planned using CO measurements to help identify the times and locations when the G-1 was sampling within the Mexico City urban plume and to compare in-plume and out-of-plume values of ̟0, but at this point we do not anticipate major
changes in ̟0will be found between T1 and T2.
We have evaluated single scattering albedos at the surface at T2 for the transport and non-transport periods described above as well. The distributions of ̟0 for these two
peri-ods are similar, with mean values differing by approximately 0.01 or less. This implies that the direct radiative forcing
at T2 should not be significantly affected by the differences in the specific absorption of EC between transport and non-transport periods, although it still could be affected by other factors such as variations in the total optical depth between the two sites. It would have been desirable to compare sur-face results from the T1 and T2 sites to see if those dis-tributions of ̟0were similar, but the data recovery for the
nephleometer and PSAP at T1 was poor and we are unable to provide such a comparison at this time.
We have also used the MFRSR data at T1 and T2 to de-rive values for ̟0at 500 nm using the approach described by
Kassianov et al. (2005). In contrast to the aerosol quantities measured by our other surface instruments, ̟0derived from
the MFRSR data can be considered as an average over the atmospheric column. The approach is only applicable when the sky is essentially cloud-free. In practice this often limits our analysis periods to a few hours in the morning because cumulus clouds frequently developed in the late morning or afternoon. Initial results are similar to those obtained from the G-1 measurements described above, i.e., differences in
̟0 between T1 and T2 are small (∼0.01–0.02) without an
obvious tendency for values at one or the other site to be larger.
Table 2 shows some values of ̟0 for a wavelength of
500 nm obtained from the MFRSRs and from the T2 sur-face aerosol system at 530 nm on three days with cloud-free
periods. The times of the MFRSR measurements are given in the table. The agreement between the column averaged val-ues of ̟0and the T2 surface value is good for DOY 86 (27
March), fair for DOY 71, and poorer on DOY 78 (19 March). The discrepancy between MFRSR and surface values of
̟0on DOY 78 may be due to boundary-layer structure and
growth. The G-1 made measurements on that day between
∼10:50 and 12:00 LST and found values ranging from 0.87 to 0.90 over T1 and around 0.87 over T2. At T2 this re-sult is an intermediate one between the surface value and the column-averaged value. The sampling height of the air-craft was ∼3100 m m.s.l., or approximately 830 m a.g.l. at T1 and 560 m a.g.l. at T2. This would have placed the G-1 within the growing boundary layer at heights of ∼0.5–0.7 of the mixed layer depths estimated from RWP signal-to-noise values. It is thus reasonable to assume that the G-1 was sam-pling in a region where the aerosol mix was influenced by both near-surface aerosols, with higher values of ̟0as
in-dicated by the nephelometer and PSAP data, and aerosols entrained from aloft, with lower values of ̟0 as suggested
by the MFRSR results. Later in the afternoon (∼17:00 LST) when the boundary layer was deeper, the G-1 was again over the T2 site and measured a value of 0.90 for ̟0, which agrees
well with the corresponding surface value at that time of 0.92.
6 Summary
We have carried out an experiment to investigate the evolu-tion of aerosols and their optical properties downwind from Mexico City. Our focus has been on the specific absorption of black carbon and how that is affected as the aerosols age and become coated, changing from an externally to an inter-nally mixed state. To accomplish this we deployed instru-ments at two sites, T1 and T2, to characterize the meteorol-ogy, solar radiation, aerosol light scattering and absorption, and OC and EC concentrations. An instrumented aircraft flew a number of missions over the two sites as well.
The purpose of this paper has been to provide an overview of the T1-T2 experiment and to present some preliminary re-sults and highlights from that campaign. OC and EC values at T1 showed diurnal variations suggesting a buildup of more polluted air from nearby urban sources during the night and a subsequent dilution as the boundary layer grew the following morning. This behavior was not found at the more isolated T2 site but transport from Mexico City appeared to be a ma-jor factor in determining OC and EC concentrations. Using data from a radar wind profiler, we have divided the mea-surement periods into transport and non-transport periods, corresponding to conditions when air masses were or were not expected to travel from Mexico City and then over T1 and T2. The specific absorption of EC during transport peri-ods was lower than that found during non-transport periperi-ods, which is consistent with the expectation that fresher
emis-sions are more likely to be found at T1 and T2 during trans-port episodes than at other times. The specific absorption at T2, the site more distant from Mexico City, was also found to be larger than at T1, in keeping with the greater age of the aerosols expected at T2. Initial analyses of the variation of
̟0at T2 for transport and non-transport periods reveal only
small differences, although additional analyses are planned. Comparisons of values from G-1 aircraft data, surface opti-cal measurements, and column-averaged values derived from MFRSR data appear broadly consistent, although boundary-layer structure and growth appear to contribute to some dif-ferences between the in situ and the column-averaged values. A number of additional topics are anticipated for future studies, including detailed examination of the in-plume and out-of-plume aerosol characteristics derived from the G-1 measurements, more detailed analyses of plume trajectories and their relation to the specific absorption measured at T1 and T2, assessment of the aerosol optical characteristics at T0, and further comparisons of in situ and column-averaged aerosol properties.
Acknowledgements. We thank J. Ogren, B. Andrews, and P.
Sheri-dan of NOAA’s CMDL for their assistance with the construction of the aerosol optical measurement systems and the subsequent data processing. We appreciate the assistance of P. Holowecky and J. Satola of Battelle Columbus for their contributions to the field measurements. This research was supported by the Office of Science (BER), U.S. Department of Energy, under the auspices of the Atmospheric Science Program, under Contract DE-AC05-76RL01830 at the Pacific Northwest National Laboratory. Pacific Northwest National Laboratory is operated for the U.S. DOE by Battelle Memorial Institute.
Edited by: S. Madronich
References
Anderson, T. L. and Ogren, J. A.: Determining aerosol radiative properties using the TSI 3563 Integrating Nephelometer, Aerosol Sci. Technol., 29, 57–69, 1998.
Andreae, M. O. and Gelencs´er, A.: Black carbon or brown carbon? The nature of light-absorbing aerosols, Atmos. Chem. Phys., 6, 3131–3148, 2006,
http://www.atmos-chem-phys.net/6/3131/2006/.
Arnott, W. P., Moosm¨uller, H., Sheridan, P. J., Ogren, J. A., Raspert, R., Slaton, W. V., Hand, J. L., Kreidenweis, S. M., and Collett Jr., J. L.: Photoacoustic and filter-based ambient aerosol light absorption measurements: instrument comparisons and the role of relative humidity, J. Geophys. Res., 108, 4034, doi:10.1029/2002JD002165, 2003.
Baumgardner, D., Raga, G. B., Kok, G., Ogren, J., Rosas, I., B´aez, A., and Novakov, T.: On the evolution of aerosol properties at a mountain site above Mexico City, J. Geophys. Res., 105, 22 243– 22 253, 2000.
Baumgardner, D. and Clarke, A.: Changes in aerosol properties with relative humidity in the remote southern hemisphere
ma-rine boundary layer, J. Geophys. Res., 103(D13), 16 525–16 534, doi:10.1029/98JD00688, 1998.
Baumgardner, D., Raga, G., Peralta, O., Rosas, I., Castro, T., Kuhlbusch, T., John, A., and Petzold, A.: Diagnos-ing black carbon trends in large urban areas usDiagnos-ing carbon monoxide measurements, J. Geophys. Res., 107(D21), 8342, doi:10.1029/2001JD000626, 2002.
Birch, M. E. and Cary, R. A.: Elemental carbon-based method for monitoring occupational exposures to particulate diesel exhaust, Aerosol Sci. Technol., 25, 221–241, 1996.
Bond, T. C., Anderson, T. L., and Campbell, D.: Calibration and intercomparison of filter-based measurements of visible light ab-sorption by aerosols, Aerosol Sci. Technol., 30, 582–600, 1999. Bond, T. C. and Bergstrom, R. W.: Light absorption by
carbona-ceous particles: an investigative review. Aerosol Sci. Technol., 40, 27–67, doi:10.1080/02786820500421521, 2006.
Bond., T. C., Habib, G., and Bergstrom, R. W.: Limitations in the enhancement of visible light absorption due to mixing state, J. Geophys. Res., 111, D20211, doi:10.1029/2006JD007315, 2006. Carrico, C. M., Kus, P., Rood, M. J., Quinn, P. K., and Bates, T. S.: Mixtures of pollution, dust, sea salt, and volcanic aerosol during ACE-Asia: Radiative properties as a func-tion of relative humidity, J. Geophys. Res., 108(D23), 8650, doi:10.1029/2003JD003405, 2003.
Chung, S. H. and Seinfeld, J. H.: Global distribution and climate forcing of carbonaceous aerosols, J. Geophys. Res., 107(D19), 4407, doi:10.1029/2001JD001397, 2002.
Doran, J. C., Abbott, J. L., Archuleta, J., Bian, X., Chow, J. C., Coulter, R. L., de Wekker, S. F. J., Edgerton, S. A., Fernandez, A., Fast, J. D., Hubbe, J. M., King, C. W., Langley, D., Leach, J. M., Lee, J. T., Martin, T. J., Martinez, D., Martinez, J. L., Mer-cado, G., Mora, V., Mulhearn, M., Pena, J. L., Petty, R., Porch, W. M., Russell, C., Salas, R., Shannon, J. D., Shaw, W. J., Sosa, G., Watson, J. G., Templeman, B., White, R., Whiteman, C. D., and Wolfe, D.: The IMADA-AVER boundary layer experiment in the Mexico City area, Bull. Am. Meteorol. Soc., 79, 2497– 2508, 1998.
Fuller, K. A., Malm, W. C., and Kreidenweis, S. M.: Effects of mix-ing on extinction by carbonaceous particles, J. Geophys., Res., 104, 15 941–15 954, 1999.
Harrison, L., Michalsky, J., and Berndt, J.: Automated multifil-ter rotating shadow-band radiomemultifil-ter: an instrument for optical depth and radiation measurements, Appl. Opt., 33, 5118–5125, 1994.
Heintzenberg, J., Charlson, R. J., Clarke, A. D., Liousse, C., Ramaswamy, V., Shine, K. P., Wendisch, M., and Helas, G.: Measurements and modeling of aerosol single-scattering albedo: Progress, problems, and prospects, Beitr. Phys. Atmosph., 70, 249–263, 1997.
Horvath, H.: Atmospheric light absorption – A review, Atmos. En-viron., 27A(3), 293–317, 1993.
Im, J.-S., Saxena, V. K., and Wenny, B. N.: An assessment of hy-groscopic growth factors for aerosols in the surface boundary layer for computing direct radiative forcing, J. Geophys. Res., 106(D17), 20 213–20 224, doi:10.1029/2000JD000152, 2001. Jacobson, M. Z.: Isolating nitrated and aromatic aerosols and
ni-trated aromatic gases as sources of ultraviolet light absorption, J. Geophys. Res.-A, 104(D3), 3527–3542, 1999.
Jacobson, M. Z.:. Strong radiative heating due to the mixing state
of black carbon in atmospheric aerosols, Nature, 409, 695–696, 2001.
Jacobson, M. Z. and Seinfeld, J. H.: Evolution of nanoparticle size and mixing state near the point of emission, Atmos. Environ., 38, 1839–1850, 2004.
Johnson, K. S., Zuberi, B., Molina, L. T., Molina, M. J., Iedema, M. J., Cowin, J. P., Gaspar, D. J., Wang, C., and Laskin, A.: Processing of soot in an urban environment: case study from the Mexico City Metropolitan Area, Atmos. Chem. Phys., 5, 3033– 3043, 2005,
http://www.atmos-chem-phys.net/5/3033/2005/.
Kassianov, E., Barnard, J., and Ackerman, T. P.: Retrieval of aerosol microphysical properties using surface multifilter rotating shad-owband radiometer (MFRSR) data: modeling and observations, J. Geophys. Res., 110, D09201, doi:10.1029/2004JD005337, 2005.
Kirchstetter, T. W., Novakov, T., and Hobbs, P. V.: Evidence that the spectral dependence of light absorption by aerosols is af-fected by organic carbon, J. Geophys. Res.-A, 109, D21208, doi:10.1029/2004JD004999, 2004.
Liousse, C., Cachier, H., and Jennings, S. G.: Optical and thermal measurements of black carbon aerosol content in different en-vironments: variation of the specific attenuation cross-section, sigma (σ ), Atmos. Environ., 27A, 1203–1211, 1993.
Mallet, M., Roger, J. C., Despiau, S., Dubovik, O., and Putaud, J. P.: Microphysical and optical properties of aerosol particles in urban zone during ESCOMPTE, Atmos. Res., 69, 73–97, 2003. Markowicz, K. M., Flatau, P. J., Quinn, P. K., Carrico, C. M., Flatau,
M. K., Vogelmann, A. M., Bates, D., Liu, M., and Rood, M. J.: Influence of relative humidity on aerosol radiative forcing: An ACE-Asia experiment perspective, J. Geophys. Res., 108(D23), 8662, doi:10.1029/2002JD003066, 2003.
Marley, N. A., Gaffney, J. S., Baird, C., Blazer, C. A., Drayton, P. J., and Frederick, J. E.: An empirical method for the determination of the complex refractive index of size-fractionated atmospheric aerosols for radiative transfer calculations, Aerosol Sci. Technol., 34(6), 535–549, 2001.
Mikhailov, E. F., Vlasenko, S. S., Podgorny, I. A., Ramanathan, V., and Corrigan, C. E.: Optical properties of soot-water drop agglomerates: an experimental study, J. Geophys. Res., 111, D07209, doi:10.1029/2005JD006389, 2006.
Moosm¨uller, H., Arnott, W. P., Rogers, C. F., Chow, J. C., Frazier, C. A., Sherman, L. E., and Dietrich, D. L.: Photoacoustic and filter measurements related to aerosol light absorption during the Northern Front Range Air Quality Study (Colorado 1996/1997), J. Geophys. Res., 103(D21), 28 149–28 157, 1998.
Morse, C. S., Goodrich, R. K., and Cornman, L. B.: The NIMA method for improved moment estimation from Doppler spectra, J. Atmos. Oceanic Technol., 19, 274–295, 2002.
Nemesure, S., Wagener, R., and Schwartz, S. E.: Direct shortwave forcing of climate by the anthropogenic sulfate aerosol: sensitiv-ity to particle size, composition, and relative humidsensitiv-ity, J. Geo-phys. Res., 100(D12), 26 105–26 116, doi:10.1029/95JD02897, 1995.
Penner, J. E, Chang, C. C., and Grant, K.: Climate forcing by car-bonaceous and sulfate aerosols, Clim. Dyn., 14, 839–851, 1998. Petzold, A., Kopp, C., and Niessner, R.: The dependence of the specific attenuation cross-section on black carbon mass fraction and particle size, Atmos. Environ., 35(5), 661–672, 1997.
Redemann, J., Russell, P. B., and Hamill, P.: Dependence of aerosol light absorption and single-scattering albedo on ambient relative humidity for sulfate aerosols with black carbon cores, J. Geophys. Res., 106(D21), 27 487–27 496, doi:10.1029/2001JD900231, 2001.
Sato, M., Hansen, J., Koch, D., Lacis, A., Ruedy, R., Dubovik, O., Holben, B., Chin, M., and Novakov, T.: Global atmospheric black carbon inferred from AERONET, Proc. Natl. Acad. Sci., 100, 6319–6324, 2003.
Schnaiter, M., Horvath, H., M¨ohler, O., Naumann, K.-H., Saathoff, H., and Sch¨ock, O. W.: UV-VIS-NIR spectral optical properties of soot and soot-containing aerosols, J. Aerosol Sci., 34, 1421– 1444, 2003.
Schuster, G. L., Dubovik, O., Holben, B. N., and Clothiaux, E. C.: Inferring black carbon content and specific absorption from Aerosol Robotic Network (AERONET) aerosol retrievals, J. Geophys. Res., 110, D10S17, doi:10.1029/2004JD004548, 2005.
Sokolik, I. N. and Toon, O. B.: Incorporation of mineralogical com-position of aerosols into models of radiative properties of min-eral aerosol from the UV to IR wavelengths, J. Geophys. Res.-A, 104(D8), 9423–9444, 1999.
Volkamer, R., Jimenez, J. L., San Martini, F., Dzepina, K., Zhang, Q., Salcedo, D., Molina, L. T., Worsnop, D. R., and Molina, M. J.: Secondary organic aerosol Formation from anthropogenic air pollution: rapid and higher than expected, Geophys. Res. Lett., 33, L17811, doi:10.1029/2006GL026899, 2006.
Waggoner, A. P., Weiss, R. E., Ahlquist, N. C., Covert, D. S., Will, S., and Charlson, R. J.: Optical characteristics of atmospheric aerosols, Atmos. Environ., 15, 1891–1909, 1981.