HAL Id: hal-00302940
https://hal.archives-ouvertes.fr/hal-00302940
Submitted on 4 Jul 2007HAL is a multi-disciplinary open access
archive for the deposit and dissemination of sci-entific research documents, whether they are pub-lished or not. The documents may come from teaching and research institutions in France or abroad, or from public or private research centers.
L’archive ouverte pluridisciplinaire HAL, est destinée au dépôt et à la diffusion de documents scientifiques de niveau recherche, publiés ou non, émanant des établissements d’enseignement et de recherche français ou étrangers, des laboratoires publics ou privés.
Source apportionment of fine organic aerosol in Mexico
City during the MILAGRO Experiment 2006
E. A. Stone, D. C. Snyder, R. J. Sheesley, A. P. Sullivan, R. J. Weber, J. J.
Schauer
To cite this version:
E. A. Stone, D. C. Snyder, R. J. Sheesley, A. P. Sullivan, R. J. Weber, et al.. Source apportionment of fine organic aerosol in Mexico City during the MILAGRO Experiment 2006. Atmospheric Chemistry and Physics Discussions, European Geosciences Union, 2007, 7 (4), pp.9635-9661. �hal-00302940�
ACPD
7, 9635–9661, 2007 Source apportionment of fine organic aerosol during MILAGRO E. A. Stone et al. Title Page Abstract Introduction Conclusions References Tables Figures ◭ ◮ ◭ ◮ Back CloseFull Screen / Esc
Printer-friendly Version Interactive Discussion Atmos. Chem. Phys. Discuss., 7, 9635–9661, 2007
www.atmos-chem-phys-discuss.net/7/9635/2007/ © Author(s) 2007. This work is licensed
under a Creative Commons License.
Atmospheric Chemistry and Physics Discussions
Source apportionment of fine organic
aerosol in Mexico City during the
MILAGRO Experiment 2006
E. A. Stone1, D. C. Snyder1, R. J. Sheesley1, A. P. Sullivan2, R. J. Weber2, and J. J. Schauer1
1
Environmental Chemistry and Technology, University of Wisconsin-Madison, Madison, WI, USA, 53706, USA
2
School of Earth and Atmospheric Sciences, Georgia Institute of Technology, Atlanta, GA, USA, 30332, USA
Received: 19 June 2007 – Accepted: 27 June 2007 – Published: 4 July 2007 Correspondence to: J. J. Schauer ([email protected])
ACPD
7, 9635–9661, 2007 Source apportionment of fine organic aerosol during MILAGRO E. A. Stone et al. Title Page Abstract Introduction Conclusions References Tables Figures ◭ ◮ ◭ ◮ Back CloseFull Screen / Esc
Printer-friendly Version Interactive Discussion
Abstract
Organic carbon (OC) comprises a large fraction of fine particulate matter (PM2.5) in Mexico City. Daily and select 12-h PM2.5 samples were collected in urban and pe-ripheral sites in Mexico City from 17–30 March 2006. Samples were analyzed for OC and elemental carbon (EC) using thermal-optical filter-based methods. Real-time
5
water-soluble organic carbon (WSOC) was collected at the peripheral site. Organic compounds, particularly molecular markers, were quantified by soxhlet extraction with methanol and dichloromethane, derivitization, and gas chromatography with mass spectrometric detection (GCMS). A chemical mass balance model (CMB) based on molecular marker species was used to determine the relative contribution of major
10
sources to ambient OC. Motor vehicles, including diesel and gasoline, consistently accounted for 47% of OC in the urban area and 31% on the periphery. The daily con-tribution of biomass burning to OC was highly variable, and ranged from 5–30% at the urban site and 11–50% at the peripheral site. The remaining OC unapportioned to primary sources showed a strong correlation with WSOC and was considered to be
15
secondary in nature. Comparison of temporally resolved OC showed that contributions from primary aerosol sources during daylight hours were not significantly different from nighttime. This study provides quantitative understanding of the important sources of OC during the MILAGRO 2006 field campaign.
1 Introduction 20
The Megacity Impacts on Regional and Global Environment (MIRAGE) study of the at-mosphere in Mexico City, as part of the Megacity Initiative: Local and Global Research Observations (MILAGRO), targets the chemical characterization and transformation of atmospheric pollutants generated in and transported from the urban area (NCAR/EOL, 2006). The air pollution generated in megacities poses a threat to human health and
25
the environment; Mexico City has experienced extreme urbanization in the last century 9636
ACPD
7, 9635–9661, 2007 Source apportionment of fine organic aerosol during MILAGRO E. A. Stone et al. Title Page Abstract Introduction Conclusions References Tables Figures ◭ ◮ ◭ ◮ Back CloseFull Screen / Esc
Printer-friendly Version Interactive Discussion which has caused many environmental problems, including severe air pollution (Molina
and Molina, 2004). This capital city and its nearly 20 million inhabitants reside in an elevated basin, 2240 m above sea level nearly surrounded by mountain ranges. Air-borne PM frequently exceeds maximum concentrations allowed by air quality standards (Molina and Molina, 2004) and high levels of PM have been associated with negative
5
health impacts (Dockery et al., 1992; Saldiva et al., 1995; Schwartz and Marcus, 1990). Aerosols may play an important role in the radiative balance of the earth through the direct absorption or reflection of incident solar radiation or indirectly as cloud conden-sation nuclei (CCN) (Sun and Ariya, 2006). The climate forcing of aerosols generated in the Mexico City metropolitan area may affect the surrounding region.
10
Mexico City has been the location of several air pollution field studies in the last half-century. The majority of these studies have focused on the elemental composition of PM (Raga et al., 2001); approximately half of the total aerosol mass in Mexico City was observed to be organic matter (Chow et al., 2002; Edgerton et al., 1999; Salcedo et al., 2006). PM2.5analyzed at six locations in urban Mexico City from 2–19 March 2003 had
15
an average organic carbon (OC) concentration of 9.98 µg m−3and an elemental carbon (EC) concentration of 5.82 µg m−3(Chow et al., 2002). These levels are comparable to those observed in downtown Los Angeles, California (LA) (Schauer et al., 1996) and in three Chinese megacities, Beijing, Shanghai, and Guangzhou, during the summertime (Feng et al., 2006).
20
The primary sources contributing to fine particle OC in Mexico City have not pre-viously been studied and source reconciliation has been limited. One multivariate analysis of PM2.5 mass based on inorganic species found major primary sources to be industry, wind-blown soil, and biomass burning (Johnson et al., 2006). There is reason to believe, however, that additional sources to PM2.5 are important, although
25
they may not have inorganic chemical signatures. Emissions inventories for gas-phase pollutants in Mexico City have pointed towards motor vehicles as their most substantial source (Schifter et al., 2004) which makes it likely that motor vehicles are also a major source of ambient PM. Several studies of fine particle OC have identified diurnal trends
ACPD
7, 9635–9661, 2007 Source apportionment of fine organic aerosol during MILAGRO E. A. Stone et al. Title Page Abstract Introduction Conclusions References Tables Figures ◭ ◮ ◭ ◮ Back CloseFull Screen / Esc
Printer-friendly Version Interactive Discussion in ambient concentration that correspond temporally to traffic patterns, which support
this hypothesis (Chow et al., 2002; Marr et al., 2006; Salcedo et al., 2006). To compre-hensively understand the sources of OC, source apportionment should be based on specific organic compounds.
The goal of the research presented in this paper was to determine the important
5
sources of organic aerosol in Mexico City and quantitatively assess their mass con-tributions. This was accomplished through quantification of OC, EC, water-soluble or-ganic carbon (WSOC), and solvent-extractable oror-ganic molecular markers in PM2.5and chemical mass balance (CMB) modeling. This study assessed the temporal variability of organic species and important aerosol sources. The geographic variability of OC
10
was evaluated by comparing samples collected at an urban site in Mexico City and a peripheral site, located on the outskirts of the metropolitan area. This study aims to provide a concrete understanding of the primary sources of OC in Mexico City to compliment future analysis of secondary organic aerosol (SOA) processing.
2 Methods
15
2.1 Sample collection
The data discussed in this paper was obtained from filter samples collected in Mexico City, D.F. and its environs from 17–30 March 2006. The urban site (MILAGRO site T0) was located in downtown Mexico City (9.488 N, –99.147, 2240 m a.s.l.) and was selected to characterize fresh aerosols generated in the metropolitan area. At this
20
site, PM samplers were located on the roof of building #20 approximately 20 m above ground level on the campus of Instituto Mexicano del Petr ´oleo (IMP, Mexican Institute of Petroleum), located on the northern edge of the city. IMP is surrounded by a mixture of residential, commercial, and light industrial areas which include high motor vehicle traffic corridors. Activities surrounding this area included significant amounts of idling
25
or slow-moving traffic, especially during morning rush hour periods. 9638
ACPD
7, 9635–9661, 2007 Source apportionment of fine organic aerosol during MILAGRO E. A. Stone et al. Title Page Abstract Introduction Conclusions References Tables Figures ◭ ◮ ◭ ◮ Back CloseFull Screen / Esc
Printer-friendly Version Interactive Discussion The peripheral site (MILAGRO site T1), was selected in order to characterize a
mix-ture of fresh and aged aerosols. The peripheral site was located on the outskirts of Mexico City, approximately 35 km northeast of T0 (19.703 N, –98.982, 2273 m a.s.l.). Samplers were located at ground level on the campus of Universidad Tecnologica de Tecamac. This site was located in a rural agricultural area where significant
re-5
suspension of dust occurred. Compared to the urban site, vehicular traffic along adja-cent roadways was light to moderate. Rain events occurred on 23 and 25–30 March 2006.
Particles were collected using a medium-volume PM2.5sampler (URG Corp., Chapel Hill, NC, USA) with a Teflon-coated aluminum cyclone inlet that selected aerosol with
10
aerodynamic diameter less than 2.5 µm. Air flow through the filter was controlled by critical orifices and was measured before and after sample collection with a rotameter. Particles were collected on quartz fiber filters (QFF) (90 mm, Tissuquartz, Pall Life Sci-ences). Prior to sample collection QFF were baked at 550C for a minimum of 18 h to remove organic species. Before and after particle collection, QFF were stored in
alu-15
minum foil-lined Petri dishes sealed with Teflon tape. The sample date corresponded to the day that particle collection began. Daytime samples were collected from 06:00 to 18:00 CST, nighttime samples from 18:00 to 06:00, and 24-h samples began at 06:00. At the urban site, errors in labeling 12-h samples occurred from 19 March 18:00 to 21 March 18:00. The 19 March 18:00 sample was a field blank making PM data not
20
available. The chronology of 20 and 21 March samples was reconciled by comparison to co-located chemical measurements.
2.2 Chemical analysis
EC and OC were measured in the laboratory using a Thermal Optical Analyzer (Sun-set Laboratory, Forest Grove OR) by the ACE-Asia method (Schauer et al., 2003).
25
Reported ambient concentrations of EC and OC have been field blank subtracted. The uncertainty for EC and OC measurements was calculated as the sum of the instrument uncertainty, the standard deviation of the field blanks, and five percent of the
ACPD
7, 9635–9661, 2007 Source apportionment of fine organic aerosol during MILAGRO E. A. Stone et al. Title Page Abstract Introduction Conclusions References Tables Figures ◭ ◮ ◭ ◮ Back CloseFull Screen / Esc
Printer-friendly Version Interactive Discussion ment. At the peripheral site, WSOC was measured using an online particle-into-liquid
instrument coupled to a Total Organic Carbon analyzer (Sullivan et al., 2004).
Solvent-extractable organic species were quantified using gas chromatography mass spectrometry (GCMS) (Sheesley et al., 2004). Filters were spiked with isotopically-labelled internal recovery standards and extracted with methanol and methylene
chlo-5
ride using Soxhlets. The filter extract was derivatized using diazomethane which converted carboxylic acids to methyl esters (Schauer et al., 2002). A second de-rivitization with N,O-bis-(trimethylsilyl)trifluoroacetamide and 1% Trimethylchlorosilane (Fluka, Buchs, Switzerland) silylated hydroxyl substituents which allowed quantifica-tion of cholesterol and levoglucosan (Nolte et al., 2002) was also performed. Reported
10
ambient concentrations have been field blank subtracted. The uncertainty of the or-ganic species mass concentrations was based upon the standard deviation of the field blanks, experimentally determined analytical uncertainty, and projected uncertainty as-sociated with filter extraction.
2.3 Source apportionment
15
The contributions of primary aerosol sources to ambient OC were calculated using software available from the United States Environmental Protection Agency (EPA-CMB version 8.2). The (EPA-CMB model solved for the effective-variance least-squares solution to the linear combination of the product of the source contribution and its concentration of a set of molecular marker species observed in ambient aerosol
20
(Watson et al., 1984). This model has been successfully used to apportion source contributions to ambient PM (Schauer et al., 2002). Detailed chemical profiles for primary sources were compiled from available literature and encompassed vegeta-tive detritus (Rogge et al., 1993a); natural gas (Rogge et al., 1993b); motor ve-hicles including diesel, gasoline, and representative gasoline smoker (Lough et al.,
25
ACPD
7, 9635–9661, 2007 Source apportionment of fine organic aerosol during MILAGRO E. A. Stone et al. Title Page Abstract Introduction Conclusions References Tables Figures ◭ ◮ ◭ ◮ Back CloseFull Screen / Esc
Printer-friendly Version Interactive Discussion 2007); and woodsmoke based on the average reported in (Sheesley, 20071) with data
from (Fine et al., 2004a). The chemical species included in the model were EC, C28-C34 n-alkanes, levoglucosan, 17α(H)-22,29,30-trisnorhopane, 17β(H)-21α(H)-30-norhopane, 17α(H)-21β(H)-hopane, benzo(b)fluoranthene, benzo(k)fluoranthene, benzo(e)pyrene, indeno(1,2,3-cd)pyrene, and benzo(ghi)perylene.
5
3 Results and discussion
3.1 EC and OC
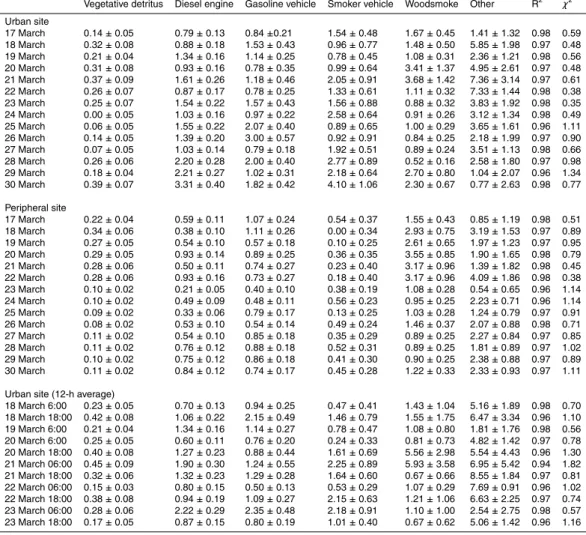
The 24-h average PM2.5 EC and OC concentrations for urban and peripheral Mexico City are plotted in Fig. 1. At the urban site, OC concentrations ranged from 6.18– 16.25 µg C m−3 and EC concentrations ranged from 2.37–9.15 µg C m−3 as shown in
10
Table 1. The average OC and EC concentrations at the urban site were 9.79 µg C m−3 and 4.03 µg C m−3, respectively. These values are comparable to previous studies in urban Mexico City (Chow et al., 2002; Edgerton et al., 1999; Salcedo et al., 2006) and to other megacities (Feng et al., 2006; Schauer et al., 1996). At the peripheral site, carbonaceous aerosol components were roughly half as abundant. OC concentrations
15
ranged from 2.71–9.38 µg C m−3 and EC ranged from 0.70–2.79 µg C m−3. The aver-age OC concentration was 5.71 µg C m−3 while EC was 1.82 µg C m−3. The decrease in carbonaceous aerosol concentrations from the urban site to the peripheral site was expected because of reduced primary sources in the outskirts of the city.
3.2 Molecular markers
20
A series of polyaromatic hydrocarbons (PAH), n-alkanes, n-alkanoic and aromatic car-boxylic acids, and highly-specific molecular markers were measured for 24-h samples
1
Sheesley, R. J., Scahuer, J. J., Zheng, M., and Wang, B.: North Carolina Paper, in review, 2007.
ACPD
7, 9635–9661, 2007 Source apportionment of fine organic aerosol during MILAGRO E. A. Stone et al. Title Page Abstract Introduction Conclusions References Tables Figures ◭ ◮ ◭ ◮ Back CloseFull Screen / Esc
Printer-friendly Version Interactive Discussion at the urban and peripheral sites. A molecular marker for organic PM is a compound
that is highly specific to a single source category and is stable in the atmosphere. Levoglucosan, an anhydrous carbohydrate, is a well-established biomarker for the combustion of biomass materials (Simoneit, 2002). The pyrolysis product of cellulose, a major component of plant material, is levoglucosan and this compound accounts
5
for approximately 15% of primary fine particle OC resulting from biomass burning (Sheesley, 20071). Levoglucosan partitions to the particle-phase in the atmosphere and does not degrade (Fraser & Lakshmanan, 2000). This biomarker has been used to quantify ambient PM derived from biomass burning (Simoneit et al., 1999).
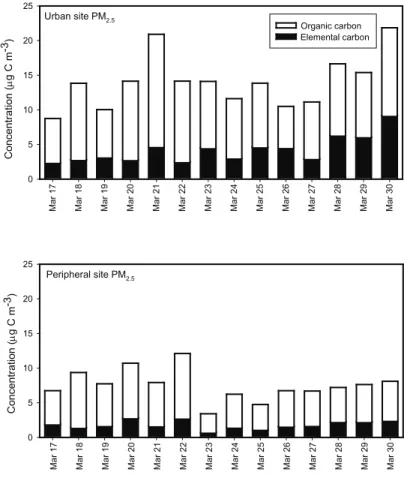
In this study, 24-h average concentrations of levoglucosan are presented in Fig. 2
10
for urban and peripheral sites. Levoglucosan was detected in all samples at both sites as shown in Table 1. At the urban site, levoglucosan concentrations ranged from 74–260 ng m−3, except for 20 and 21 March when concentrations reached 738 and 860 ng m−3 and 29 and 30 March when concentrations reached 536 ng m−3 and 379 ng m−3, respectively. At the peripheral site, the average levoglucosan
concentra-15
tion was 404 ng m−3from 17–22 March and dropped to 134 ng m−3from 23–30 March. Biomass burning was more consistent at the peripheral site while more episodic emis-sions affected the urban area. There was little correlation between levoglucosan con-centrations at the urban site and the peripheral site (R2=0.07) and this data suggests that primary biomass combustion at the urban and peripheral sites were isolated from
20
each other.
Hopanes are a well-established molecular marker for fossil fuel-derived PM in the ambient atmosphere (Simoneit, 1999). Fossil fuel combustion encompasses several primary aerosol source categories: motor vehicles, coal-burning power plants, and fuel oil-burning power plants. In general, hopanes are less likely to be impacted by industrial
25
point sources than other organic species, like PAH. Further distinction between mobile and industrial source categories is possible if additional marker species are present. Picene, for example, is specific to coal-burning (Oros and Simoneit, 2000) and can be used to infer whether or not coal-fired power plants are a major contributor to ambient
ACPD
7, 9635–9661, 2007 Source apportionment of fine organic aerosol during MILAGRO E. A. Stone et al. Title Page Abstract Introduction Conclusions References Tables Figures ◭ ◮ ◭ ◮ Back CloseFull Screen / Esc
Printer-friendly Version Interactive Discussion OC. Fossil fuel source categories can also be distinguished from one another based
on their temporal variability. It is expected that industrial point sources, like power plants, have consistent emissions from day to day and vary only on longer time scales. Emissions from motor vehicles, however, vary on much shorter time scales; diurnal (Chow et al., 2002; Marr et al., 2006; Salcedo et al., 2006) and weekly (Bae et al.,
5
2004) emission trends have been observed in urban areas. It is expected that driving patterns differ on weekends, especially with regard to commuter traffic. In Mexico City, the “Hoy no circula” (HNC, “Not driving today”) restrictions are enforced only on weekdays which may correlate to different types of vehicles being driven on weekends (Salcedo et al., 2006). In the absence of industrial sources, hopanes have been used
10
to trace PM generated by both gasoline and diesel-powered motor vehicles (Schauer et al., 1999; Schauer et al., 2002).
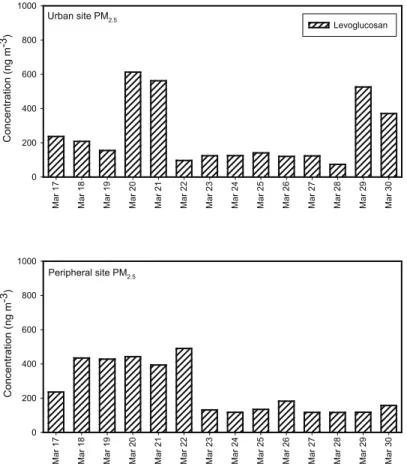
The 24-h average concentrations for a series of three hopanes, 17α(H)-22,29,30-trisnorhopane, 17β(H)-21α(H)-30-norhopane, and 17α(H)-21β(H)-hopane, are pre-sented in Fig. 3 for urban and peripheral sites. Hopanes were detected in all of the
15
24-h average samples at both sites. The average total concentration of these three compounds at the urban site was 1.48 ng m−3 and was 0.50 ng m−3at the peripheral site as shown in Table 1. A study of the same hopane series that took place in urban LA reported concentrations ranging from 0.8–1.4 ng m−3in PM2.5for a 3.5 h sampling time (Fine et al., 2004b)
20
The ambient concentrations of these three hopanes were consistently lower on the weekends compared to the weekdays over the course of this study. Weekends are defined as Saturday and Sunday and include 18, 19, 25, and 26 March; the average of all weekend samples was compared to the average of all weekday samples. The average weekday hopane concentration exceeded the average weekend concentration
25
by 13% at the urban site and 30% at the peripheral site. This temporal trend gives credence to the hypothesis that motor vehicles are the major source of hopanes at the urban site in Mexico City. Picene was not detected at either site over the course of the study which further eliminates coal-fired power plants as a major source of OC at the
ACPD
7, 9635–9661, 2007 Source apportionment of fine organic aerosol during MILAGRO E. A. Stone et al. Title Page Abstract Introduction Conclusions References Tables Figures ◭ ◮ ◭ ◮ Back CloseFull Screen / Esc
Printer-friendly Version Interactive Discussion urban or peripheral sites. The observations in this study and previous studies (Chow
et al., 2002; Marr et al., 2006; Salcedo et al., 2006; Schifter et al., 2004) suggest that motor vehicles are a substantial source of OC in Mexico City and it is concluded that observed particle-phase hopanes predominantly resulted from motor vehicle sources in this study.
5
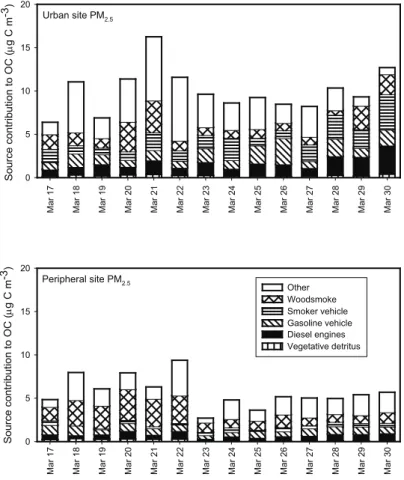
3.3 Source apportionment
A molecular marker CMB analysis was used to determine the relative contribution of major sources to ambient fine organic aerosol in urban and peripheral Mexico City. Contributions of vegetative detritus, diesel engines, gasoline vehicles, smoking vehi-cles, woodsmoke, and non-apportioned or other sources of ambient OC for a 24-h
10
sampling period are presented in Fig. 4 and summarized in Table 2. Natural gas com-bustion was considered to be a potential aerosol source, but contributed a negligible amount to OC at both urban and peripheral sties. Soil was not included as a poten-tial source of OC in this study because a source profile specific to Mexico City and its environs was not available and Si and Al measurements were not made. If soil was a
15
source of OC, its contribution would remain unapportioned.
Vegetative detritus accounted for approximately 0.2 µg m−3 of OC at both locations in Mexico City, which corresponds to 2.1% of OC at the urban site and 3.0% of OC at the peripheral site. The mass contribution of vegetative detritus is comparable to that in downtown LA determined to be 0.24 µg m−3 during a source apportionment
20
study in 1982 (Schauer et al., 1996). The contribution of vegetative detritus to OC was significantly higher at the peripheral site during the beginning of the study when precipitation events did not occur (0.28, standard deviation 0.04, n=6) compared to the end of the study which was marked by rain events (0.11, standard deviation 0.04, n=8). This result suggests that the vegetative detritus contribution to OC changes with
25
weather conditions.
The PM2.5 collected at the urban and peripheral sites was heavily influenced by motor vehicles. The relative contributions of diesel engines, gasoline vehicles, and
ACPD
7, 9635–9661, 2007 Source apportionment of fine organic aerosol during MILAGRO E. A. Stone et al. Title Page Abstract Introduction Conclusions References Tables Figures ◭ ◮ ◭ ◮ Back CloseFull Screen / Esc
Printer-friendly Version Interactive Discussion smoking vehicles to OC were calculated by the CMB model based on average source
profiles generated by a comprehensive study of motor vehicle emissions (Lough et al., 2007). A smoking vehicle is a high-emitting vehicle that releases visible amounts of smoke and/or produces more than 50 mg of EC per mile (Lough et al., 2007).
On average, the sum of the contributions from diesel engines, gasoline vehicles, and
5
smoking vehicles accounted for 47% of observed OC at the urban site. Here, diesel engines were the major source of EC and consistently accounted for 88% of the ob-served ambient concentration. The contribution of motor vehicles on OC was reduced by a factor of three at the peripheral site relative to the downtown site. This reduction in the absolute contribution of motor vehicles to OC at the periphery is expected
be-10
cause motor vehicle traffic is lighter. Here, motor vehicles accounted for 31% of OC on average and diesel engines produced 82% of EC.
Gasoline vehicles exhibited a weekly trend in the downtown area. Properly function-ing (non-smokfunction-ing) vehicles accounted for 37% (standard deviation 7%) of gasoline-powered motor vehicle OC on weekdays and 67% (standard deviation 8%) on
week-15
ends. This result suggests that different types of cars were driven on weekends and weekdays. A similar trend was observed on the periphery of the city, but was less pronounced. This implies that the peripheral site is influenced by local motor vehicle traffic and that that weekly vehicular patterns are similar in the downtown area and the perimeter of the city.
20
Woodsmoke was an important primary source of OC in downtown Mexico City, sec-ond only to motor vehicles. In the urban area, woodsmoke accounted for 5–30% of observed OC on a daily basis and its mass contribution ranged from 0.52–3.68 µg m−3 as shown in Table 2. The contribution of woodsmoke to OC on the periphery of Mex-ico City ranged from 11–50% and its mass contribution ranged from 0.89–3.55 µg m−3.
25
These results are comparable to a source apportionment study that occurred in down-town LA during 1982, where the average annual contribution of woodsmoke to fine particle OC was determined to be 1.85±0.31 µg m−3(Schauer et al., 1996).
At the urban site, woodsmoke contributions to ambient OC were pronounced on 9645
ACPD
7, 9635–9661, 2007 Source apportionment of fine organic aerosol during MILAGRO E. A. Stone et al. Title Page Abstract Introduction Conclusions References Tables Figures ◭ ◮ ◭ ◮ Back CloseFull Screen / Esc
Printer-friendly Version Interactive Discussion 20, 21, 29, and 30 March compared to other days. The irregular occurrence of wood
burning as a major source of OC indicates that it was a point source that sporadi-cally affected the urban site. The woodsmoke contribution to OC at the peripheral site was not as temporally irregular. Rather, the woodsmoke contributions were high-est for the first six days during which the average contribution was 2.83 µg m−3and
5
subsequently decreased to an average value of 1.05 µg m−3 for the remainder of the study. This temporal trend is analogous to vegetative detritus. Elevated amounts of woodsmoke aerosol at the downtown site did not correspond to elevated woodsmoke aerosol on the perimeter of the city. This was particularly noticeable on 29 and 30 March when woodsmoke contributions reach 2.70 and 2.30 µg m−3 at the urban site
10
while woodsmoke contributions fell below average at the peripheral site. This temporal discrepancy suggests that the woodsmoke events that affected the urban area did not affect the periphery.
At the peripheral site, woodsmoke contributions to OC were highly correlated with vegetative detritus contributions (R2=0.85). At this site, woodsmoke and vegetative
15
detritus likely comprised a single source: biomass burning. Open burning of biomass material generates aerosols containing carbonaceous plant material or vegetative de-tritus that are suspended into the atmosphere by thermally-driven convection. It is likely that this type of process is responsible for the woodsmoke aerosol on the perimeter of the city. The woodsmoke contribution at the urban site has a much weaker correlation
20
with vegetative detritus (R2=0.28), either because of additional sources of vegetative detritus at the urban site or the different nature of biomass burning within the urban area. It has been suggested that cottage industries, such as adobe brick-making and tile-making, are primary sources of biomass burning in the urban area (Raga et al., 2001). These controlled wood-burning processes are not expected to suspend
signif-25
icant amounts of vegetative detritus like an open biomass burn would. The results of this study suggest that the aerosol generated by biomass burning on the perimeter of the city is chemically different than the point-source wood-burning events that pollute the downtown area.
ACPD
7, 9635–9661, 2007 Source apportionment of fine organic aerosol during MILAGRO E. A. Stone et al. Title Page Abstract Introduction Conclusions References Tables Figures ◭ ◮ ◭ ◮ Back CloseFull Screen / Esc
Printer-friendly Version Interactive Discussion Other sources of aerosol, which were not included in the CMB model, contributed
to a major portion of OC at both the urban and peripheral sites. OC unapportioned to primary sources accounted for 6–63% of ambient OC at the urban site and 10–46% at the peripheral site as shown in Table 2. The true source of the unapportioned OC could include unknown or uncharacterized primary sources such as soil. In a study where the
5
primary sources of OC were limited, the unapportioned OC was attributed to secondary sources (Sheesley et al., 2004). Secondary transformation of gas-phase volatile or semi-volatile organic species may occur by photochemical oxidation. The addition of oxygen to carbonaceous compounds decreases volatility and increases partitioning to the condensed, or aerosol, phase. Oxidation products are expected to be more
water-10
soluble than their precursors because of increased polarity and potential for hydrogen-bonding. The mass contribution of secondary sources to OC would be expected to correlate with the mass concentration of WSOC. It is notable that fine particle WSOC is also produced by biomass burning; 71% of organic aerosol in a biomass event has been found to be water-soluble (Sannigrahi et al., 2006).
15
In this study, ambient fine particle WSOC concentrations were measured only at the peripheral site. The biomass contribution to OC was estimated to be 71% water-soluble (Sannigrahi et al., 2006). The sum of the unapportioned OC and the biomass contribution to WSOC are compared to ambient WSOC measurements in Figure 5. A positive correlation is observed (R2=0.75). The slope deviates from unity and indicates
20
that the modeled WSOC overestimates ambient observations by 17%. This may be caused by the presence of additional primary sources, an overestimation of WSOC in woodsmoke, or experimental artifacts. The robustness of the correlation, however, sug-gests that the unapportioned OC is water-soluble. This result precludes soil from being an important primary source because the OC in soil is primarily hydrophobic since
hy-25
drophilic compounds would be washed out by precipitation. Secondary sources are considered to be the major uncharacterized source of OC at the urban and peripheral sites.
ACPD
7, 9635–9661, 2007 Source apportionment of fine organic aerosol during MILAGRO E. A. Stone et al. Title Page Abstract Introduction Conclusions References Tables Figures ◭ ◮ ◭ ◮ Back CloseFull Screen / Esc
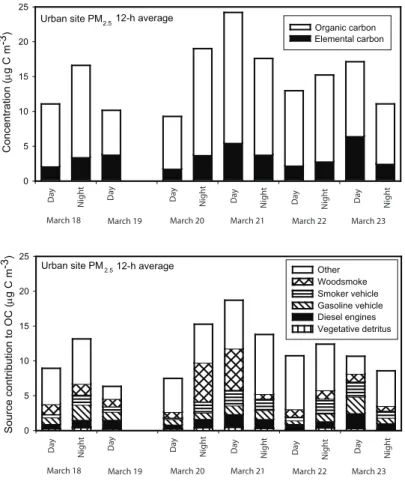
Printer-friendly Version Interactive Discussion 3.4 Daytime v nighttime
EC and OC concentrations in the urban site averaged over a 12-h period for 18–24 March 2006 are shown in Fig. 6. The daytime samples correspond to daylight hours and were collected from 06:00 to 18:00 local time and vice versa for nighttime samples. There is no pattern of EC and OC at night compared to daytime. This result indicates
5
that EC and OC concentrations were more strongly influenced by primary sources and meteorology than time of day.
The source contributions to daytime and nighttime OC are presented in Fig. 6. There are no statistically significant differences between sources of OC during the nighttime and daytime, as shown in Table 2. However, there is an average reduction in the diesel
10
engine contribution to OC by 13% during the nighttime, suggesting that diesel traffic is heavier during the daytime. Additionally, the contribution of vegetative detritus to OC is 23% greater at night than during the day.
The chemical composition of the aerosol was not statistically different between day and night, but showed variability in relation to primary sources. Pinonic acid, for
ex-15
ample, is an expected secondary organic species that has been formed in chamber studies by the photochemical oxidation of α-pinene (Yu et al., 1999). This compound is expected to form only during daylight hours. However, a previous study reported el-evated pinonic acid concentrations at night relative to daytime and attributed this result to the semi-volatile nature of this compound and enhanced partitioning to the particle
20
phase at lower temperatures (Cahill et al., 2006). Pinonic acid was observed in every 12-h sample collected at the urban site in Mexico City. The 12-h daytime average was not statistically different from the nighttime average. The 12-h daytime average pinonic acid concentration ranged from 2.7–8.5 ng m−3and the nighttime concentration ranged from 5.3–28.2 ng m−3. The maximum 12-h average nighttime concentration occurred
25
on 21 March and the maximum daytime concentration occurred on the following day. The time period of elevated pinonic acid corresponded to maximum OC contributions from secondary sources and immediately followed the period of elevated woodsmoke.
ACPD
7, 9635–9661, 2007 Source apportionment of fine organic aerosol during MILAGRO E. A. Stone et al. Title Page Abstract Introduction Conclusions References Tables Figures ◭ ◮ ◭ ◮ Back CloseFull Screen / Esc
Printer-friendly Version Interactive Discussion This result suggests that pinonic acid is formed in the atmosphere and is associated
with woodsmoke events. It also supports the conclusion of this study that secondary sources contributed to ambient OC at the urban and peripheral sites.
4 Conclusions
Ambient aerosol collected at urban and peripheral sites in Mexico City were heavily
im-5
pacted by primary emissions from motor vehicles and biomass combustion in addition to secondary aerosol formed in the atmosphere. Motor vehicles contributed on average 47% of ambient OC at the urban site and 31% at the peripheral site. The daily con-tribution of motor vehicles to PM2.5 was fairly consistent over the course of the study but varied between weekdays and weekends. Woodsmoke episodes occurred
spo-10
radically at the urban site and accounted for 5-30% of ambient OC, whereas biomass burning more regularly affected the perimeter of the city and accounted for 11–50% of OC. Mutually inconsistent temporal patterns and chemical signatures of woodsmoke indicate that the peripheral site was influenced by local aerosol sources rather than urban outflow. The unapportioned OC plus the water-soluble fraction of woodsmoke
15
correlated well with WSOC which implicated SOA as an important component of both urban and peripheral OC. Comparison of 12-h samples collected in daylight to those collected at night revealed that primary source contributions were not strongly depen-dant on time of day. This study provides a quantitative understanding and analysis of important sources to OC collected at urban and peripheral sites in Mexico City during
20
the MILAGRO field campaign from 17–30 March 2006.
Acknowledgements. This research was funded by the National Science Foundation (NSF). We
thank Rodrigo Gonzales Abraham, Gustavo Sosa, and Andrew Rutter for technical support at the urban site and Luz Padro for sample collection at the peripheral site. We also thank Jeff DeMinter and Brandon Shelton at the Wisconsin State Laboratory of Hygiene for filter 25
preparation and analysis.
ACPD
7, 9635–9661, 2007 Source apportionment of fine organic aerosol during MILAGRO E. A. Stone et al. Title Page Abstract Introduction Conclusions References Tables Figures ◭ ◮ ◭ ◮ Back CloseFull Screen / Esc
Printer-friendly Version Interactive Discussion
References
Bae, M. S., Schauer, J. J., DeMinter, J. T., and Turner, J. R.: Hourly and daily patterns of particle-phase organic and elemental carbon concentrations in the urban atmosphere, J. Air Waste Manage. Assoc., 54(7), 823–833, 2004.
Cahill, T. M., Seaman, V. Y., Charles, M. J., Holzinger, R., and Goldstein, A. H.: Secondary 5
organic aerosols formed from oxidation of biogenic volatile organic compounds in the Sierra Nevada Mountains of California, J. Geophys. Res.-Atmos., 111(D16), D16312, 2006. Chow, J. C., Watson, J. G., Edgerton, S. A., Vega, E., and Ortiz, E.: Spatial differences in
outdoor PM10 mass and aerosol composition in Mexico City, J. Air Waste Manage. Assoc., 52(4), 423–434, 2002.
10
Dockery, D. W., Schwartz, J., and Spengler, J. D.: Air-Pollution And Daily Mortality - Associa-tions With Particulates And Acid Aerosols, Environ. Res., 59(2), 362–373, 1992.
Edgerton, S. A., Bian, X., Doran, J.C., Fast, J.D., Hubbe, J. M., Malone, E. L., Shaw, W.J., Whiteman, C.D., Zhong, S., Arriaga, J. L., Ortiz, E., Ruiz, M., Sosa, G., Vega, E., Limon, T., Guzman, F., Archuleta, J., Bossert, J. E., Elliot, S. M., Lee, J. T., McNair, L. A., Chow, J. C., 15
Watson, J.G., Coulter, R. L., Doskey, P. V., Gaffney, J. S., Marley, N. A., Neff, W., and Petty, R.: Particulate air pollution in Mexico City: A collaborative research project, J. Air Waste Manage. Assoc., 49(10), 1221–1229, 1999.
Feng, J. L., Hu, M., Chan, C. K., Lau, P. S., Fang, M., He, L. Y., and Tang, X. Y.: A comparative study of the organic matter in PM2.5 from three Chinese megacities in three different climatic 20
zones, Atmos. Environ., 40(21), 3983–3994, 2006.
Fine, P. M., Cass, G. R., and Simoneit, B. R. T.: Chemical characterization of fine particle emissions from the wood stove combustion of prevalent United States tree species, Environ. Eng. Sci., 21(6), 705–721, 2004a.
Fine, P. M., Chakrabarti, B., Krudysz, M., Schauer, J. J., and Sioutas, C.: Diurnal variations 25
of individual organic compound constituents of ultrafine and accumulation mode particulate matter in the Los Angeles basin, Environ. Sci. Technol., 38(5), 1296–1304, 2004b.
Fraser, M. P. and Lakshmanan, K.: Using levoglucosan as a molecular marker for the long-range transport of biomass combustion aerosols, Environ. Sci. Technol., 34(21), 4560–4564, 2000.
30
Johnson, K. S., de Foy, B., Zuberi, B., Molina, L. T., Molina, M. J., Xie, Y., Laskin, A., and Shut-thanandan, V.: Aerosol composition and source apportionment in the Mexico City
ACPD
7, 9635–9661, 2007 Source apportionment of fine organic aerosol during MILAGRO E. A. Stone et al. Title Page Abstract Introduction Conclusions References Tables Figures ◭ ◮ ◭ ◮ Back CloseFull Screen / Esc
Printer-friendly Version Interactive Discussion
tan Area with PIXE/PESA/STIM and multivariate analysis, Atmos. Chem. Phys., 6, 4591– 4600, 2006,
http://www.atmos-chem-phys.net/6/4591/2006/.
Lough, G. C., Christenson, C. C., Schauer, J. J., Tortorelli, J., Bean, E., Lawson, D., Clark, N. N., and Gabele, P. A.: Development of Molecular Marker Source Profiles for Emissions from 5
On-Road Gasoline and Diesel Vehicle Fleets, J. Air Waste Manage. Assoc., accepted, 2007. Marr, L. C., Dzepina, K., Jimenez, J. L., Reisen, F., Bethel, H. L., Arey, J., Gaffney, J. S.,
Marley, N. A., Molina, L. T., and Molina, M. J.: Sources and transformations of particle-bound polycyclic aromatic hydrocarbons in Mexico City, Atmos. Chem. Phys., 6, 1733–1745, 2006,
10
http://www.atmos-chem-phys.net/6/1733/2006/.
Molina, L. T. and Molina, M. J.: Improving air quality in megacities - Mexico City Case Study, Ur-ban Biosphere And Society: Partnership Of Cities, 1023, Annals Of The New York Academy Of Sciences, pp. 142–158, 2004.
NCAR/EOL, MILAGRO-2006http://www.eol.ucar.edu/projects/milagro, 2006. 15
Nolte, C. G., Schauer, J. J., Cass, G. R., and Simoneit, B. R. T.: Trimethylsilyl derivatives of organic compounds in source samples and in atmospheric fine particulate matter, Environ. Sci. Technol., 36(20), 4273–4281, 2002.
Oros, D. R. and Simoneit, B. R. T.: Identification and emission rates of molecular tracers in coal smoke particulate matter, Fuel, 79(5), 515–536, 2000.
20
Raga, G. B., Baumgardner, D., Castro, T., Martinez-Arroyo, A., and Navarro-Gonzalez, R.: Mexico City air quality: a qualitative review of gas and aerosol measurements (1960–2000), Atmos. Environ., 35(23), 4041–4058, 2001.
Rogge, W. F., Hildemann, L. M., Mazurek, M. A., Cass, G. R., and Simoneit, B. R. T.: Sources Of Fine Organic Aerosol.4. Particulate Abrasion Products From Leaf Surfaces Of Urban Plants, 25
Environ. Sci. Technol., 27(13), 2700–2711, 1993a.
Rogge, W. F., Hildemann, L. M., Mazurek, M. A., Cass, G. R., and Simoneit, B. R. T.: Sources Of Fine Organic Aerosol.5. Natural-Gas Home Appliances, Environ. Sci. Technol., 27(13), 2736–2744, 1993b.
Salcedo, D., Onasch, T. B., Dzepina, K., Canagaratna, M. R., Zhang, Q., Huffman, J. A., De-30
Carlo, P. F., Jayne, J. T., Mortimer, P., Worsnop, D. R., Kolb, C. E., Johnson, K. S., Zuberi, B., Marr, L. C., Volkamer, R., Molina, L. T., Molina, M.J., Cardenas, B., Bernabe, R. M., Marquez, C., Gaffney, J. S., Marley, N. A., Laskin, A., Shutthanandan, V., Xie, Y., Brune, W.,
ACPD
7, 9635–9661, 2007 Source apportionment of fine organic aerosol during MILAGRO E. A. Stone et al. Title Page Abstract Introduction Conclusions References Tables Figures ◭ ◮ ◭ ◮ Back CloseFull Screen / Esc
Printer-friendly Version Interactive Discussion
Lesher, R., Shirley, T., and Jimenez, J. L.: Characterization of ambient aerosols in Mexico City during the MCMA-2003 campaign with Aerosol Mass Spectrometry: results from the CENICA Supersite, Atmos. Chem. Phys., 6, 925–946, 2006,
http://www.atmos-chem-phys.net/6/925/2006/.
Saldiva, P. H. N., Pope, C. A., Schwartz, J., Dockery, D. W., Lichtenfels, A. J., Salge, J. M., 5
Barone, I., and Bohm, G. M.: Air-Pollution And Mortality In Elderly People – A Time-Series Study In Sao-Paulo, Brazil, Archives Of Environmental Health, 50(2), 159–163, 1995. Sannigrahi, P., Sullivan, A. P., Weber, R. J., and Ingall, E. D.: Characterization of water-soluble
organic carbon in urban atmospheric aerosols using solid-state C-13 NMR spectroscopy, Environ. Sci. Technol., 40(3), 666–672, 2006.
10
Schauer, J. J., Kleeman, M. J., Cass, G. R., and Simoneit, B. R. T.: Measurement of emissions from air pollution sources. 2. C-1 through C-30 organic compounds from medium duty diesel trucks, Environ. Sci. Technol., 33(10), 1578–1587, 1999.
Schauer, J. J., Kleeman, M. J., Cass, G. R., and Simoneit, B. R. T.: Measurement of emissions from air pollution sources. 5. C-1-C-32 organic compounds from gasoline-powered motor 15
vehicles, Environ. Sci. Technol., 36(6), 1169–1180, 2002.
Schauer, J. J., Mader, B. T., Deminter, J. T., Heidemann, G., Bae, M. S., Seinfeld, J. H., Flagan, R. C., Cary, R. A., Smith, D., Huebert, B. J., Bertram, T., Howell, S., Kline, J. T., Quinn, P., Bates, T., Turpin, B., Lim, H. J., Yu, J. Z., Yang, H., and Keywood, M. D.: ACE-Asia intercomparison of a thermal-optical method for the determination of particle-phase organic 20
and elemental carbon, Environ. Sci. Technol., 37(5), 993–1001, 2003.
Schauer, J. J., Rogge, W. F., Hildemann, L. M., Mazurek, M. A., and Cass, G. R.: Source apportionment of airborne particulate matter using organic compounds as tracers, Atmos. Environ., 30(22), 3837–3855, 1996.
Schifter, I., Diaz, L., Avalos, S., Vera, N., Mejia, I., Reyes, F., and Lopez-Salinas, E.: Trends of 25
exhaust emissions from gasoline motor vehicles in the metropolitan area of Mexico city, Int. J. Environ. Pollut., 21(2), 166–174, 2004.
Schwartz, J. and Marcus, A.: Mortality And Air-Pollution In London - A Time-Series Analysis, Am. J. Epidemiol., 131(1), 185–194, 1990.
Sheesley, R. J., Schauer, J. J., Bean, E., and Kenski, D.: Trends in secondary organic aerosol 30
at a remote site in Michigan’s upper peninsula, Environ. Sci. Technol., 38(24), 6491–6500, 2004.
Simoneit, B. R. T.: A review of biomarker compounds as source indicators and tracers for air
ACPD
7, 9635–9661, 2007 Source apportionment of fine organic aerosol during MILAGRO E. A. Stone et al. Title Page Abstract Introduction Conclusions References Tables Figures ◭ ◮ ◭ ◮ Back CloseFull Screen / Esc
Printer-friendly Version Interactive Discussion
pollution, Environ. Sci. Pollut. Res., 6(3), 159–169, 1999.
Simoneit, B. R. T.: Biomass burning – A review of organic tracers for smoke from incomplete combustion, Appl. Geochem., 17(3), 129–162, 2002.
Simoneit, B. R. T., Schauer, J. J., Nolte, C. G., Oros, D. R., Elias, V. O., Fraser, M. P., Rogge, W. F., and Cass, G. R.: Levoglucosan, a tracer for cellulose in biomass burning and atmospheric 5
particles, Atmos. Environ., 33(2), 173–182, 1999.
Sullivan, A. P., Weber, R. J., Clements, A. L., Turner, J. R., Bae, M. S., and Schauer, J. J.: A method for on-line measurement of water-soluble organic carbon in ambient
aerosol particles: Results from an urban site, Geophys. Res. Lett., 31(13), L13105,
doi:10.1029/2004GL019681, 2004. 10
Sun, J. M. and Ariya, P. A.: Atmospheric organic and bio-aerosols as cloud condensation nuclei (CCN): A review, Atmos. Environ., 40(5), 795–820, 2006.
Watson, J. G., Cooper, J. A., and Huntzicker, J. J.: The Effective Variance Weighting For Least-Squares Calculations Applied To The Mass Balance Receptor Model, Atmos. Environ., 18(7), 1347–1355, 1984.
15
Weather Underground,http://www.weatherunderground.org, 2006.
Yu, J. Z., Cocker, D. R., Griffin, R. J., Flagan, R. C., and Seinfeld, J. H.: Gas-phase ozone oxidation of monoterpenes: Gaseous and particulate products, J. Atmos. Chem., 34(2), 207– 258, 1999.
ACPD
7, 9635–9661, 2007 Source apportionment of fine organic aerosol during MILAGRO E. A. Stone et al. Title Page Abstract Introduction Conclusions References Tables Figures ◭ ◮ ◭ ◮ Back CloseFull Screen / Esc
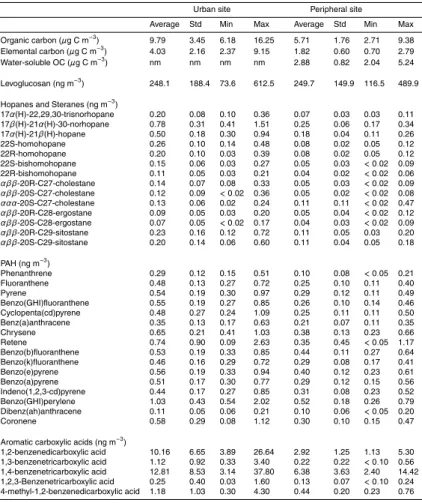
Printer-friendly Version Interactive Discussion Table 1. Summary of organic carbon analyses at urban and peripheral sties, based on a 24-h
sampling time.
Urban site Peripheral site
Average Std Min Max Average Std Min Max Organic carbon (µg C m−3) 9.79 3.45 6.18 16.25 5.71 1.76 2.71 9.38 Elemental carbon (µg C m−3 ) 4.03 2.16 2.37 9.15 1.82 0.60 0.70 2.79 Water-soluble OC (µg C m−3 ) nm nm nm nm 2.88 0.82 2.04 5.24 Levoglucosan (ng m−3 ) 248.1 188.4 73.6 612.5 249.7 149.9 116.5 489.9 Hopanes and Steranes (ng m−3
) 17α(H)-22,29,30-trisnorhopane 0.20 0.08 0.10 0.36 0.07 0.03 0.03 0.11 17β(H)-21α(H)-30-norhopane 0.78 0.31 0.41 1.51 0.25 0.06 0.17 0.34 17α(H)-21β(H)-hopane 0.50 0.18 0.30 0.94 0.18 0.04 0.11 0.26 22S-homohopane 0.26 0.10 0.14 0.48 0.08 0.02 0.05 0.12 22R-homohopane 0.20 0.10 0.03 0.39 0.08 0.02 0.05 0.12 22S-bishomohopane 0.15 0.06 0.03 0.27 0.05 0.03 <0.02 0.09 22R-bishomohopane 0.11 0.05 0.03 0.21 0.04 0.02 <0.02 0.06 αββ-20R-C27-cholestane 0.14 0.07 0.08 0.33 0.05 0.03 <0.02 0.09 αββ-20S-C27-cholestane 0.12 0.09 <0.02 0.36 0.05 0.02 <0.02 0.08 ααα-20S-C27-cholestane 0.13 0.06 0.02 0.24 0.11 0.11 <0.02 0.47 αββ-20R-C28-ergostane 0.09 0.05 0.03 0.20 0.05 0.04 <0.02 0.12 αββ-20S-C28-ergostane 0.07 0.05 <0.02 0.17 0.04 0.03 <0.02 0.09 αββ-20R-C29-sitostane 0.23 0.16 0.12 0.72 0.11 0.05 0.03 0.20 αββ-20S-C29-sitostane 0.20 0.14 0.06 0.60 0.11 0.04 0.05 0.18 PAH (ng m−3 ) Phenanthrene 0.29 0.12 0.15 0.51 0.10 0.08 <0.05 0.21 Fluoranthene 0.48 0.13 0.27 0.72 0.25 0.10 0.11 0.40 Pyrene 0.54 0.19 0.30 0.97 0.29 0.12 0.11 0.49 Benzo(GHI)fluoranthene 0.55 0.19 0.27 0.85 0.26 0.10 0.14 0.46 Cyclopenta(cd)pyrene 0.48 0.27 0.24 1.09 0.25 0.11 0.11 0.50 Benz(a)anthracene 0.35 0.13 0.17 0.63 0.21 0.07 0.11 0.35 Chrysene 0.65 0.21 0.41 1.03 0.38 0.13 0.23 0.66 Retene 0.74 0.90 0.09 2.63 0.35 0.45 <0.05 1.17 Benzo(b)fluoranthene 0.53 0.19 0.33 0.85 0.44 0.11 0.27 0.64 Benzo(k)fluoranthene 0.46 0.16 0.29 0.72 0.29 0.08 0.17 0.41 Benzo(e)pyrene 0.56 0.19 0.33 0.94 0.40 0.12 0.23 0.61 Benzo(a)pyrene 0.51 0.17 0.30 0.77 0.29 0.12 0.15 0.56 Indeno(1,2,3-cd)pyrene 0.44 0.17 0.27 0.85 0.31 0.08 0.23 0.52 Benzo(GHI)perylene 1.03 0.43 0.54 2.02 0.52 0.18 0.26 0.79 Dibenz(ah)anthracene 0.11 0.05 0.06 0.21 0.10 0.06 <0.05 0.20 Coronene 0.58 0.29 0.08 1.12 0.30 0.10 0.15 0.47 Aromatic carboxylic acids (ng m−3
) 1,2-benzenedicarboxylic acid 10.16 6.65 3.89 26.64 2.92 1.25 1.13 5.30 1,3-benzenetricarboxylic acid 1.12 0.92 0.33 3.40 0.22 0.22 <0.10 0.56 1,4-benzenetricarboxylic acid 12.81 8.53 3.14 37.80 6.38 3.63 2.40 14.42 1,2,3-Benzenetricarboxylic acid 0.25 0.40 0.03 1.60 0.13 0.07 <0.10 0.24 4-methyl-1,2-benzenedicarboxylic acid 1.18 1.03 0.30 4.30 0.44 0.20 0.23 0.76 Std = standard deviation nm = not measured 9654
ACPD
7, 9635–9661, 2007 Source apportionment of fine organic aerosol during MILAGRO E. A. Stone et al. Title Page Abstract Introduction Conclusions References Tables Figures ◭ ◮ ◭ ◮ Back CloseFull Screen / Esc
Printer-friendly Version Interactive Discussion Table 2. Source contributions in (µg C m−3) of primary sources determined by CMB.
Vegetative detritus Diesel engine Gasoline vehicle Smoker vehicle Woodsmoke Other R2 χ2
Urban site 17 March 0.14 ± 0.05 0.79 ± 0.13 0.84 ±0.21 1.54 ± 0.48 1.67 ± 0.45 1.41 ± 1.32 0.98 0.59 18 March 0.32 ± 0.08 0.88 ± 0.18 1.53 ± 0.43 0.96 ± 0.77 1.48 ± 0.50 5.85 ± 1.98 0.97 0.48 19 March 0.21 ± 0.04 1.34 ± 0.16 1.14 ± 0.25 0.78 ± 0.45 1.08 ± 0.31 2.36 ± 1.21 0.98 0.56 20 March 0.31 ± 0.08 0.93 ± 0.16 0.78 ± 0.35 0.99 ± 0.64 3.41 ± 1.37 4.95 ± 2.61 0.97 0.48 21 March 0.37 ± 0.09 1.61 ± 0.26 1.18 ± 0.46 2.05 ± 0.91 3.68 ± 1.42 7.36 ± 3.14 0.97 0.61 22 March 0.26 ± 0.07 0.87 ± 0.17 0.78 ± 0.25 1.33 ± 0.61 1.11 ± 0.32 7.33 ± 1.44 0.98 0.38 23 March 0.25 ± 0.07 1.54 ± 0.22 1.57 ± 0.43 1.56 ± 0.88 0.88 ± 0.32 3.83 ± 1.92 0.98 0.35 24 March 0.00 ± 0.05 1.03 ± 0.16 0.97 ± 0.22 2.58 ± 0.64 0.91 ± 0.26 3.12 ± 1.34 0.98 0.49 25 March 0.06 ± 0.05 1.55 ± 0.22 2.07 ± 0.40 0.89 ± 0.65 1.00 ± 0.29 3.65 ± 1.61 0.96 1.11 26 March 0.14 ± 0.05 1.39 ± 0.20 3.00 ± 0.57 0.92 ± 0.91 0.84 ± 0.25 2.18 ± 1.99 0.97 0.90 27 March 0.07 ± 0.05 1.03 ± 0.14 0.79 ± 0.18 1.92 ± 0.51 0.89 ± 0.24 3.51 ± 1.13 0.98 0.66 28 March 0.26 ± 0.06 2.20 ± 0.28 2.00 ± 0.40 2.77 ± 0.89 0.52 ± 0.16 2.58 ± 1.80 0.97 0.98 29 March 0.18 ± 0.04 2.21 ± 0.27 1.02 ± 0.31 2.18 ± 0.64 2.70 ± 0.80 1.04 ± 2.07 0.96 1.34 30 March 0.39 ± 0.07 3.31 ± 0.40 1.82 ± 0.42 4.10 ± 1.06 2.30 ± 0.67 0.77 ± 2.63 0.98 0.77 Peripheral site 17 March 0.22 ± 0.04 0.59 ± 0.11 1.07 ± 0.24 0.54 ± 0.37 1.55 ± 0.43 0.85 ± 1.19 0.98 0.51 18 March 0.34 ± 0.06 0.38 ± 0.10 1.11 ± 0.26 0.00 ± 0.34 2.93 ± 0.75 3.19 ± 1.53 0.97 0.89 19 March 0.27 ± 0.05 0.54 ± 0.10 0.57 ± 0.18 0.10 ± 0.25 2.61 ± 0.65 1.97 ± 1.23 0.97 0.95 20 March 0.29 ± 0.05 0.93 ± 0.14 0.89 ± 0.25 0.36 ± 0.35 3.55 ± 0.85 1.90 ± 1.65 0.98 0.79 21 March 0.28 ± 0.06 0.50 ± 0.11 0.74 ± 0.27 0.23 ± 0.40 3.17 ± 0.96 1.39 ± 1.82 0.98 0.45 22 March 0.28 ± 0.06 0.93 ± 0.16 0.73 ± 0.27 0.18 ± 0.40 3.17 ± 0.96 4.09 ± 1.86 0.98 0.38 23 March 0.10 ± 0.02 0.21 ± 0.05 0.40 ± 0.10 0.38 ± 0.19 1.08 ± 0.28 0.54 ± 0.65 0.96 1.14 24 March 0.10 ± 0.02 0.49 ± 0.09 0.48 ± 0.11 0.56 ± 0.23 0.95 ± 0.25 2.23 ± 0.71 0.96 1.14 25 March 0.09 ± 0.02 0.33 ± 0.06 0.79 ± 0.17 0.13 ± 0.25 1.03 ± 0.28 1.24 ± 0.79 0.97 0.91 26 March 0.08 ± 0.02 0.53 ± 0.10 0.54 ± 0.14 0.49 ± 0.24 1.46 ± 0.37 2.07 ± 0.88 0.98 0.71 27 March 0.11 ± 0.02 0.54 ± 0.10 0.85 ± 0.18 0.35 ± 0.29 0.89 ± 0.25 2.27 ± 0.84 0.97 0.85 28 March 0.11 ± 0.02 0.76 ± 0.12 0.88 ± 0.18 0.52 ± 0.31 0.89 ± 0.25 1.81 ± 0.89 0.97 1.02 29 March 0.10 ± 0.02 0.75 ± 0.12 0.86 ± 0.18 0.41 ± 0.30 0.90 ± 0.25 2.38 ± 0.88 0.97 0.89 30 March 0.11 ± 0.02 0.84 ± 0.12 0.74 ± 0.17 0.45 ± 0.28 1.22 ± 0.33 2.33 ± 0.93 0.97 1.11 Urban site (12-h average)
18 March 6:00 0.23 ± 0.05 0.70 ± 0.13 0.94 ± 0.25 0.47 ± 0.41 1.43 ± 1.04 5.16 ± 1.89 0.98 0.70 18 March 18:00 0.42 ± 0.08 1.06 ± 0.22 2.15 ± 0.49 1.46 ± 0.79 1.55 ± 1.75 6.47 ± 3.34 0.96 1.10 19 March 6:00 0.21 ± 0.04 1.34 ± 0.16 1.14 ± 0.27 0.78 ± 0.47 1.08 ± 0.80 1.81 ± 1.76 0.98 0.56 20 March 6:00 0.25 ± 0.05 0.60 ± 0.11 0.76 ± 0.20 0.24 ± 0.33 0.81 ± 0.73 4.82 ± 1.42 0.97 0.78 20 March 18:00 0.40 ± 0.08 1.27 ± 0.23 0.88 ± 0.44 1.61 ± 0.69 5.56 ± 2.98 5.54 ± 4.43 0.96 1.30 21 March 06:00 0.45 ± 0.09 1.90 ± 0.30 1.24 ± 0.55 2.25 ± 0.89 5.93 ± 3.58 6.95 ± 5.42 0.94 1.82 21 March 18:00 0.32 ± 0.06 1.32 ± 0.23 1.29 ± 0.28 1.64 ± 0.60 0.67 ± 0.66 8.55 ± 1.84 0.97 0.81 22 March 06:00 0.15 ± 0.03 0.80 ± 0.15 0.50 ± 0.13 0.53 ± 0.29 1.07 ± 0.29 7.69 ± 0.91 0.96 1.02 22 March 18:00 0.38 ± 0.08 0.94 ± 0.19 1.09 ± 0.27 2.15 ± 0.63 1.21 ± 1.06 6.63 ± 2.25 0.97 0.74 23 March 06:00 0.28 ± 0.06 2.22 ± 0.29 2.35 ± 0.48 2.18 ± 0.91 1.10 ± 1.00 2.54 ± 2.75 0.98 0.57 23 March 18:00 0.17 ± 0.05 0.87 ± 0.15 0.80 ± 0.19 1.01 ± 0.40 0.67 ± 0.62 5.06 ± 1.42 0.96 1.16 9655
ACPD
7, 9635–9661, 2007 Source apportionment of fine organic aerosol during MILAGRO E. A. Stone et al. Title Page Abstract Introduction Conclusions References Tables Figures ◭ ◮ ◭ ◮ Back CloseFull Screen / Esc
Printer-friendly Version Interactive Discussion Urban site PM2.5 M a r 1 7 M a r 1 8 M a r 1 9 M a r 2 0 M a r 2 1 M a r 2 2 M a r 2 3 M a r 2 4 M a r 2 5 M a r 2 6 M a r 2 7 M a r 2 8 M a r 2 9 M a r 3 0 0 5 10 15 20 25 Elemental carbon Organic carbon Peripheral site PM2.5 0 5 10 15 20 25 C o n c e n tr a ti o n (µ g C m -3) C o n c e n tr a ti o n (µ g C m -3) M a r 1 7 M a r 1 8 M a r 1 9 M a r 2 0 M a r 2 1 M a r 2 2 M a r 2 3 M a r 2 4 M a r 2 5 M a r 2 6 M a r 2 7 M a r 2 8 M a r 2 9 M a r 3 0
Fig. 1. Daily (24-h) EC and OC ambient mass concentrations for the urban and peripheral
sites.
ACPD
7, 9635–9661, 2007 Source apportionment of fine organic aerosol during MILAGRO E. A. Stone et al. Title Page Abstract Introduction Conclusions References Tables Figures ◭ ◮ ◭ ◮ Back CloseFull Screen / Esc
Printer-friendly Version Interactive Discussion C o n c e n tr a ti o n ( n g m -3) Urban site PM2.5 0 200 400 600 800 1000 Levoglucosan 0 200 400 600 800 1000 Peripheral site PM2.5 C o n c e n tr a ti o n ( n g m -3) M a r 1 7 M a r 1 8 M a r 1 9 M a r 2 0 M a r 2 1 M a r 2 2 M a r 2 3 M a r 2 4 M a r 2 5 M a r 2 6 M a r 2 7 M a r 2 8 M a r 2 9 M a r 3 0 M a r 1 7 M a r 1 8 M a r 1 9 M a r 2 0 M a r 2 1 M a r 2 2 M a r 2 3 M a r 2 4 M a r 2 5 M a r 2 6 M a r 2 7 M a r 2 8 M a r 2 9 M a r 3 0
Fig. 2. Daily average levoglucosan ambient mass concentrations for the urban and peripheral
sites.
ACPD
7, 9635–9661, 2007 Source apportionment of fine organic aerosol during MILAGRO E. A. Stone et al. Title Page Abstract Introduction Conclusions References Tables Figures ◭ ◮ ◭ ◮ Back CloseFull Screen / Esc
Printer-friendly Version Interactive Discussion 0.0 0.5 1.0 1.5 2.0 2.5 3.0 0.0 0.5 1.0 1.5 2.0 2.5 3.0 17α(H)-22,29,30-Trisnorhopane 17β(H)-21α(H)-30-Norhopane 17α(H)-21β(H)-Hopane Urban site PM2.5 Peripheral site PM2.5 C o n c e n tr a ti o n ( n g m -3) C o n c e n tr a ti o n ( n g m -3) M a r 1 7 M a r 1 8 M a r 1 9 M a r 2 0 M a r 2 1 M a r 2 2 M a r 2 3 M a r 2 4 M a r 2 5 M a r 2 6 M a r 2 7 M a r 2 8 M a r 2 9 M a r 3 0 M a r 1 7 M a r 1 8 M a r 1 9 M a r 2 0 M a r 2 1 M a r 2 2 M a r 2 3 M a r 2 4 M a r 2 5 M a r 2 6 M a r 2 7 M a r 2 8 M a r 2 9 M a r 3 0
Fig. 3. Daily ambient mass concentrations for a series of hopanes at the urban and peripheral
sites.
ACPD
7, 9635–9661, 2007 Source apportionment of fine organic aerosol during MILAGRO E. A. Stone et al. Title Page Abstract Introduction Conclusions References Tables Figures ◭ ◮ ◭ ◮ Back CloseFull Screen / Esc
Printer-friendly Version Interactive Discussion 0 5 10 15 20 Vegetative detritus Diesel engines Gasoline vehicle Smoker vehicle Woodsmoke Other 0 5 10 15 20 Urban site PM2.5 Peripheral site PM2.5 S o u rc e c o n tr ib u ti o n t o O C (µ g C m -3) S o u rc e c o n tr ib u ti o n t o O C (µ g C m -3) M a r 1 7 M a r 1 8 M a r 1 9 M a r 2 0 M a r 2 1 M a r 2 2 M a r 2 3 M a r 2 4 M a r 2 5 M a r 2 6 M a r 2 7 M a r 2 8 M a r 2 9 M a r 3 0 M a r 1 7 M a r 1 8 M a r 1 9 M a r 2 0 M a r 2 1 M a r 2 2 M a r 2 3 M a r 2 4 M a r 2 5 M a r 2 6 M a r 2 7 M a r 2 8 M a r 2 9 M a r 3 0
Fig. 4. Source contributions to ambient OC at the urban and peripheral sites determined by
CMB.
ACPD
7, 9635–9661, 2007 Source apportionment of fine organic aerosol during MILAGRO E. A. Stone et al. Title Page Abstract Introduction Conclusions References Tables Figures ◭ ◮ ◭ ◮ Back CloseFull Screen / Esc
Printer-friendly Version Interactive Discussion Real-time WSOC (µg C m-3) 0 2 4 6 8 0 2 4 6 8 y = 1.17x R2 = 0.75 C MB o th e r + w a te r-s o lu b le w o o d s mo k e (µ g C m -3 )
Fig. 5. A comparison of ambient real-time WSOC concentrations to the sum of the CMB other
contribution to OC and the water-soluble fraction of woodsmoke measured at the peripheral site.
ACPD
7, 9635–9661, 2007 Source apportionment of fine organic aerosol during MILAGRO E. A. Stone et al. Title Page Abstract Introduction Conclusions References Tables Figures ◭ ◮ ◭ ◮ Back CloseFull Screen / Esc
Printer-friendly Version Interactive Discussion Urban site PM 2.5 12-h average 0 5 10 15 20 25 0 5 10 15 20 25
Urban site PM2.5 12-h average
C o n c e n tr a ti o n (µ g C m -3) Elemental carbon Organic carbon
March 18 March 19 March 20 March 21 March 22 March 23
D a y Nigh t D a y Nigh t D a y Nigh t D a y Nigh t D a y Nigh t D a y Vegetative detritus Diesel engines Gasoline vehicle Smoker vehicle Woodsmoke Other S o u rc e c o n tr ib u ti o n t o O C (µ g C m -3)
March 18 March 19 March 20 March 21 March 22 March 23
D a y Nigh t D a y Nigh t D a y Nigh t D a y Nigh t D a y Nigh t D a y
Fig. 6. EC and OC ambient mass concentrations and source contributions to OC for select
12-h samples at the urban site. (Data for the night of 19 March is not available.).