HAL Id: hal-00303101
https://hal.archives-ouvertes.fr/hal-00303101
Submitted on 17 Sep 2007HAL is a multi-disciplinary open access
archive for the deposit and dissemination of sci-entific research documents, whether they are pub-lished or not. The documents may come from teaching and research institutions in France or abroad, or from public or private research centers.
L’archive ouverte pluridisciplinaire HAL, est destinée au dépôt et à la diffusion de documents scientifiques de niveau recherche, publiés ou non, émanant des établissements d’enseignement et de recherche français ou étrangers, des laboratoires publics ou privés.
Non-methane hydrocarbons source apportionment at
different sites in Mexico City during 2002?2003
E. Vega, G. Sanchez, L. Molina
To cite this version:
E. Vega, G. Sanchez, L. Molina. Non-methane hydrocarbons source apportionment at different sites in Mexico City during 2002?2003. Atmospheric Chemistry and Physics Discussions, European Geo-sciences Union, 2007, 7 (5), pp.13561-13596. �hal-00303101�
ACPD
7, 13561–13596, 2007 Source apportionment E. Vega et al. Title Page Abstract Introduction Conclusions References Tables Figures ◭ ◮ ◭ ◮ Back CloseFull Screen / Esc
Printer-friendly Version Interactive Discussion
EGU Atmos. Chem. Phys. Discuss., 7, 13561–13596, 2007
www.atmos-chem-phys-discuss.net/7/13561/2007/ © Author(s) 2007. This work is licensed
under a Creative Commons License.
Atmospheric Chemistry and Physics Discussions
Non-methane hydrocarbons source
apportionment at different sites in Mexico
City during 2002–2003
E. Vega1, G. Sanchez1, and L. Molina2,3
1
Instituto Mexicano del Petr ´oleo, Eje Central L ´azaro C ´ardenas Nm. 152.Col, San Bartolo Atepehuacan, Delegaci ´on Gustavo A. Madero, 07730, M ´exico, D.F., Mexico
2
Department of Earth, Atmospheric, and Planetary Sciences, Massachusetts Institute of Technology, Cambridge, MA, USA
3
Molina Center for Energy and the Environment, La Jolla, CA, USA
Received: 4 September 2007 – Accepted: 8 September 2007 – Published: 17 September 2007
ACPD
7, 13561–13596, 2007 Source apportionment E. Vega et al. Title Page Abstract Introduction Conclusions References Tables Figures ◭ ◮ ◭ ◮ Back CloseFull Screen / Esc
Printer-friendly Version Interactive Discussion
EGU
Abstract
The atmospheric concentrations of a variety of non-methane hydrocarbons (NMHC) collected at different sites, representing urban and rural environments within Mexico City Metropolitan Area (MCMA) during 1997, 2002 and 2003 field campaigns, were compared and used as an input for the Chemical Mass Balance (CMB) receptor model
5
to determine the source contribution of NMHC to the atmosphere. A common feature at all the locations was the dominance of alkenes (59%), aromatics (16%) and olefins (9%) in the average NMHC burden. At the urban sites the interquartile range of NMHC concentrations showed stabilization over this period with a slight increase in the con-centrations of propane and butanes in the southwest site of the MCMA in 2003 due
10
to the increased use of liquefied petroleum gas (LPG). The receptor model CMB ver-sion 8.0 was used to apportion the NMHC sources at six locations within the MCMA, representing the heavily industrialized, commercial, residential and rural areas. For the 2003 field campaign, the contribution of vehicular emissions dominated the NMHC con-centrations (19.7%±7.1% for gasoline vehicles and 35.4%±17.5% for diesel vehicles)
15
followed by the emissions of marketing and handling of LPG (29.9%±8.0%).
The NMHC concentrations showed a weekly cycle with the highest levels towards the end of the week and lowest at weekend and beginning of the week, suggesting that both emissions and accumulations process play a key role in building up NMHC levels. The toluene to benzene ratio was used to determine photochemical ageing of
20
the air samples during the 2003 field campaign. The database was divided into periods with similar wind circulation pattern; the results suggest that ageing process within the MCMA is generally suppressed by the amount of fresh emissions.
ACPD
7, 13561–13596, 2007 Source apportionment E. Vega et al. Title Page Abstract Introduction Conclusions References Tables Figures ◭ ◮ ◭ ◮ Back CloseFull Screen / Esc
Printer-friendly Version Interactive Discussion
EGU
1 Introduction
1.1 Background
Source based models have been used to identify and apportion non-methane hydro-carbons (NMHC) sources, which rely on the knowledge of emissions to predict their concentrations at different receptor sites (Scheff and Klevs, 1987; Li et al., 2003; Fujita
5
et al., 1994; Vega et al., 1997 and 2000; Viana, et al., 2007). The Chemical Mass Balance (CMB) receptor model infers source contributions by determining the best fit combination of chemical profiles of emission source needed to reconstruct the chem-ical composition of ambient samples. This model is deterministic and does not rely on statistical interferences since it uses the chemical and physical characteristics of
10
the gases (Watson et al., 1990, 1994; Core, 1987). It has been used in the analy-sis of suspended particles in the atmosphere (Watson et al., 1994; Vega et al., 1997) and was extended for the analysis of NMHC. The CMB model has also been used to evaluate the efficiency of specific control strategies associated with local air quality management programs and to estimate the emission inventory uncertainty (Scheff et
15
al., 1984), since it correlates the pollutants with their sources of emission.
Since 1990 several air quality management programs and control strategies to re-duce air pollution involving government, industry and inhabitants were implemented in Mexico City Metropolitan Area (MCMA) (Programa para Mejorar la Calidad del Aire en el Valle de Mexico 1995–2000) (Departamento del Distrito Federal, 1996). As a
20
consequence, concentrations of sulfur dioxide, carbon monoxide and lead have been successfully controlled, but high ozone and particulate matter are still the major at-mospheric pollution problem (Molina and Molina, 2002). Attention to the presence of atmospheric NMHC has been intensified because they are precursors to ozone and secondary organic aerosols and also because of their toxic and carcinogenic
proper-25
ties. To formulate and evaluate NMHC control strategies, the composition, location and concentration of these compounds must be determined.
ACPD
7, 13561–13596, 2007 Source apportionment E. Vega et al. Title Page Abstract Introduction Conclusions References Tables Figures ◭ ◮ ◭ ◮ Back CloseFull Screen / Esc
Printer-friendly Version Interactive Discussion
EGU concentrations of the most abundant NMHC which were measured during three field
campaigns (1997, 2002 and 2003) at several monitoring sites within the MCMA (Molina et al., 2007). The photochemical age of the air masses was deduced by obtaining the toluene/benzene ratio, and the results were also analyzed in terms of the wind flow pattern. The second part of this article discusses the results of source identification
5
and apportionment of NMHC to the atmosphere at four urban sites in the MCMA and two boundary sites within rural areas, applying the CMB receptor model.
1.2 CMB Receptor Model
The CMB modeling procedure requires: 1) identification of the contributing sources types; 2) selection of chemical species or other properties to be included in the
calcu-10
lation; 3) estimation of the fraction of each of the chemical species which is contained in each source type (source profiles); 4) estimation of the uncertainty in both ambient concentrations and source profiles; and 5) solution of the chemical mass balance equa-tions. The CMB is implicit in all factor analysis and multiple linear regression models that intend to quantitatively estimate source contributions (Watson, 1984). The basic
15
assumptions are: 1) composition of source emission are constant over the period of ambient and source sampling; 2) chemical species do not react with one another; 3) all sources which may significantly contribute to the receptor have been identified and their emissions characterized; 4) source profiles are linearly independent. The general equation is 20 Ci= P X j=i Fij· Sj
where Ci is the ambient concentration of the species “i” measured in the receptor site, P is the number of sources that contribute (j = 1, 2,... J), Fij is the fraction of the emissions of the species “i” starting from the source “j”, Sj is the impact to the receptor (calculated contribution) of the source “j”.
ACPD
7, 13561–13596, 2007 Source apportionment E. Vega et al. Title Page Abstract Introduction Conclusions References Tables Figures ◭ ◮ ◭ ◮ Back CloseFull Screen / Esc
Printer-friendly Version Interactive Discussion
EGU The parameters used to determine the performance of the model are: 1) R2
(mea-sures the variance in the receptor concentrations, which is explained by the calculated species concentrations, value 1); 2) Chi2(is the weighted sum of the squared of differ-ences between calculated and measured species divided by the effective variance and degrees of freedom; 3) percent of mass accounted for (is the ratio of the sum of the
5
source contributions to the measured mass (Gertler et al., 1996). Calculations of the source contributions for Mexico City were carried out using CMB version 8.0 available from the U.S. EPA/Desert Research Institute.
2 Methods
2.1 Sampling sites
10
The Mexican Petroleum Institute (IMP) conducted two sampling campaigns to obtain the ambient data during March 2002 and April-May 2003 at different sites with sampling periods of 3 hr from 6:00 to 9:00 a.m (Velasco et al., 2007). The sampling sites encom-pass residential, industrial and mixed settings, and all of them classified as urban sites. The Northeast site, Xalostoc (XAL), is under the influence of heavily travelled paved
15
and unpaved roads with old and new gasoline and diesel vehicles and historically has shown the highest concentrations of NMHC in Mexico City with major industrial activi-ties. La Merced (MER) site is located in the administrative district in Central city, under the influence of commercial activities, residential and heavily traveled paved roads with light-duty vehicles and modern heavy-duty diesel buses. The southwest site is located
20
in Pedregal (PED), in a residential area, with paved roads lightly travelled. The south-east site CENICA (CEN) is located near stone-cutting operations and heavily travelled paved and unpaved roads with old and new gasoline and diesel vehicles.
The Washington State University (WSU) conducted a sampling campaign to collect ambient air data during April 2003 at two boundary sites within rural areas (La Reforma
25
ACPD
7, 13561–13596, 2007 Source apportionment E. Vega et al. Title Page Abstract Introduction Conclusions References Tables Figures ◭ ◮ ◭ ◮ Back CloseFull Screen / Esc
Printer-friendly Version Interactive Discussion
EGU and Pedregal). The southwest site Santa Ana (SAN) is a rural site near Amecameca’s
Mountains surrounded by cactus fields and with paved and unpaved roads. The north-east site of La Reforma is a rural site located in the southwest of Pachuca (PAC), and close to urban areas with paved and unpaved roads.
2.2 Sampling
5
Sampling and analysis of ambient air and source emission profiles were carried out by IMP according to the Environmental Protection Agency (EPA) TO-14 method (Com-pendium method TO-14, 1988). The collection of ambient air samples was conducted using programmable ANDERSEN equipment (Arriaga et al., 1996), where sampling period and starting time of sampling were programmable. The portable equipment has
10
an electronic flow controller that allows the uptake of ambient air into the container to less than 25.0 psi. The feeding flow was adjusted prior to sampling to 66.6 ml/min. Sampling volumes were 6.0 litres taken throughout 3.0 hr. Samples for emission pro-files were collected directly in the sources using canisters of 0.8 litres capacity. A flow regulator of critical orifice was used to adjust the feeding flow between 80 to 13 ml/min
15
and therefore, to control the sampling time (Vega et al., 2000). Samplings carried out by WSU of ambient air were collected by using a XonTech, Inc. Air Sampler model 910PC (Velasco et al., 2007).
2.3 Analysis of samples
Samples collected at XAL, MER, PED and CEN by IMP were analyzed at the IMP
20
Atmospheric Chemistry Laboratory for NMHC (C2-C12 hydrocarbons). More than 200 compounds were determined although only a total of 49 species are reported, as they constitute more than 90% of the total NMHC mass. After cryogenic sam-ple concentration in a freeze-out loop made from chromatographic grade stainless steel tubing packed with 60/80 mesh deactivated glass beads, high-resolution
capil-25
ACPD
7, 13561–13596, 2007 Source apportionment E. Vega et al. Title Page Abstract Introduction Conclusions References Tables Figures ◭ ◮ ◭ ◮ Back CloseFull Screen / Esc
Printer-friendly Version Interactive Discussion
EGU Series II Plus) equipped with a 60 m Quadrex fused silica glass capillary column (0.32
i.d. and coated with a 1µm film thickness) at a flowrate of 2 ml/min. was used. The trap was then flushed-heated with boiling water and via a rotary valve (Six port Valco valve) switched to transfer the condensed NMHC into the GC equipment for analy-sis. The oven temperature started at −50◦C and was increased to 200◦C at a rate of
5
8◦C/min. The chromatograph was calibrated by injecting known amounts of a mixture of 55 hydrocarbons (Scott Specialty Gases NIST Traceable), and a certified mixture of 33 halogen-containing compounds (Spectra Gases, with 10% analytical accuracy). The detection limit was determined to be 1 ppbC (Velasco et al., 2007).
Samples collected at XAL, MER, PED, CEN, PAC and SAN by researchers from
10
WSU were analyzed by using a Hewlett-Packard 6890 Series chromatograph equipped with 30 m fused silica DB-1 column (0.32 i.d. and 1µm film thickness) with 2 ml/min car-rier flow. Prior to sampling injection, the oven was cooled to −50◦C. During analysis, the oven temperature was raised at 4◦C/min to a final temperature of 150◦C. Detector response was calibrated with NIST traceable 2,2-dimethylbutane standard; the
detec-15
tion limit was determined to be 20 pptC (Velasco et al., 2007). 2.4 Source fingerprints
It should be noted that the major limitation to source identification is to distinguish be-tween sources with similar emission source profile composition and also that a defini-tive emission profiles may not exist due to the complexity of the process itself, in
par-20
ticular combustion profiles. Further, vehicular emission profiles depend on numerous factors which may vary significantly from vehicle to vehicle using the same fossil fuel. Recently, Zavala et al. (2006) and Rogers et al. (2006) characterized real on-road emis-sions from specific types of vehicles using mobile laboratory operating in the “chase” mode during the MCMA-2002/2003 campaign and obtained mobile emissions of some
25
of the hydrocarbons, while Schifter et al. (2003, 2004) estimated on road emissions of total hydrocarbons from remote sensing measurements.
ACPD
7, 13561–13596, 2007 Source apportionment E. Vega et al. Title Page Abstract Introduction Conclusions References Tables Figures ◭ ◮ ◭ ◮ Back CloseFull Screen / Esc
Printer-friendly Version Interactive Discussion
EGU about the source sampling have been previously described (Vega et al., 2000) and
sim-ilar sampling procedures of sources were mentioned elsewhere (Vega et al., 2000b; S ´anchez et al., 2001; S ´anchez et al., 2004). The source profiles determined were: emissions of motor vehicle exhaust inside a tunnel and in dynamometer, hot soak mea-sured in parking lots, emissions of motor vehicle exhaust using diesel at cross roads
5
and inside parking lots, liquefied petroleum gas, asphalt plant, landfill, dry-cleaning us-ing perchloroethylene, degreasus-ing, paint used for vehicles, vinyl paints, varnishes used in furniture, graphic arts and food cooking processes (Vega et al., 2000). It should be mentioned that source profiles can be used as long as the process or the quality of each fuel type has not changed; the profiles are still representative of the emissions.
10
Sources were selected according to their contribution of NMHC to the environment (Departamento del Distrito Federal, 1996). Figure 1 shows examples of source profiles used in this work.
2.5 Uncertainties of source profiles
Source categories for NMHC were identified by means of cluster analysis using
STA-15
TISTICA v 5.1. The software was also used to calculate the variations between similar source profiles. Samples of each group were averaged to obtain the fraction of each NMHC in the profile. Uncertainties were calculated, as they are explicit inputs to the CMB model to calculate the standard error of the source contribution estimations and also to give less weight to those values that are near the detection limits. The
uncertain-20
ties reported in this paper were calculated as the standard deviations from averaging the results obtained for each source profile and their replicates (Watson, 1984). 2.6 Fitting species and source categories
Main fitting species used for modelling were: propane, butane, i-butane, acetylene, pentane, hexane, toluene, xylenes, MTBE, 2,2,4,trimethylpentane, 2methylpentane
25
ACPD
7, 13561–13596, 2007 Source apportionment E. Vega et al. Title Page Abstract Introduction Conclusions References Tables Figures ◭ ◮ ◭ ◮ Back CloseFull Screen / Esc
Printer-friendly Version Interactive Discussion
EGU and also because they are tracer of specific emission sources. The abundance of
these species should be different at each source. This difference is used by the model to apportion the contribution of emission sources at a specific receptor site. A total of 33 source profiles were grouped into six source categories to aid in the interpretation of results: 1) Liquefied petroleum gas (LPG), 2) degreasing processes using toluene,
5
m,p-xylenes, pentane and hexane (Degrease), 3) solvents used in paint, offset and graphic arts (Paint), 4) light-duty vehicle exhaust emissions, which were determined in tunnels, crossroads and dynamometer (Gasoline), 5) heavy-duty vehicle exhaust emissions, which were determined in tunnels, crossroad and parking lots (Diesel) and 6) non-identified sources (Other).
10
3 Results
3.1 Ambient concentrations of NMHC during 1997, 2002 and 2003 field campaigns The atmospheric levels of NMHC (ppbC) measured in the three field campaigns are described in Fig. 2 which contains the descriptive statistics for the sites and year. The wind roses are included to aid in the discussion of results in the following paragraphs.
15
Box-whisker plots on left side of Fig. 2 shows the results at the industrial site XAL, the NMHC median concentrations have shown small changes throughout time, fluctuating at around 2600 ppbC. The major changes were observed in the maximum levels which have decreased by about 1000 ppbC from 1997 to 2003. The site representing the commercial-residential zone MER, showed a clear reduction in the maximum levels
20
(by more than 3000 ppbC) from 1997 to 2002. As Fig. 2 shows, the highest concentra-tions (max=6677 ppbC, P75=5600 ppbC and P50=3900 ppbC) were measured at this site in 1997. The subsequent campaigns showed no major changes on the median concentrations, stabilizing at around 2500 ppbC. The PED site has been characterized by having the lowest concentrations of NMHC, as it has no major sources of pollution
25
ACPD
7, 13561–13596, 2007 Source apportionment E. Vega et al. Title Page Abstract Introduction Conclusions References Tables Figures ◭ ◮ ◭ ◮ Back CloseFull Screen / Esc
Printer-friendly Version Interactive Discussion
EGU that the levels of NMHC at this site had minor changes from 1997 to 2002 and a slight
increase in 2003, which was driven by the increment of propane and i-butane (Fig. 3). Regardless of the differences that each site presented, the 25–75 percentile range has narrowed indicating that atmospheric levels of NMHC are stabilizing throughout time, with median concentrations around 2500 ppbC at XAL and MER, and 1300 ppbC at
5
PED. These results agree with Velasco et al. (2007), who reported that ambient levels of NMHC are stabilizing in the MCMA, despite the growth in vehicular fleet.
3.1.1 Relationship between NMHC maximum concentration and wind circulation A series of wind roses were obtained for the days when the maximum or minimum lev-els of NMHC were measured. In Fig. 2, upper/bottom wind roses correspond to the day
10
of maximum/minimum NMHC levels, respectively. The prevalent wind direction at XAL indicated that NE winds were associated with maximum NMHC concentration, showing a slight variation during the 2003 field campaign. Northern winds were associated to minimum NMHC concentrations except for the 2003 campaign which showed winds blowing from the SW. The wind roses for the MER site showed high variation,
partic-15
ularly for the maximum NMHC concentration (6677 ppbC) in 1997. The subsequent campaigns showed winds blowing from the N or the E associated to the maximum NMHC. The SW sector was related to maximum NMHC at the residential site PED. The effect of wind speed on the NMHC levels was not clear other than the associa-tion of highest concentraassocia-tions and winds below or about 1.0 m/s. De Foy et al. (2005)
20
mentioned that early morning winds in the MCMA were generally below 2.0 m/s, and no clear association was found between wind direction and speed.
The wind circulation patterns during MCMA-2003 campaign has been studied on de-tail by de Foy et al. (2005) using both synoptic and basin observations, and their effect on ozone peak concentration. Three circulation patterns were defined under which
25
ozone levels will be highest in the north of the city (O3-North category), in the south of the city (O3-South category) and a third flow pattern (Cold Surge category) which will lead to lower temperatures and presence of rain with a more even geographical
distri-ACPD
7, 13561–13596, 2007 Source apportionment E. Vega et al. Title Page Abstract Introduction Conclusions References Tables Figures ◭ ◮ ◭ ◮ Back CloseFull Screen / Esc
Printer-friendly Version Interactive Discussion
EGU bution of pollutant concentrations. De Foy et al. (2005) also reported that the frequency
of ozone concentrations above 200 ppb was higher during the O3-north flow, a lower but broad distribution of concentration for a Cold surge category and a narrow concen-tration around 170 ppb for an O3-South category. These flow patterns described by de Foy also fitted to NMHC levels, as maximum concentrations at XAL and MER
corre-5
sponded to the O3-North pattern, and maximum NMHC at PED was observed during an O3-South flow pattern, reflecting the coupled chemistry of ozone and NMHC. 3.1.2 Concentrations of NMHC and the ratio toluene/benzene during the 2003 field
campaign
A general feature for the three field campaigns was the observation of maximum
con-10
centrations of NMHC during weekdays especially from Wednesday to Friday, and min-imum concentrations on weekends or at the beginning of the week (Monday or Tues-day). The variation of NMHC concentrations from Monday to Sunday is shown in Fig. 4, which was constructed using data from the six monitoring sites. These results suggest that NMHC concentration has a weekly cycle with the highest levels at the end of the
15
week and lowest concentrations at weekend/beginning of week, resulting from both the emissions and accumulation process, the last one strongly dependent on meteorology. The photochemical age of an air sample has been estimated by using ratios of mea-sured NMHC (McKeen and Liu, 1993; Cubison et al., 2006). This method has a simple principle: at the emission source, NMHC have a characteristic ratio which depends
20
on the type of emissions. Downwind emission source ratios will change as the more reactive species will be removed faster. In this work we use the toluene/benzene ratio as a method of estimating photochemical age (de Gouw et al., 2005). We used the data from source profiles studies in Mexico City (Vega et al., 2000) to derive emission ratios of vehicular emissions as they are the principal pollution source in urban
envi-25
ronments, the results are presented in Table 1. MCMA-2003 campaign measurements were divided into periods depending on circulation flow pattern as described by de Foy et al. (2005), and only those measurements taken during the morning were used for
ACPD
7, 13561–13596, 2007 Source apportionment E. Vega et al. Title Page Abstract Introduction Conclusions References Tables Figures ◭ ◮ ◭ ◮ Back CloseFull Screen / Esc
Printer-friendly Version Interactive Discussion
EGU this analysis.
Table 2 contains the date, type of day, concentration of NMHC, toluene/benzene ratio and wind circulation category. The first period from the 14th to 17th April showed an O3-south pattern. The toluene/benzene ratio for sites located in the south of the MCMA (PED and SAN) showed an increase in the ratio after a 3-day period of O3-South
cir-5
culation pattern; besides, the maximum concentration of NMHC at PED (16th of April) was also observed. These ratios may reflect the contribution of NMHC sources as the air masses passed over the city, and the accumulation of pollutants in the south of the city. A Cold Surge O3-South flow pattern started on the 19th of April showing ratios of 3.13 and 3.57 on the 21st and 22nd at MER site respectively, i.e., negligible change.
10
An O3-North flow pattern started on the 23rd through the 30th of April with a weekend in the middle of this period. The ratios at XAL increased from 4.35 on 23 April 2003 (Wednesday), 4.55 on 24 April 2003 and 5.88 on 25 April 2003. The ratios for 26 April 2003 (Saturday) and for 28 April 2003 showed a decrease. Actually, this was the only period when an ageing was observed. The results suggest that ambient air in MCMA
15
is generally receiving fresh emissions high enough to avoid significant photochemical ageing, and depending on meteorology NMHC will accumulate in the north or in the south of the city. Velasco et al. (2007) found negligible photochemical ageing using ratios obtained from the diurnal profiles at CEN site. Figure 5 describes the relation-ship between NMHC concentration and toluene/benzene ratio divided by type of day.
20
Although the coefficients were moderated, they show a negative relationship during weekends and positive but poor correlation during weekdays, supporting the assump-tion that it is possible to observe ageing process only during weekends (with lower emissions).
Figure 6 shows the variation on the toluene/benzene ratio for the three wind
circu-25
lation categories. The highest ratios were observed during the O3-North episodes, reflecting the higher amount of emissions and the accumulation process previously described.
ACPD
7, 13561–13596, 2007 Source apportionment E. Vega et al. Title Page Abstract Introduction Conclusions References Tables Figures ◭ ◮ ◭ ◮ Back CloseFull Screen / Esc
Printer-friendly Version Interactive Discussion
EGU 3.2 Source Apportionment results
Table 3 shows the average statistical parameters of the CMB model applied to NMHC at different sites within the MCMA during 2002–2003 field campaigns. In general, it can be observed that the parameters of R2, Chi2and percentage mass were within the acceptable range. Values of R2 ranged from 0.80 at CEN to 0.99 at PED, MER and
5
XAL, with an average of 0.95. In most cases, the values of Chi2 were smaller than 4.00 with and average of 2.25. The percentages of mass calculated when applying the model varied from 80.3% at Pedregal to 114.4% at CEN, with an average of 91.3%. The results of measured and calculated ambient concentrations in ppbC when applying the model are also shown. It should be noted that in few cases, differences of calculated
10
and measured mass were significant especially at the rural sites where mass was low, which indicates that there were species in the atmosphere that were not identified, this may be due to the location of diverse sources that contributed to ambient emissions but were not characterized.
3.2.1 Measurements from 06:00 to 09:00 and 12:00 to 15:00 during 2002 and 2003
15
In general, the results showed that the major sources of NMHC to the atmosphere were emissions from vehicle exhaust using gasoline, heavy duty vehicles using diesel and liquefied petroleum gas for both years as seen in Figs. 7 and 8. The main source at XAL was gasoline with an average of 40.6% in 2002, and diesel with an average of 47.4% in 2003, the average contribution of LPG was similar for both years. The main
20
source at MER was gasoline with an average of 42.8% in 2002, and diesel with an average of 32.8% in 2003. The main source at PED was gasoline with an average of 41.0% in 2002, and LPG with an average of 32.8% in 2003, which is in agreement with the observed increment in propane and butane that will be discussed later.
A series of less than 60-min sampling measurements were conducted at MER, CEN
25
and PED for some of the days during the 2003 field campaign. Some differences were observed when compared to the typical 3-hr sampling measurements on both
ACPD
7, 13561–13596, 2007 Source apportionment E. Vega et al. Title Page Abstract Introduction Conclusions References Tables Figures ◭ ◮ ◭ ◮ Back CloseFull Screen / Esc
Printer-friendly Version Interactive Discussion
EGU total NMHC concentration and source apportionment results. Such differences are
described in the following paragraphs.
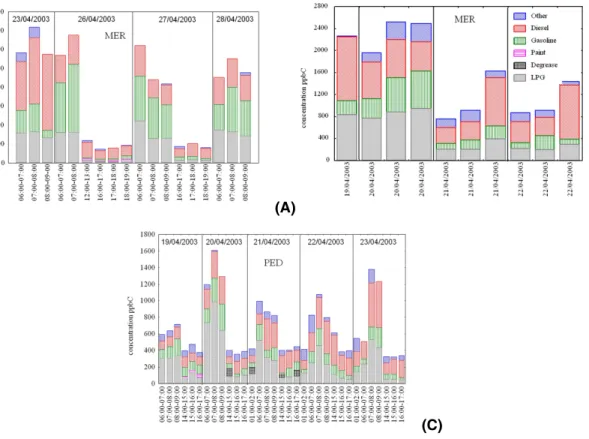
Figure 9A depicts the source apportionment results at MER site for the 23rd, 26th, 27th and 28th of April. Large differences were observed between the morning (06:00 to 09:00 hr) and the afternoon (16:00 to 19:00 hr) results, as the maximum contribution of
5
LPG and gasoline vehicles occurred in the morning (07:00 to 08:00 hr), and minimum contribution in the afternoon, when the main source contribution shifted to diesel vehi-cles. As Figure A shows, the total NMHC concentration during the morning was 4 to 5-times higher than the afternoon values. A general feature was the higher concentra-tion of total NMHC in the short-sampling measurements compared to the 3-hr samples,
10
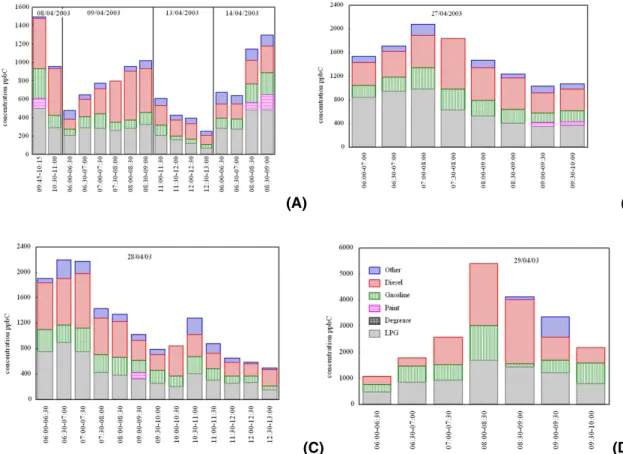
as more emissions from a specific point source can be captured when samples are taken on shorter periods of time. On the contrary, higher concentrations are missed in the 3-hr samples. This is in agreement with model results, in which smaller number of sources contributed to the 3-hr samples compared to the short-time samples. Fig-ure 10A describes the source apportionment results for CEN site on the 8th, 9th, 13th,
15
14th of April, showing the contribution of sources which generally were not observed in the 3-hr sampling measurements (Fig. 8), although their contribution was not signif-icant. These sources were degreasing and application of paint offset and graphic arts processes, all of them with emissions rich on toluene, xylenes and pentane. The LPG contribution, one of the major contributing sources, was constant (38%) for both short
20
and 3-hr sampling measurements. The vehicular sources showed a variable contribu-tion, i. e., the contribution of diesel vehicles was higher (58%) in the 3-hr sampling measurements compared to the short-sampling measurements (37.5% in average). The opposite was observed for the gasoline vehicles that showed a higher contribution from the short-sampling measurements (17.9%) compared to the 3-hr measurements
25
(5.2%).
A comparison of short-sampling measurements vs. 3-hr sampling measurements at MER site showed that the main sources were LPG and diesel vehicles in both cases. The contribution of gasoline vehicles was higher in the short-sampling measurements
ACPD
7, 13561–13596, 2007 Source apportionment E. Vega et al. Title Page Abstract Introduction Conclusions References Tables Figures ◭ ◮ ◭ ◮ Back CloseFull Screen / Esc
Printer-friendly Version Interactive Discussion
EGU (36% on average) than the 3-hr samples (24.8%). The contribution of printing
pro-cesses was variable with an average of 9.8%.
Figure 9B shows the source apportionment for instantaneous sampling measure-ments at MER site, which were taken at 06:00, 07:00 and 08:00 hr. The total mass concentration was higher at 08:00 hr which is consistent with the short-sampling
mea-5
surements characteristic. The main contribution sources were diesel vehicles with an average of 41.2%, LPG (29%) and gasoline vehicles (17.4%). It is important to mention that the non-identified sources showed their highest contribution 12.3% for this type of samples.
The short-sampling measurements at CEN on the 27th and 28th of April (Figs. 10B
10
and 10C) indicated that higher concentrations were recorded at 07:30 and 08:00 hr, with a general decrease as the day goes on. It is worth mentioning that the model showed some difficulties apportioning the sources for the cases with high NMHC mass concentration, hence the contribution of non-identified sources increased. A slightly different pattern was observed on the 29th of April (Fig. 10D) that showed the maximum
15
concentration at 08:00–08:30 hr. The contribution of diesel vehicles was homogeneous (36.5% on average). The LPG contribution was also important (37.5% on average) although showed some variation. The third most important source, gasoline vehicles, showed a range of contribution from 16.4% to 24.5% with an average of 19.5%.
Figure 9C describes the short-sampling measurements at PED site from 19th to
20
23rd of April. The main contribution was LPG with 43.8%, which is slightly higher than the 3-hr samples (37.8%); the second most important contribution shifted between gasoline vehicles (17.5% for the short-samples vs. 24.5% for the 3 hr samples) and diesel vehicles (29.8% for the short-samples vs. 21.7% for the 3-hr samples). The LPG contribution reached its highest contribution (up to 62% from 07:00 to 08:00 hr)
25
at this site, which is consistent with the high observed concentrations of propane and butane.
The 3-hr measurements at the rural sites showed low concentrations, especially at Santa Ana site. The model results indicated that the main source was diesel vehicles
ACPD
7, 13561–13596, 2007 Source apportionment E. Vega et al. Title Page Abstract Introduction Conclusions References Tables Figures ◭ ◮ ◭ ◮ Back CloseFull Screen / Esc
Printer-friendly Version Interactive Discussion
EGU (42.1% on average); gasoline vehicles reached 16.6% and LPG 15.9%. The
contribu-tion of non-identified sources was significant at both sites (25.5% on average) and was directly associated with the total NMHC concentration (Fig. 11).
Finally, a series of samples taken from 12:00 to 15:00 hr were analysed. The results indicated that source contribution was homogeneously distributed except for two days,
5
when concentrations were higher than 1000 ppbC, although the total mass was not fully apportioned. In general, the contribution of LPG was found to be lower during the period from 12:00 to 15:00 hr compared to morning results. On the contrary, vehicular emissions increased during this period; the average contribution was 12.1% for LPG, 17.9% for gasoline and 47.7% for diesel (Fig. 12).
10
4 Conclusions
Non-methane hydrocarbon concentrations collected at different sites, representing ur-ban and rural environments within the MCMA during 1997, 2002 and 2003 field cam-paigns, were compared and used as an input for the CMB model to determine the source contribution of NMHC to the atmosphere. For the 2003 field campaign, the
15
results show that the contribution of vehicular emissions dominated the NMHC con-centrations (19.7%±7.1% for gasoline vehicles and 35.4%±17.5% for diesel vehicles) followed by the emissions of marketing and handling of LPG (29.9%±8.0%). The latter source showed its higher contribution at the southwest site, especially during 2003 field campaign.
20
Despite the growth in the vehicular fleet, the observed concentrations of NMHC in several sites within the MCMA have shown stabilization over this period, as the 25– 75 percentile range has narrowed, with median concentrations of 2500 ppbC at XAL and MER, and 1300 ppbC at PED in 2003. However, a slight increase in the concen-trations of propane and i-butane was observed at the southwest site on 2003, which
25
was attributed to a rise in the contribution of LPG emissions.
ana-ACPD
7, 13561–13596, 2007 Source apportionment E. Vega et al. Title Page Abstract Introduction Conclusions References Tables Figures ◭ ◮ ◭ ◮ Back CloseFull Screen / Esc
Printer-friendly Version Interactive Discussion
EGU lyzed using the 2003 field campaign data. It was observed that maximum
concentra-tions of NMHC at XAL and MER took place during an O3-north episode, and maximum NMHC at PED was observed during an O3-south episode, reflecting the coupled chem-istry of ozone and NMHC.
The NMHC concentrations showed a weekly cycle with the highest levels at the
5
end of the week and lowest concentrations at weekend/beginning of week, suggesting that both emissions and accumulation process play a key role in building up NMHC levels. The toluene/benzene ratio of the air samples was calculated as a method for elucidating the photochemical age of the air samples. The ratios were analyzed as a function of the type of day, concentration of NMHC and wind circulation patterns.
10
We found that the atmosphere of the MCMA generally receives fresh emissions high enough to prevent photochemical ageing. In addition, depending on meteorological conditions, NMHC will accumulate in the north or in the South of the city, increasing the toluene/benzene ratio after two or more days with similar flow pattern.
A series of instantaneous, 30-min and 60-min NMHC sampling were carried out for
15
some days during the MCMA-2003 campaign. The results indicated that a more fre-quent sampling period (30 min) with respect to 3-h samplings showed higher concen-trations since the longer sampling periods masked important NMHC variations, there-fore, exposure to high levels could be missed. Some monitoring sites are influenced by nearby sources and represent neighborhood rather than specific local site exposure.
20
For example, the CEN site was located near sources that contribute to the emission of NMHC to atmospheric loadings; XAL is influenced by emission from different industries and unpaved roads. These sources have a regional as well as local effect, but they may overestimate the total NMHC mass concentrations measured when the sampler is very close to the emission sources and may bias exposure estimates.
25
In summary, the spatial and temporal analysis of the ambient concentrations of the most abundant NMHC measured during three field campaigns from 1997 to 2003 was presented. The CMB receptor model was used to apportion the NMHC sources at six locations within the MCMA representing the heavily industrialized, commercial,
resi-ACPD
7, 13561–13596, 2007 Source apportionment E. Vega et al. Title Page Abstract Introduction Conclusions References Tables Figures ◭ ◮ ◭ ◮ Back CloseFull Screen / Esc
Printer-friendly Version Interactive Discussion
EGU dential and rural areas. It should be noted that the sampling campaign was spatially
and temporally limited and the data may reflect meteorological and other conditions specific to the sampling period. Therefore conclusions of this paper are specific to the sampling periods and locations in 2002 and 2003, and their applicability to other time periods and at other locations are not known. We are planning to apply similar
5
technique to the datasets obtained from the MILAGRO (Megacity Initiative: Local and Global Research Observations) Campaign, a multi-component international scientific collaboration that took place in 2006, which will provide additional insights to the con-tribution of various sources to the NMHC burden.
Acknowledgements. We would like to thank the Washington State University and the staff of
10
the Laboratorio de Qu´ımica de la Atm ´osfera at the Instituto Mexicano del Petroleo for providing the data from analyses of the samples collected in the MCMA-2002/2003 campaigns. LTM ac-knowledges support from Mexican Comisi ´on Ambiental Metropolitana and US National Science Foundation (ATM-0528227).
References
15
Arriaga, C. J., Mart´ınez, V. G., Escalona, S. S., and Mat´ınez, C. H.: Compuestos org ´anicos vol ´atiles en la atm ´osfera de la ZMCM (Volatile organic compounds in the atmosphere of MCMA), El Colegio Nacional, Mexico, D.F, 23–38, 1996.
Compendium method TO-14: The determination of volatile organic compounds in ambient air using SUMMA passive canister sampling and gas chromatography analysis. Quality
as-20
surance division environmental monitoring system laboratory U.S. Environmental Protection Agency. Research Triangle Park, North Carolina 2771, Made 1988.
Core, J. E.: Receptor Modelling: Student Guidebook, US Environmental Protection Agency, APTI SI-424, 1987.
Cubison, M. J., Alfarra1, M. R., Allan, J. Bower, K. N., Coe, H., McFiggans, G. B., Whitehead, J.
25
D., Williams, P. I., Zhang, Q., Jimenez, J. L., Hopkins, J., and Lee, J.: The characterization of pollution aerosol in a changing photochemical environment, Atmos. Chem. Phys., 6, 5573– 5588, 2006,http://www.atmos-chem-phys.net/6/5573/2006/.
ACPD
7, 13561–13596, 2007 Source apportionment E. Vega et al. Title Page Abstract Introduction Conclusions References Tables Figures ◭ ◮ ◭ ◮ Back CloseFull Screen / Esc
Printer-friendly Version Interactive Discussion
EGU
de Foy, B., Caetano, E., Maga ˜na, V., Zitacuaro, A., Cardenas, B., Retama, A., Ramos, R., Molina, L. T., and Molina, M. J.: Mexico City basin wind circulation during the MCMA-2003 field campaign, Atmos. Chem. Phys., 5, 2267–2288, 2005,
http://www.atmos-chem-phys.net/5/2267/2005/.
de Gouw, J. A., Middlebrook, A. M., Warneke, C., Goldan, P. D., Kuster, W. C., Roberts, J.
5
M., Fehsenfeld, F. C., Worsnop, D. R., Canagaratna, M. R., Pszenny, A. P., Keene, W. C., Marchewka, M., Bertman, S. B., and Bates, T. S.: Budget of organic carbon in a polluted atmosphere: Results from the New England Air Quality Study in 2002, J. Geophys. Res., Vol. 110, D16305, doi:10.1029/2004JD005623, 2005.
Departamento del Distrito Federal: Programa para mejorar la calidad del aire en el Valle de
10
M ´exico 1995–2000 (A program to improve the air quality in the Valley of Mexico 1995–2000), M ´exico, 1996.
Fujita, E. M., Watson, J. G., Chow, J. C, and Lu, Z.: Validation of the chemical mass balance receptor model applied to hydrocarbons source apportionment in the Southern California air quality study, Environ. Sci. Tech., 28, 1663–1649, 1994.
15
Gertler, A. W., Fujita, E. M., Pierson, W. R. and Wittorff, D. N.: Apportionment of NMHC tailpipe vs. non-tailpipe emissions in the Fort McHenry and Tuscarona Mountain tunnels, Atmos. Environ., 30, 2297–2305, 1996.
Li, A., Jang, J., and Scheff, P. A.: Application of EPA CMB8.2 Model for Source Apportionment of Sediment PAHs in Lake Calumet, Chicago, Environ Sci. Technol., 37, 2958–2965, 2003.
20
McKeen, S. and Liu, S.: Hydrocarbon ratios and photochemical history of air masses, Geophys. Res. Lett., 20, 2363–2366, 1993.
Molina, L. T. and Molina, M. J.: Air Quality in the Mexico Megacity. An integrated assessment, Kluwer Academic Publishers, Netherlands, 2002.
Molina, L. T., Kolb, C. E., de Foy, B., Lamb, B. K., Brune, W. H., Jim ´enez, J. L., Ramos-Villegas,
25
R., Sarmiento, J., Paramo-Figueroa, V. H., Cardenas, B., Gutierrez-Avedoy, V., and Molina, M.J.: Air quality in North America’s most populous city – overview of MCMA-2003 campaign, Atmos. Chem. Phys., 7, 2447–2473, 2007,http://www.atmos-chem-phys.net/7/2447/2007/. O’Shea, W. J. and Scheff, P. A.: Validation of a source apportionment model for volatile
hydro-carbons, J. Air Poll. Control Assess., 38, 1020–1026, 1988.
30
Rogers, T. M., Grimsrud, E. P., Herndon, S. C., Jayne, J. T., Kolb, C. E., Allwine, E., Westberg, H., Lamb, B. K., Zavala, M., Molina, L. T., Molina, M. J., and Knighton, W. B.: On-road measurements of volatile organic compounds in the Mexico City Metropolitan Area using
ACPD
7, 13561–13596, 2007 Source apportionment E. Vega et al. Title Page Abstract Introduction Conclusions References Tables Figures ◭ ◮ ◭ ◮ Back CloseFull Screen / Esc
Printer-friendly Version Interactive Discussion
EGU
Proton Transfer Reaction Mass Spectrometry, Int. J. Mass Spectrom. 252, 26–37, 2006. S ´anchez, G., Vega, E., Reyes, E. Mulica, V., Chow, J., Watson, J., and Arriaga, J. L.:
Im-portance of Determining Volatile Organic Compounds Source Profiles to Diminish Ozone Concentrations in Mexico City Metropolitan Area, 94TH Annual Conference and exhibition of the Air and Waste Management Association, Orlando, Florida, 2001.
5
S ´anchez, G., Vega, E., Reyes, E., and Mulica, V.: Los compuestos org ´anicos vol ´atiles en la atm ´osfera de la ciudad de M ´exico: origen y concentraciones. Ciencia y Desarrollo en Intranet del CONACYT, Mayo-Junio, 1–7, 2004.
Scheff, P. A., Wadden, R. A., and Allen, R. J.: Development and validation of a chemical element balance for Chicago, Environ. Sci. Tech., 18, 923–931, 1984.
10
Scheff, P. A. and Klevs, M.: Source-receptor analysis of volatile hydrocarbons, J. Environ. Eng., 113, 994–1005, 1987.
Schifter, I., Diaz, L., Duran, J., Guzman, E., Chavez, O., and Lopez-Salinas, E.: Remote sens-ing study of emissions from motor vehicles in the Metropolitan Area of Mexico City, Environ. Sci. Technol., 37, 395–401, 2003.
15
Shifter, I., D´ıaz, L., Vera, M., Guzm ´an, E., and L ´opez-Salinas, E.: Fuel formulation and vehicle exhaust emissions in Mexico, Sci. Direct Fuel 83, 2065–2074, 2004.
Vega, E. Garc´ıa, I. Ruiz, M. E. Barbiaux, M., and Apam, D.: Application of a Chemical Mass Balance Receptor Model to Respirable Particulate Matter in Mexico City. JAWMA, 47, 524– 529, 1997.
20
Vega, E., Mulica, V., Carmona, R., and Valencia, E.: Hydrocarbon Source Apportionment in Mexico City Using The Chemical Mass Balance Receptor Model, Atmos. Environ., 34, 4121– 4129, 2000.
Vega, R. E., Mulica, A. V., Diaz, G. L., and Ramos, L. F.: Estudio comparativo de perfiles de emisiones vehiculares en t ´unel y dinam ´ometro. (A comparative study of vehicular emission
25
profiles in tunnel and dynamometer), Revista Internacional de Contaminaci ´on Ambiental. 16, (2), 55–60, 2000b.
Velasco, E. Lamb, B., Westberg, H., et al.: Distribution, magnitudes, reactivities, ratios and diurnal patterns of volatile organic compounds in the Valley of Mexico during the MCMA 2002 and 2003 field campaigns, Atmos. Chem. Phys., 7, 329–353, 2007,
30
http://www.atmos-chem-phys.net/7/329/2007/.
Viana, M., Querol, X. Gotschi, T., et al.: Source apportionment of ambient PM2.5 at five Spanish centres of the European community respiratory health survey (ECRHS II), Atmos. Environ.,
ACPD
7, 13561–13596, 2007 Source apportionment E. Vega et al. Title Page Abstract Introduction Conclusions References Tables Figures ◭ ◮ ◭ ◮ Back CloseFull Screen / Esc
Printer-friendly Version Interactive Discussion
EGU
41, 1395–1406, 2007.
Watson, J.G., Cooper, A. J. and Huntzicker, J.J.: The effective variance weighting for least squares calculations applied to the mass balance receptor model, Atmos. Environ., 18, 1347–1355, 1984.
Watson, J. G., Robinson, N. F., Chow, J. C., Henry, R. C., Kim, B. M., Pace, T. G., Meyer, E.
5
L., and Nguyen, Q.: The USEPA/DRI Chemical Mass Balance Receptor Model, CMB 7.0., Environmental Software, 5, 38–49, 1990.
Watson, J. G., Chow, J. C., Lu, Z., Fujita, E. M. Lowenthal, D. H., and Lawson, D. R.: Chemical Mass Balance Source Apportionment of PM10 during the Southern California Air Quality Study, Aerosol Sci. and Tech., 21, 1–36, 1994.
10
Zavala, M., Herndon, S. C., Slott, R. S., Dunlea, E. J., Marr, L. C., Shorter, J. H., Zahniser, M., Knighton, W. B., Rogers, T. M., Kolb, C. E., Molina, L. T., and Molina, M., J.: Characterization of on-road vehicle emissions in the Mexico City Metropolitan Area using a mobile laboratory in chase and fleet average measurement modes during the MCMA-2003 Field Campaign, Atmos. Chem. Phys., 6, 5129–5142, 2006,http://www.atmos-chem-phys.net/6/5129/2006/.
ACPD
7, 13561–13596, 2007 Source apportionment E. Vega et al. Title Page Abstract Introduction Conclusions References Tables Figures ◭ ◮ ◭ ◮ Back CloseFull Screen / Esc
Printer-friendly Version Interactive Discussion
EGU
Table 1. Toluene to benzene ratio for different emission sources in Mexico City (Vega, et
al. 2000).
Source Toluene/benzene Whole gasoline 2.86
Hot soak emissions 1.68 Tunnel (gasoline vehicles) 2.45 Diesel vehicles 5.20
ACPD
7, 13561–13596, 2007 Source apportionment E. Vega et al. Title Page Abstract Introduction Conclusions References Tables Figures ◭ ◮ ◭ ◮ Back CloseFull Screen / Esc
Printer-friendly Version Interactive Discussion
EGU
Table 2. Concentrations of NMHC, toluene to benzene ratio and flow category according to de
Foy et al., (2005). Only morning samples are shown.
Date Day flow category VOC conc (ppbC) site/sample duration Tol/ben 14 Apr 2003 Monday O3-south 150 PAC 07-10 2.13 14 Apr 2003 Monday O3-south 1176 PED 06-09 2.56 15 Apr 2003 Tuesday O3-south 888 PAC 07-10 3.23 15 Apr 2003 Tuesday O3-south 68 SAN 06-09 3.13 16 Apr 2003 Wednesday O3-south 99 SAN 06-09 5.26 16 Apr 2003 Wednesday O3-south 1951 PED 06-09 5.00 21 Apr 2003 Monday cold surge 1252 MER 06-09 3.13 21 Apr 2003 Monday cold surge 1356 CEN 06-09 3.13 21 Apr 2003 Monday cold surge 1701 XAL 06-09 6.67 22 Apr 2003 Tuesday cold surge 1189 MER 06-09 3.57 22 Apr 2003 Tuesday cold surge 658 CEN 06-09 3.23 22 Apr 2003 Tuesday cold surge 935 PED 06-09 3.45 23 Apr 2003 Wednesday O3-north 3157 MER 06-09 9.09 23 Apr 2003 Wednesday O3-north 2047 CEN 06-09 5.56 23 Apr 2003 Wednesday O3-north 3367 XAL 06-09 4.35 23 Apr 2003 Wednesday O3-north 1173 PED 06-09 3.23 24 Apr 2003 Thursday O3-north 3036 MER 06-09 4.55 24 Apr 2003 Thursday O3-north 2714 CEN 06-09 5.56 24 Apr 2003 Thursday O3-north 4133 XAL 06-09 4.55 24 Apr 2003 Thursday O3-north 953 PED 06-09 4.55 25 Apr 2003 Friday O3-north 2490 MER 06-09 4.35 25 Apr 2003 Friday O3-north 2245 CEN 06-09 6.25 25 Apr 2003 Friday O3-north 2271 XAL 06-09 5.88 25 Apr 2003 Friday O3-north 1425 PED 06-09 4.17 26 Apr 2003 Saturday O3-north 2360 MER 06-09 4.76 26 Apr 2003 Saturday O3-north 2057 CEN 06-09 11.11 26 Apr 2003 Saturday O3-north 2580 XAL 06-09 4.35 26 Apr 2003 Saturday O3-north 1560 PED 06-09 4.76 28 Apr 2003 Monday O3-north 2300 MER 06-09 4.00 28 Apr 2003 Monday O3-north 3605 CEN 06-09 5.00 28 Apr 2003 Monday O3-north 3735 XAL 06-09 3.13 28 Apr 2003 Monday O3-north 1549 PED 06-09 3.45 30 Apr 2003 Wednesday O3-north 1751 MER 06-09 4.35 30 Apr 2003 Wednesday O3-north 2700 CEN 06-09 4.76 30 Apr 2003 Wednesday O3-north 2409 XAL 06-09 10.00 30 Apr 2003 Wednesday O3-north 1400 PED 06-09 4.17 2 May 2003 Friday O3-south 2204 MER 06-09 3.45 2 May 2003 Friday O3-south 2032 CEN 06-09 3.85 2 May 2003 Friday O3-south 2511 XAL 06-09 9.09 2 May 2003 Friday O3-south 1056 PED 06-09 3.13
ACPD
7, 13561–13596, 2007 Source apportionment E. Vega et al. Title Page Abstract Introduction Conclusions References Tables Figures ◭ ◮ ◭ ◮ Back CloseFull Screen / Esc
Printer-friendly Version Interactive Discussion
EGU
Table 3. Average statistical parameters of the CMB model applied to NMHC during 2002–2003
at different sites in Mexico.
Site R2 CHI2 Meas. Conc. [ppbC] Calc. Conc. [ppbC] %Mass Xalostoc Ave 0.97 2.04 2552 2280 89 (XAL) Min 0.87 0.91 719 675 80 Max 0.99 3.63 4075 3882 100 Merced Ave 0.96 2.14 2060 1937 94 (MER) Min 0.89 1.01 366 328 81 Max 0.99 3.87 3774 3626 113 Pedregal Ave 0.95 2.53 839 748 89 (PED) Min 0.86 0.98 320 293 80 Max 0.99 4.07 1747 1592 104 Cenica Ave 0.94 2.16 1361 1281 93 (CEN) Min 0.80 0.88 253 204 80 Max 0.98 3.75 4125 3877 114 Pachuca Ave 0.92 2.29 179 153 86 (PAC) Min 0.86 1.49 73 61 82 Max 0.96 3.55 411 337 93 Santa Ana Ave 0.93 1.89 185 165 89 (SAN) Min 0.88 0.63 87 72 81 Max 0.98 2.76 239 210 101 Spatial Ave 0.95 2.24 1462 1348 91
Min 0.8 0.63 73 61 80 Max 0.99 4.07 4125 3882 114
ACPD
7, 13561–13596, 2007 Source apportionment E. Vega et al. Title Page Abstract Introduction Conclusions References Tables Figures ◭ ◮ ◭ ◮ Back CloseFull Screen / Esc
Printer-friendly Version Interactive Discussion
EGU
ACPD
7, 13561–13596, 2007 Source apportionment E. Vega et al. Title Page Abstract Introduction Conclusions References Tables Figures ◭ ◮ ◭ ◮ Back CloseFull Screen / Esc
Printer-friendly Version Interactive Discussion
EGU
Fig. 2. Descriptive statistics for the NMHC concentrations (ppbC) measured at Xalostoc (XAL),
La Merced (MER) and Pedregal (PED) during 1997, 2002 and 2003 field campaigns. The upper/bottom wind roses correspond to the day of maximum/minimum NMHC concentration, respectively.
ACPD
7, 13561–13596, 2007 Source apportionment E. Vega et al. Title Page Abstract Introduction Conclusions References Tables Figures ◭ ◮ ◭ ◮ Back CloseFull Screen / Esc
Printer-friendly Version Interactive Discussion
EGU
Fig. 3. Atmospheric concentration of the most abundant NMHC (ppbC) in the MCMA during
ACPD
7, 13561–13596, 2007 Source apportionment E. Vega et al. Title Page Abstract Introduction Conclusions References Tables Figures ◭ ◮ ◭ ◮ Back CloseFull Screen / Esc
Printer-friendly Version Interactive Discussion
EGU
Fig. 4. Descriptive statistics for NMHC atmospheric concentrations (ppbC) in the MCMA grouped by type of day.
ACPD
7, 13561–13596, 2007 Source apportionment E. Vega et al. Title Page Abstract Introduction Conclusions References Tables Figures ◭ ◮ ◭ ◮ Back CloseFull Screen / Esc
Printer-friendly Version Interactive Discussion
EGU
Fig. 5. Scatter plot between toluene/benzene ratio and NMHC concentration for weekends and
ACPD
7, 13561–13596, 2007 Source apportionment E. Vega et al. Title Page Abstract Introduction Conclusions References Tables Figures ◭ ◮ ◭ ◮ Back CloseFull Screen / Esc
Printer-friendly Version Interactive Discussion
EGU
Fig. 6. Descriptive statistics for toluene/benzene ratio divided into flow categories during the
ACPD
7, 13561–13596, 2007 Source apportionment E. Vega et al. Title Page Abstract Introduction Conclusions References Tables Figures ◭ ◮ ◭ ◮ Back CloseFull Screen / Esc
Printer-friendly Version Interactive Discussion
EGU
Fig. 7. Source apportionment distribution for NMHC during the 2002 campaign. 06:00–09:00 hr.
ACPD
7, 13561–13596, 2007 Source apportionment E. Vega et al. Title Page Abstract Introduction Conclusions References Tables Figures ◭ ◮ ◭ ◮ Back CloseFull Screen / Esc
Printer-friendly Version Interactive Discussion
EGU
ACPD
7, 13561–13596, 2007 Source apportionment E. Vega et al. Title Page Abstract Introduction Conclusions References Tables Figures ◭ ◮ ◭ ◮ Back CloseFull Screen / Esc
Printer-friendly Version Interactive Discussion
EGU
(A) (B)
(C)
Fig. 9. (A) 60 min samples at La Merced site, (B) instantaneous samples at La Merced site; (C) 60 min samples at Pedregal site.
ACPD
7, 13561–13596, 2007 Source apportionment E. Vega et al. Title Page Abstract Introduction Conclusions References Tables Figures ◭ ◮ ◭ ◮ Back CloseFull Screen / Esc
Printer-friendly Version Interactive Discussion
EGU
(A) (B)
(C) (D)
ACPD
7, 13561–13596, 2007 Source apportionment E. Vega et al. Title Page Abstract Introduction Conclusions References Tables Figures ◭ ◮ ◭ ◮ Back CloseFull Screen / Esc
Printer-friendly Version Interactive Discussion
EGU
ACPD
7, 13561–13596, 2007 Source apportionment E. Vega et al. Title Page Abstract Introduction Conclusions References Tables Figures ◭ ◮ ◭ ◮ Back CloseFull Screen / Esc
Printer-friendly Version Interactive Discussion
EGU
Fig. 12. Source apportionment distribution for NMHC at Xalostoc, La Merced, Pedregal and