HAL Id: hal-02043167
https://hal.archives-ouvertes.fr/hal-02043167
Submitted on 21 Jan 2020
HAL is a multi-disciplinary open access
archive for the deposit and dissemination of
sci-entific research documents, whether they are
pub-lished or not. The documents may come from
teaching and research institutions in France or
abroad, or from public or private research centers.
L’archive ouverte pluridisciplinaire HAL, est
destinée au dépôt et à la diffusion de documents
scientifiques de niveau recherche, publiés ou non,
émanant des établissements d’enseignement et de
recherche français ou étrangers, des laboratoires
publics ou privés.
Concurrent Starbursts in Molecular Gas Disks within a
Pair of Colliding Galaxies at z = 1.52
J. D. Silverman, Emanuele Daddi, W. Rujopakarn, A. Renzini, C. Mancini, F.
Bournaud, A. Puglisi, G. Rodighiero, D. Liu, M. Sargent, et al.
To cite this version:
J. D. Silverman, Emanuele Daddi, W. Rujopakarn, A. Renzini, C. Mancini, et al.. Concurrent
Star-bursts in Molecular Gas Disks within a Pair of Colliding Galaxies at z = 1.52. The Astrophysical
journal letters, Bristol : IOP Publishing, 2018, 868 (1), pp.75. �10.3847/1538-4357/aae64b�.
�hal-02043167�
Concurrent Starbursts in Molecular Gas Disks within a Pair of Colliding
Galaxies at
z=1.52
J. D. Silverman1 , E. Daddi2 , W. Rujopakarn3,4,5 , A. Renzini6 , C. Mancini6,7 , F. Bournaud2 , A. Puglisi2,6 , G. Rodighiero7 , D. Liu2, M. Sargent8, N. Arimoto9,10, M. Béthermin11 , J. Fensch12 , C. C. Hayward13 , J. Kartaltepe14 ,
D. Kashino15 , A. Koekemoer16 , G. Magdis17 , H. J. McCracken18 , T. Nagao19 , K. Sheth20 , V. Smolčić21, and F. Valentino22
1Kavli Institute for the Physics and Mathematics of the Universe, The University of Tokyo, Kashiwa 277-8583(Kavli IPMU, WPI), Japan;[email protected] 2
Laboratoire AIM, CEA/DSM-CNRS-Universite Paris Diderot, Irfu/Service d’Astrophysique, CEA Saclay, France
3
Department of Physics, Faculty of Science, Chulalongkorn University, 254 Phayathai Road, Pathumwan, Bangkok 10330, Thailand
4
National Astronomical Research Institute of Thailand(Public Organization), Don Kaeo, Mae Rim, Chiang Mai 50180, Thailand
5
Kavli Institute for the Physics and Mathematics of the Universe, Todai Institutes for Advanced Study, the University of Tokyo, Kashiwa, 277-8583 (Kavli IPMU, WPI), Japan
6
INAF—Osservatorio Astronomico di Padova, Vicolo dellʼOsservatorio 5, I-35122, Padova, Italy
7
Dipartimento di Fisica e Astronomia, Universita di Padova, vicolo Osservatorio, 3, I-35122, Padova, Italy
8
Astronomy Centre, Department of Physics and Astronomy, University of Sussex, Brighton, BN1 9QH, UK
9
Astronomy Program, Department of Physics and Astronomy, Seoul National University, 599 Gwanak-ro, Gwanak-gu, Seoul, 151-742, Republic of Korea
10
Subaru Telescope, 650 North A’ohoku Place, Hilo, HI 96720, USA
11European Southern Observatory, Karl-Schwarzschild-Str. 2, D-85748 Garching, Germany 12
European Southern Observatory, Karl-Schwarzschild-Str. 2, D-85748, Garching bei München, Germany
13
Center for Computational Astrophysics, Flatiron Institute, 162 Fifth Avenue, New York, NY 10010, USA
14
School of Physics and Astronomy, Rochester Institute of Technology, 84 Lomb Memorial Drive, Rochester, NY 14623, USA
15
Institute of Astronomy, ETH Zürich, Wolfgang-Pauli-Strasse 27, CH-8093, Zürich, Switzerland
16
Space Telescope Science Institute, 3700 San Martin Drive, Baltimore, MD 21218, USA
17
Cosmic DAWN Centre, Niels Bohr Institute, University of Copenhagen, Juliane Mariesvej 30, DK-2100, Copenhagen, Denmark
18Institut d’Astrophysique de Paris, CNRS, UMR 7095 and UPMC, 98bis Boulevard Arago, F-75014 Paris, France 19
Graduate School of Science and Engineering, Ehime University, 2-5 Bunkyo-cho, Matsuyama 790-8577, Japan
20NASA Headquaters, 300 E. Street SW, Washington, DC 20546, USA 21
University of Zagreb, Physics Department, Bijenička cesta 32, 10002, Zagreb, Croatia
22
Dark Cosmology Centre, Niels Bohr Institute, University of Copenhagen, Juliane Maries Vej 30, DK-2100 Copenhagen, Denmark Received 2018 July 6; revised 2018 September 19; accepted 2018 October 1; published 2018 November 21
Abstract
We report on the discovery of a merger-driven starburst at z=1.52, PACS-787, based on high signal-to-noise ALMA observations. CO(5–4) and continuum emission (850 μm) at a spatial resolution of 0 3 reveal two compact (r1/2∼ 1 kpc) and interacting molecular gas disks at a separation of 8.6 kpc, indicative of an early stage in a merger.
With an SFR of 991 Meyr−1, this starburst event should occur closer to final coalescence, as is usually seen in hydrodynamical simulations. From the CO size, inclination, and velocity profile for both disks, the dynamical mass is calculated through a novel method that incorporates a calibration using simulations of galaxy mergers. Based on the dynamical mass, we measure(1) the molecular gas mass, independent from the CO luminosity, (2) the ratio of the total gas mass and the CO(1–0) luminosity (aCO ºMgas LCO 1 0¢ - ), and (3) the gas-to-dust ratio, with the latter two being lower than typically assumed. Wefind that the high star formation triggered in both galaxies is caused by a set of optimal conditions: a high gas mass/fraction, a short depletion time (τdepl=85 and 67 Myr) to convert gas into
stars, and the interaction of likely counter-rotating molecular disks that may accelerate the loss of angular momentum. The state of interaction is further established by the detection of diffuse CO and continuum emission, tidal debris that bridges the two nuclei and is associated with stellar emission seen by HST/WFC3. This observation demonstrates the power of ALMA to study the dynamics of galaxy mergers at high redshift.
Key words: galaxies: high-redshift– galaxies: ISM – galaxies: starburst – galaxies: star formation
1. Introduction
Our understanding of the physical properties of the interstellar medium in galaxies undergoing a merger that can induce star formation and accretion onto supermassive black holes is usually based on studies in the local universe. Representative examples include Arp 220, the Antennae, and NGC 6240, which belong to a class of Ultraluminous Infrared Galaxies(ULIRGs; Sanders & Dirabel 1996), which are unequivocally undergoing an extreme
starburst (with a luminous active galactic nucleus—AGN—in many cases), triggered by a merger of two massive galaxies (e.g., Di Matteo et al. 2005; Hopkins et al. 2006; Volonteri et al. 2015). While such collisions accelerate the growth of
galaxies (e.g., Scudder et al. 2012; Ellison et al. 2013), this
mechanism appears to have a subdominant effect on the buildup of the global stellar mass and black hole mass density over a wide range of cosmic time(Rodighiero et al.2011). Although,
mergers likely represent a key phase(having a short duty cycle) through which every massive galaxy may pass (e.g., Lotz et al.2008; Lackner et al.2014). Moreover, galaxy mergers offer
us a specialized laboratory to study the physics of the interstellar medium including the conversion of molecular gas into stars and the channeling of such gas to the central regions that can build up the central stellar bulge.
From seminal studies, local starbursts are characterized as having relatively large amounts of molecular gas(Sanders et al.
1986; Scoville et al.1989), hence higher gas fractions relative The Astrophysical Journal, 868:75 (17pp), 2018 November 20 https://doi.org/10.3847/1538-4357/aae64b
to the normal galaxy population at z∼0. The majority of the molecular gas is centrally concentrated within a radius of ∼1 kpc (Downes & Solomon 1998; Wilson et al. 2008),
possibly the result of a nuclear inflow induced by the merger. This has been demonstrated to be a common phenomenon through hydrodynamic simulations(e.g., Hopkins et al. 2013; Fensch et al.2017) of the merger of two gas-rich disk galaxies.
Furthermore, starbursts are observed to have a lower gas content than expected given their high star formation rates (SFRs), which has been described as having a higher efficiency (SFEºSFR Mgas) to form stars (Solomon et al. 1997; Saintonge et al. 2012) and even seen to be present at higher
redshift (Daddi et al. 2010b; Genzel et al. 2010; Combes et al.2013; Tacconi et al.2018).
Numerous millimeter interferometric studies have presented observations of the molecular gas and dust content of starburst galaxies at high redshift (z > 1), usually bright submillimeter galaxies (SMGs; e.g., Greve et al. 2005; Tacconi et al.2006,
2008; Engel et al. 2010; Bothwell et al. 2013). For select
starbursts, lensing has enhanced the ability to resolve the emission on subarcsecond scales (e.g., Swinbank et al. 2010; Spilker et al. 2015). In general, SMGs share many properties
with local ULIRGs such as having large amounts of molecular gas, clear signs of mergers in many cases (and ordered disk rotation), short gas depletion times, and characteristic sizes less than a few kiloparsec with the central regions being baryon dominated. These galaxies have been proposed to be the progenitors of local elliptical galaxies (Kormendy & Aanders
1992; Ivison et al. 1998; Lilly et al.1999; Genzel et al.2001)
with an intermediate stage as a compact quiescent galaxy(Toft et al.2014). Although a non-negligible level of contamination
from unassociated galaxies is present (Hayward et al. 2013)
due to the large beam size of submillimeter-selected sources, that is now being mitigated with Atacama Large Millimeter/ submillimeter Array (ALMA).
With ALMA, many efforts are extending the aforementioned studies of the molecular gas and dust emission in galaxy mergers and starbursts at z> , particularly below the kiloparsec scale due1 to the large collecting area and long baselines(e.g., Barro et al.
2017; Chen et al.2017; Riechers et al.2017). For example, Hodge
et al. (2016) measured the effective radius of SMGs (z ∼ 2.5),
based on the size of the dust emission at 870μm, to be between 1 and 3 kpc and to have a disk-like morphology, in contrast to star formation being more extended on galaxy-wide scales for typical star-forming main sequence (MS hereafter) galaxies at z∼2 (Rujopakarn et al.2016). While there are signs of ongoing mergers
in HST images of these SMGs, the dust emission is slightly more extended than local ULIRGs while having similar LIR(1012–13Le).
These results corroborate evidence for central ∼kiloparsec dust-emitting(i.e., star-forming) regions in high-z SMGs (Simpson et al.
2015), which may indicate a phase where massive galaxies are
rapidly forming their bulges given their high SFR surface density (ΣSFR∼ 100 Meyr−1kpc−2). However, these issues are still under
debate and will benefit from larger samples, observed at higher resolution with ALMA, including cases (e.g., PACS-787) with more extreme rates of star formation, as presented here.
Complementary to these studies, we are carrying out a program with ALMA over multiple cycles to measure the molecular gas properties, primarily using carbon monoxide (CO; 2–1), of 12 starburst galaxies in the COSMOS field having SFRs well above (4×) the star-forming MS at
z∼1.6 (see Silverman et al.2015a,2018). This sample has
advantages over other heterogeneous high-z starburst samples by having a wealth of information including accurate spectroscopic redshifts, metallicities from[NII]/Hα (Puglisi et al.2017), and stellar masses and SFRs based on mid- and
far-IR observations with Spitzer (Sanders et al. 2007) and
Herschel (Lutz et al. 2011), placing them securely in the
starburst class(Rodighiero et al.2011). Compared to classical
SMGs, this selection avoids contamination by objects close to the MS (Magnelli et al. 2012), reduces SED bias compared
to SMGs selection(which prefers cold objects), and is able to pick objects even with relatively moderate SFR, but much higher above the MS. Based on this sample, we demonstrate that the star formation efficiency (SFE) (or gas depletion timescale) increases (decrease) continuously with elevation in SFR above the star-forming MS (Silverman et al.
2015a,2018).
Here, we present a study at higher spatial resolution of the CO(5–4) molecular gas and continuum emission (rest-frame 500μm) of our strongest starburst (PACS-787; zspec=1.5234;
SFR=991-+8796 Meyr−1, 6.5× greater than the average
star-forming galaxy for its stellar mass) from the sample described above, using ALMA in Cycle 4(Silverman et al.2018). With
0 3 resolution in Band 6, we cleanly separate the emission from two separate galaxies in a major merger. With the resulting maps (CO and continuum) having a high signal-to-noise, we assess the physical characteristics of each galaxy through a determination of αCO (and the gas-to-dust ratio)
based on a dynamical mass estimate of PACS-787. As a novelty, we apply a scale factor to calculate the dynamical mass based on hydrodynamical simulations of galaxy mergers with similar properties to PACS-787. Subsequently, we determine the gas mass(Mgas), SFR, and SFE (Mgas/SFR) of
each galaxy. To conclude, we argue that PACS-787 is a classic example of a merger-induced starburst with a number of contributing factors to its SFR including an orbital con figura-tion conducive for forming stars at such a high rate. Throughout this work, we assume an established cosmology (H0=70 km s−1 Mpc−1, ΩΛ=0.7, ΩM=0.3) and use a
Chabrier IMF for SFRs and stellar masses.
2. PACS-787: An Extreme Outlier from the SF MS PACS-787 is a starburst galaxy with a high SFR as compared to the typical star-forming population at fixed redshift and stellar mass(with details on the determination of these measurements to follow). The galaxy was first identified as having strong far-infrared emission, as detected by Herschel/PACS (Rodighiero et al. 2011), and a photometric
redshift within a targeted redshift range of 1.43<z<1.74 to detect the Hα emission line as part of our large near-infrared spectroscopic survey of star-forming galaxies, FMOS-COS-MOS(Silverman et al.2015b). Therefore, the object was given
priority for spectroscopic follow up that resulted in a positive detection of both Hα and [NII]λ6584 at z=1.5234 (Appendix) thus confirming its nature as having a very high
SFR, atypical of star-forming MS galaxies.
In Figure 1, we show image cutouts of PACS-787 in the optical and near-infrared from both the ground and space that indicate the presence of two galaxies in close proximity. While the eastern (left-most) component is faint in the optical, it is clearly detected by Subaru/Hyper Suprime-Cam (HSC) and
UltraVISTA (KAB=22.39 and 20.47 for the east and west
galaxies, respectively). High spatial resolution HST imaging with ACS/F814W (Koekemoer et al. 2007; Scoville et al.
2007) and WFC3/F140W (single-orbit; 40 minute exposure
on-source), with the latter provided through an unrelated Cycle 25 program (PI J. Silverman; Program #15115), aids in our characterization of the system as an ongoing merger. For instance, the two galaxies are undergoing a strong interaction as indicated by the presence of tidal features and a stellar bridge between the two nuclei seen in the WFC3 image. The HST/ ACS mosaics and the WFC3 image (A. Koekemoer 2018, private communication) have been reprocessed where the astrometry is directly tied to the International Celestial Reference Frame (ICRF), thereby eliminating uncertainties from possible offsets in older catalogs previously used to align HST images. For ACS, this correction resulted in a 5 pixel (0 15) shift. The new astrometric solution for both images shows near perfect alignment between the bright UV and IR emission of the western galaxy with the ALMA centroid of the CO(5–4) emission, as shown in the bottom panels of Figure1
by the red crosses. Here, we provide details on the use of the multi-wavelength photometry available from the COSMOS survey to accurately measure the stellar mass and SFR, both key quantities required in the analysis of the ALMA observations of the individual galaxies.
2.1. Stellar Mass(Mstellar)
The mass in already formed stars is a key measurement for insight into the growth history of galaxies and the current mode of star formation, such as being in a starburst phase like PACS-787. Multiple broadband images of the COSMOSfield, which covers from ultraviolet to infrared, are used to measure the stellar mass, as was done in Laigle et al.(2016). Since the galaxies are
slightly blended, we use GALFIT (Peng et al. 2010) to
separately measure fluxes in seven optical bands (g, r, i, z; Subaru/HSC; Tanaka et al.2017and near-infrared(Y, H, Ks; UltraVISTA; McCracken et al.2012) for each component. To
measure the stellar mass, we fit the photometry using models (Bruzual & Charlot 2003) that include a mixture of different
stellar populations. The code Hyperzmass (i.e., a modified version of Hyperz, Bolzonella et al. 2000) is used to perform
the fit while implementing a constant star formation history (SFH). The stellar mass estimate accounts for stellar mass loss as described in Pozzetti et al. (2007). We highlight that
degeneracies between parameters such as stellar age, metallicity, and extinction affect the stellar mass estimates and are accounted for in the 68% confidence interval based on the χ2statistic.
In Figure2, we show the best-fit model to the spectral energy distribution for the separate components of PACS-787. We note that the assumption of a constant SFH will result in lower stellar masses than if assuming an exponentially declining
Figure 1. Optical-to-infrared imaging of PACS-787. Top row(ground-based): two left panels show the Subaru/HSC optical images while the UltraVISTA (McCracken et al.2012) near-infrared image is on the right. The two galaxies are visible in each frame. A small red cross indicates the centroid of each component
based on the CO(5–4) emission that is co-spatial with the IR but offset with the locations in the bluer images, as typically seen for high-z starbursts (Silverman et al.2015a) and more typical high-z galaxies (Cibinel et al.2017). Bottom row (space-based): HST imaging in the ACS F814W and WFC3 F140W filters with a
linear and log scale, respectively. The green circle indicates the location of thefiber used to acquire an NIR spectrum with Subaru/FMOS.
model with a recent burst. However, the sum of the two best-fit SEDs gives mid-IR fluxes, which are within 10% of the measured Spitzer/IRAC fluxes, indicating that the two galaxies do not contain additional mass that is unaccounted for by the photometry used for the SEDfit. Continuum emission from the type 2 AGN(Appendix) in the western galaxy is negligible and
thus does not impact the stellar mass measurements. The stellar masses of each, with uncertainties based on photometric errors, are reported in Table2and are shown in Figure2 assuming a Chabrier IMF. The galaxies have a stellar mass ratio of 4.2:1, which is indicative of a marginal major merger. However, when also considering the mass of the molecular gas (see Section 6.1), the mass ratio becomes ∼2: 1, which definitely
qualifies the system as a major merger. 2.2. Star Formation Rate
Far-infrared (FIR) emission, primarily from cool and warm dust heated by young massive stars, has been demonstrated to be an accurate indicator of the SFR of galaxies (Kennicutt & Evans 2012), particularly starbursts, which are heavily
enshrouded by dust. Hence, we measure the total FIR luminosity that is determined from an integral of a best-fit dust model over the wavelength range 8–1000 μm.
Dust emission is measured using models(Draine & Li2007)
that fit the observations covering the mid- to far-infrared wavelengths(e.g., Magdis et al.2012a). As shown in Figure3, continuum emission from PACS-787 is detected by Spitzer/ MIPS(24 μm), Herschel/PACS (100 and 160 μm), Herschel/ SPIRE (250, 350 and 500 μm), and ALMA (1.28 mm) that covers the extent of the FIR spectral energy distribution(SED). Following Magdis et al. (2012a), we simultaneously fit the
broadband SED using a model with five components: stellar light, warm and cool dust, an AGN, and radio power-law emission. The latter is decoupled from the globalfit. We do not require energy balance between the FIR and absorbed UV emission since the dust and UV radiation in starbursts are not co-spatial, as is the case for PACS-787 and our full starburst sample(Silverman et al. 2015a; Puglisi et al.2017).
The dust model is expressed by Equation(2) of Magdis et al. (2012a) with six free parameters (qPAH, Umin, Umax,α, γ, Mdust).
The stellar component is approximated by a stellar population model of Bruzual & Charlot(2003) with constant star formation
history, and a dust attenuation law of Calzetti et al.(2000) where
the color excess E(B-V) is an additional free parameter. The fraction of the dust in PAH grains is expressed as qPAH. The
radiation field is given as Umin, which illuminates most of
the diffuse dust while a smaller fraction(γ) is exposed to a higher radiationfield up to a value of 106for Umax. An indexα, fixed at
a value of 2, describes the distribution of the starlight intensity incident on the dust (dMdust/dUµU-a). The best-fit model is
found through aχ2minimization with a goodness-of-fit given by the reducedc . From this method, we find a total dust mass of2
M
log dust =9.20.06Mebased on thefit shown in Figure3.
Monte Carlo simulations are used to assess the error on Mdust.
From an integral of the best-fit dust model, the total FIR luminosity is logL=12.83±0.04 (units of Le) that corresponds to a total SFR=991 87M
96
-+ yr−1, using the calibration given in Kennicutt & Evans(2012), which includes the contribution from
both galaxies. This rate is in good agreement with that derived from the radio emission(1.4 and 3 GHz) (Schinnerer et al.2007; Smolčić et al. 2017) where the normalization of the power-law
model, shown in Figure3, is set by the IR-radio correlation with a parameterization from Ivison et al.(2010).
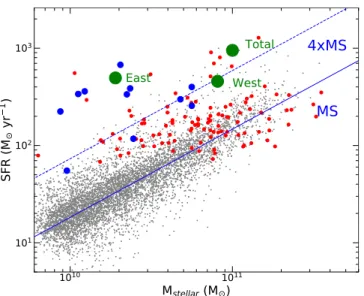
2.3. Location Relative to the Star-forming MS In Figure 4, we display the location of PACS-787 with respect to the star-forming galaxy population at 1.4<z<1.7 that delineates the known star-forming MS (e.g., Speagle et al. 2014; Renzini & Peng 2015). For this comparison, we
measure the stellar masses consistently between both samples to determine, as accurately as possible, the boost in SFR for PACS-787 at a given mass, which is used subsequently in our analysis. Star-forming galaxies are selected from the COSMOS photometric catalog (Laigle et al. 2016) with 1.4<z<1.7.
Stellar masses for this reference sample are remeasured, as described in Puglisi et al. (2017), using the same code, and
assumptions on the equivalent measurements for PACS-787. The only difference is that for PACS-787, we use the latest Subaru/HSC data. For the comparison sample, SFRs are based on the best-fit stellar population synthesis model. Reassuringly, the locus of the MS agrees very well with published relations as given in Daddi et al.(2007) and Kashino et al. (2013). For the
Herschel-detected galaxies (shown in red), the SFRs are
Figure 2.Best-fit stellar population model to optical–infrared photometry for the eastern (fainter) and western (brighter) galaxies separately with the respective best-fit stellar masses and extinction AV, as labeled.
Figure 3.SED of PACS-787(Total; east + west) with best-fit dust model (Draine & Li2007) to the FIR emission. The individual components to the fit
are shown in color(stars—cyan; AGN—yellow; warm dust—red; cool dust— purple). Blue squares show photometric measurements and their 1σ errors. A power-law radio spectrum highlights the agreement between star formation rate indicators.
computed based on the FIR–SFR relation (Kennicutt & Evans 2012). Considering here the sum of the stellar mass
for both galaxies, we show the location of PACS-787 at an elevation 6.5× higher with respect to the star-forming MS, thus securely undergoing a starburst event.
3. ALMA Observations and Data Analysis
As part of our program to measure the molecular gas properties of high-z starbursts (Silverman et al.2015a, 2018),
we obtained a low-resolution (1 7) observation of PACS-787 in ALMA Cycle 3(Project 2015.1.00861.S) to detect CO(2–1) at 91.31 GHz (Band 3). This target has the brightest CO emission of our full sample with ICO 2 1[ – ]=1.640.20 Jy km s−1. The emission, reproduced in Figure5, is indicative of a single source with marginal evidence of being extended. As shown in Figure 5 of Silverman et al.(2018), there are signs
of different kinematic components. The CO(2–1) luminosity of PACS-787, based on this observation, is used in this study (Section5.5) to measure the ratio of Mgasto LCO 1 0¢ - (aCO) with Mgasbeing assessed independent of the CO luminosity.
To determine the nature of this extreme starburst, we acquired a higher resolution CO(5–4) map of PACS-787, along with two additional starburst galaxies (830 and PACS-819) elevated above the MS star-forming population at similar redshifts. Here, we report on the observations of PACS-787 by itself since the nature of the source is distinct from the others with clear evidence for two gas-rich interacting galaxies at an early stage of the merger. In Table 1, we list the ALMA observations used in this study.
3.1. CO(5–4) and Continuum Emission at 1.28 mm PACS-787 was observed on 2016 November 7 with 43 12 m antennas as part of our Cycle 4 program (Proposal #2016.1.01426.S; PI J. Silverman). The antenna baselines
spanned a range of 18.6 m to 1.11 km, which resulted in beam size of 0 38×0 34 and a maximum recoverable scale of 2 98. Four spectral windows were assigned within Band 6 to detect the CO (5–4; νrest=576.27 GHz) emission line and underlying
continuum. The on-source integration time was 19.73 minutes. The calibration targets are J1058+0133 (bandpass, flux, pointing) and J0948+0022 (phase).
As part of the same program, PACS-787 was re-observed on 2017 March 18 with 42 antennas in a compact configuration having a maximum baseline of 278.9 m thus resulting in a beam size is 1. 9 ´ . The purpose of this observation was to1. 3 measure the total CO(5–4) emission including any component (see Section7) that may be undetected on larger scales with the
higher resolution observations. We employed the same four spectral windows in Band 6 as for the high-resolution observations. The target was observed for 10.2 minutes (on-source). Observations of standard calibration sources were taken as mentioned above. In the bottom panel of Figure5, we show the low-resolution CO(5–4) image of PACS-787.
Figure 4.Location of PACS-787 on the star-forming MS(SFR vs. Mstellar).
Both the sum(total) and the individual (east and west) galaxies are indicated by large green circles with the latter based on high-resolution ALMA continuum observations (Section 6.2). Galaxies with 1.4<z<1.7 in COSMOS are
shown for comparison (MS galaxies—gray dots; red symbols—Herschel-detected). The blue circles indicate those having CO(2–1) observations with ALMA. Slanted lines indicate the MS(solid; z=1.5) and a parallel track at an elevated rate of 4× (dashed).
Figure 5.Low-resolution ALMA imaging of PACS-787.(Top) CO(2–1) map with contours at 2, 4, 6, 8, 10´srms, whereσrms=0.085 Jy beam−1km s−1.
(Bottom) CO(5–4) map with contours at 2, 4, 8, 16, 24×σrms, where
σrms=0.1487 Jy beam−1km s−1. The ALMA beam size is shown in the lower
left of each panel.
3.2. Emission-line and Continuum Measurements We use Common Astronomy Software Applications (CASA) to carry out the processing of the ALMA raw data though the standard pipeline. From the visibility files, we then generate images using the task“clean” with a natural weighting scheme of the antenna pattern. The image cube is collapsed using “immoment” over a velocity range (given as Δv in Table 2) that encompasses the CO(5–4) line. Continuum
images make use of the full spectral range without channels having CO emission. We perform scientific analysis on the fits images as described below. Measurements are confirmed using a separate analysis package, GILDAS, and the task “uvmodelfit.”
4. Observational Results 4.1. Molecular Line Emission(CO 5–4)
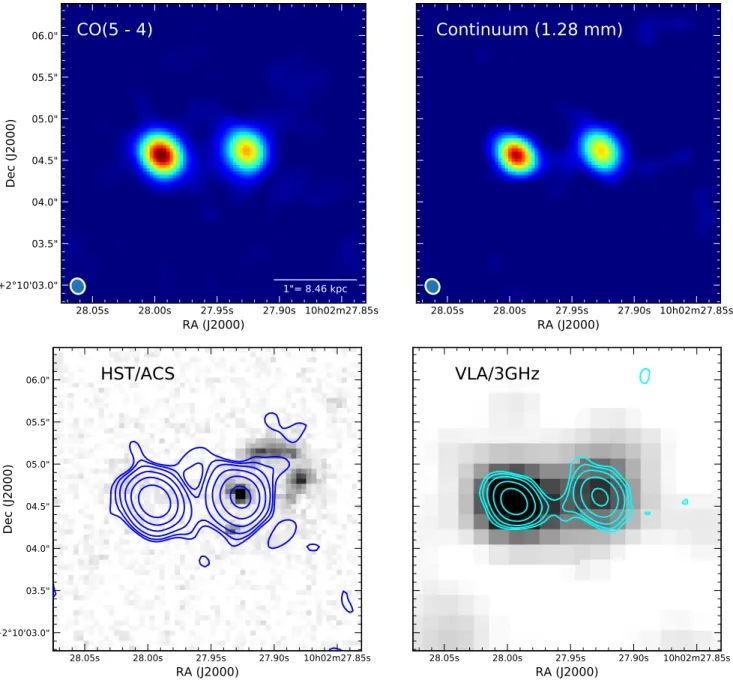
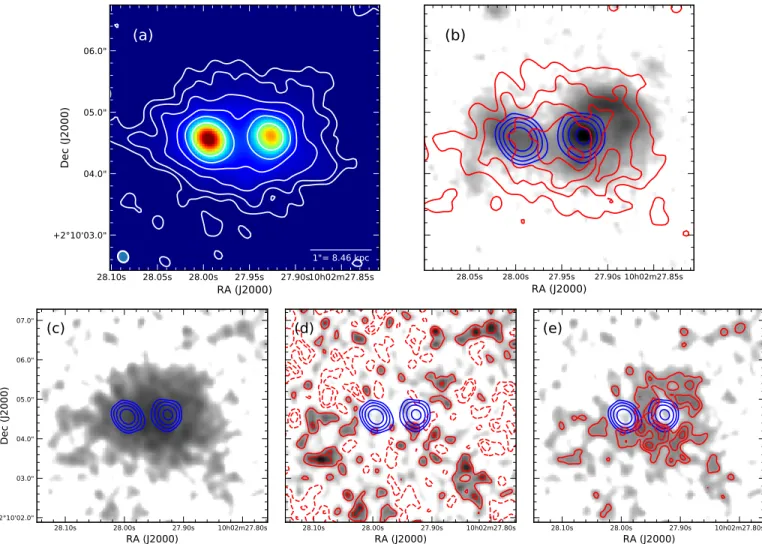
Using the high-resolution data, CO(5–4) emission from PACS-787 is detected at high significance, as shown in Figure6. As opposed to the single source seen at lower spatial resolution(Figure 5), we now detect two distinct galaxies that
each have bright CO(5–4) emission. The dual nature of the source at long wavelengths is also evident in the continuum at 1.28 mm (Figure 6, top-right panel) and in the radio (bottom-right panel) at 3 GHz (Smolčić et al. 2017). The galaxies are
clearly undergoing an interaction or merger as evidence by their close proximity both on the sky and along the line of sight with the two redshifts, based on the centroid of the CO emission (Figure 7), being very close to each other
(zeast=1.5256; zwest=1.5240), corresponding to a radial
velocity difference of ∼400 km s−1. In further support of a merger scenario, we see signs of low-level extended CO(5–4) emission(Section7) and diffuse stellar emission in the HST/
WFC3 F140W image (Figure 1), both evidence for a likely
bridge between the two galaxies.
We measure the CO properties of each galaxy separately by fitting the spatial distribution of the emission using the CASA tool“imfit” with an elliptical Gaussian model. This is carried out on an image of the CO emission, generated with the task “immoments,” with a channel (i.e., velocity) width encom-passing the full line profile (Δv) for each galaxy as given in Table2. From the centroid of each component, the projected separation of the two galaxies is 1 02 that corresponds to 8.65 kpc at z=1.5249. The half-light radii of the two galaxies are similar and∼1 kpc based on the size of the major axis (east: r1/2=0.106 ± 0 006=0.90 ± 0.05 kpc; west: r1/2=0 141 ± 0 005=1.19 ± 0.04 kpc). With respect to the strength of the CO emission, the eastern galaxy has a slightly higher velocity-integrated flux, ICOeast=2.82±0.08 Jy km s−1 (S/N=35), as compared to the western galaxy(ICOwest=2.03±0.10 Jy km s−1;
Table 1
Summary of ALMA Observations Used in This Study
Obs. Date Band Spectral Central Frequency Band Width Channel Width Integration Time Beam Size σrms
(UT) Feature (GHz) (GHz) (MHz) (minutes) (″) (mJy beam−1) 2016 Mar 04 3 CO(2–1) 89.00, 91.00a 1.875, 1.875 1.95, 1.95 6.55 2.7× 1.8 0.085b 101.10,103.00 1.875, 1.875 15.6, 15.6 2016 Nov 07 6 CO(5–4) 226.01, 228.43a 2.0, 1.86 15.62, 3.91 19.73 0.4× 0.3 0.045b 241.01, 244.01 2.0, 2.0 15.62, 15.62 2017 Mar 18 6 CO(5–4) 226.01, 228.43a 2.0,2.0 15.62, 15.62 10.2 1.9× 1.3 0.186b 241.01, 244.01 2.0, 2.0 15.62, 15.62 Notes. a
The central frequency in bold indicates the spectral window for which the CO line falls within.
b
rms noise level for a channel width of 600 km s−1centered on the CO emission line Table 2
PACS-787: Properties of Individual Components
Quantity East West Units Method
R.A. 10:02:27.995(d = 0. 004) 10:02:27.927(d = 0. 006) Centroid of the continuum emission Decl. +02:10:04.56 +02:10:04.61
zCO 1.5256 1.5240 Redshift;d =z 0.0001
Mstellar 1.9-+0.40.8´1010 8.1+-1.71.9´1010 M Chabrier IMF
ICO 5(-4) 2.82±0.08 2.03±0.10 Jy km s−1
Δv 748.7 338.4 km s−1 Velocity range over which ICO 5(-4)is measured. LCO 5 4¢ ( – ) 1.3´1010 9.5´109 K km s−1pc2
vFWHM 688.4±88.8 271.7±82.0 km s−1 CO velocity width at half maximum from Gaussianfit r1 2 0.90±0.05 1.19±0.04 kpc CO; half-light radius
i 55-+65 38-+107 degrees Disk inclination(CO)
f1.3mm 0.75±0.03 0.68±0.04 mJy f3 GHz 70.4±4.0 52.0±3.9 μJy SFR 515±56 476±47 Myr−1 Mgas 4.40.6´1010 3.20.4´1010 M fgas 70-+118 28-+67 % depl t 85±14 67±10 Myr
S/N=20). Considering the different velocity intervals over which the line is measured (Section4.2), the specific fluxes are SCOeast=3.77±0.11 mJy for the eastern and SCOwest=6.00±
0.30 mJy for the western components. Based on these integrated fluxes, the emission-line luminosities are calculated as follows (Carilli & Walter2013):
LCO 5 4 3.25 107SCO 5 4 v obsDL 1 z . 1
2 2 3
n
¢ = ´ D - ( + )- ( )
( – ) ( – )
Wefind high CO luminosities (LCO 5 4¢ - ) of 1.3× 10¹⁰(east) and 9.5× 10⁹K km s−1pc2(west). The sum of the CO(5–4) luminosity for both galaxies is close to the expected value of
LCO 5 4¢ - =2.0´1010 K km s−1pc2 based on the relation
(LCO5 4- versus LIR) from Daddi et al. (2015) and the total
SFR of 991 Meyr−1.
4.2. Gas Kinematics
There is much interest in determining the impact of a major merger on the kinematics of the gas that is initially confined to molecular disks in isolated gas-rich galaxies (e.g., Hopkins et al.2013). PACS-787 provides an opportunity to study the gas
kinematics in an early stage of such a merger. In fact, we find evidence for the CO emission-line profile for both galaxies to be consistent with a disk in rotation, especially that of the eastern galaxy with an apparent double horn (Figure 7, top panel).
Figure 6.High-resolution ALMA imaging of PACS-787 reveals two separate galaxies, both bright in CO(5–4; top-left panel) and continuum (1.28 mm; top-right panel), in the early stages of an interaction given the projected separation of 8.6 kpc. The ALMA beam size is shown in the lower left corner of the top two panels. HST/ACS imaging (bottom-left panel) only detects diffuse tidal features and a bright component in the western galaxy. The blue contours indicate the CO brightness level at 2, 3, 5, 10, 20, 40×σrmswhereσrms=0.039 Jy beam−1km s−1. In the bottom-right panel, the ALMA continuum emission(aqua blue contours at the same
multiples ofσrms=2.037 × 10⁻⁵Jy beam−1as the left panel) is in excellent agreement with radio emission at 3 GHz (Smolčić et al.2017), indicative of their
ongoing star formation. In each panel, north is up and east is to the left.
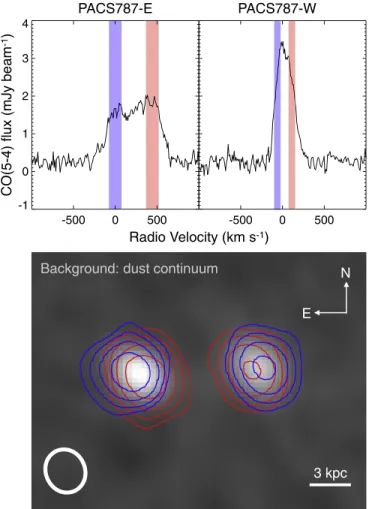
Furthermore, there is a clear relation between position and velocity of the CO emission for both galaxies as shown in Figure 8. To quantify the significance of the offset between position and velocity, we generate two images for each galaxy in narrow velocity intervals both redward and blueward of the line center as indicated in the top panels of Figure9. As expected for resolved emission if undergoing rotation, we find a significant displacement in the spatial location of the blue and red velocity maps for each galaxy(Figure9, bottom panels). For each galaxy, we measure the offsets between red and blue components to be
r 152 14
D = milliarcsec(1.29 ± 0.12 kpc) and rD =110 16 milliarcsec (0.93 ± 0.14 kpc) for the east and west galaxies, respectively. The difference in the location of the blue and red components for both galaxies indicate a scenario with the disks likely in counter-rotation(as further discussed in Section8).
It is also evident that the CO emission-line profiles of the two galaxies are noticeably different in width(e.g., Figure9);
the emission line of the western galaxy is significantly narrower
Figure 7.CO(5–4) emission-line profile for each galaxy. A best-fit model (in red) is shown for each galaxy based on a double Gaussian function of fixed velocity width with values given in the text and Table 2. The vertical line indicates the line centroid used to determine the redshift of each component. The horizontal line(in green) indicates the fit to the continuum that is included in the overallfit to the line profile.
Figure 8. Position–velocity map of the CO(5–4) emission. The image was constructed using a horizontal spatial region(i.e., collapsing the image along the declination axis) with a width of 5 pixels. The velocity scale is set to zero on the peak of the western source and positive velocities represent redshifted emission. Faint continuum emission is seen for each galaxy across all velocity channels.
Figure 9. CO velocity profiles (top panel) of each galaxy exhibit a double-peaked profile, indicative of coherent disk rotation, likely counter-rotating. This is illustrated by a comparison of the images of the CO emission both red- and blueward from the line center as overlaid on the 1.28 mm continuum image (gray scale; bottom panel). The offsets between the centroids of the red and blue emission for each galaxy are highly significant (east: Δr=152 ± 14 milliarcsec; west:Δr=110 ± 16 milliarcsec).
than its eastern counterpart. We perform a fit to the emission line to determine the full-width velocity at half maximum (vFWHM) of each galaxy with a double Gaussian model of a
singlefixed velocity width for each component (Figure7). The
centroid of each Gaussian component is allowed to vary. For both CO emission lines, we find acceptable fits to the line profile in each case (west: vFWHM=271.7 ± 82.0 km s−1, east:
vFWHM=688.4 ± 88.8 km s−1). This leaves little room for
additional components, such as those due to an outflow. As discussed in Section 5.1, we attribute the different velocity widths to a difference in inclination angle based on the axis ratio of an elliptical Gaussianfit to the CO surface brightness with the western galaxy being closer to face-on than the galaxy to the east.
4.3. Continuum Emission
For both galaxies, we detect the continuum with a high level of significance (east: S/N=25; west: S/N=17) at the observed wavelength of 1.276 mm (ν=235.0 GHz). In the top-right panel of Figure 6, we display an image of the two galaxies for which all of the spectral channels, devoid of CO line emission, have been summed. The continuum emission is co-spatial with the CO(5–4) emission. For the western galaxy, wefind similar fit parameters to the surface brightness using an elliptical Gaussian model (r1 2West=0.14 ). The eastern0. 02 continuum source is unresolved. The integratedflux density of the east(west) components are 0.75±0.03 (0.68 ± 0.04) mJy, respectively. In subsequent sections, we use the continuum emission to estimate the dust mass, dust-to-gas ratio, and SFR for each galaxy.
5. Molecular Gas Mass Through a Dynamical Assessment We measure the dynamical mass using a method widely employed in the literature (e.g., Tacconi et al. 2008; Daddi et al.2010a; Tan et al.2014; Tadaki et al.2017) to assess the
molecular gas content, independent of the CO luminosity or millimeter continuum. This allows us to evaluate the value of the factor to convert CO luminosity to molecular gas mass (Section 5.5) that is appropriate for our starburst sample and
possibly for high-z starbursts in general. This is accomplished by considering the contribution to the dynamical mass(within a half-light radius) from stars, molecular gas, and dark matter. As a novelty, we incorporate a correction(i.e., scale) factor ( fc) to
account for gas motions out of equilibrium that can falsely alter the measured dynamical masses due to turbulence, dispersion, clumpiness, and inflows/outflows (Section 5.2). We measure
the dynamical mass for each galaxy separately within a half-light radius(r1/2) for the case of a thin-disk rotator (Neri et al.
2001) as given here: M r r f r v G i 2 sin , 2 c dyn 1 2 1 2 FWHM 2 2 < = ´ ´ ( ) ( ) ( )
where vFWHM is the observed FWHM of the CO(5–4) line
profile and r1/2is the half-light radius as reported above and as
in Table 2. We acknowledge that the thin-disk approximation may be a poor choice for high-redshift galaxies, which are characterized by high velocity dispersion. Therefore, our estimates of Mdyn may be somewhat underestimated, and so
would be the gas mass(though part of this effect is included in the fcfactor).
5.1. Disk Inclination Angle
The disk inclination angle i is estimated from the output parameters of an elliptical Gaussian model fit to the spatial distribution of the CO(5–4) emission. We measure the value of i and its uncertainty from the ratio of the size of the minor to major axis. For example, the CO emission for the western galaxy has a major axis(FWHM) of 0. 28 0. 02and a minor axis of 0 22±0 02. We find the inclination angles to be 55-+65 (east) and 38-+107 (west) degrees for each respective galaxy. We highlight that these constraints on the inclination angle are afforded by the high S/N detections of the ALMA data. As expected, the difference in the inclination angles between the two nuclei concurs with the difference in the velocity widths of the CO lines with the western component closer to being face-on than the eastern nuclei. Remarkably, the differences in inclination of the gas distribution between the two galaxies agrees with the different shapes of the stellar light from each galaxy in the HST WFC3 image(Figure 1).
5.2. Evaluation of fcUsing Hydrodynamic Simulations
We use available simulations of gas-rich galaxy mergers (Fensch et al. 2017) with similar properties to PACS-787 to
determine how well our method to estimate the dynamical mass represents the true dynamical mass, since various physical effects, including turbulence, velocity dispersion, clumpiness, and inflows (non-equilibrium effects), may be non-negligible. Our simulation sample includes several mergers of galaxies, with initial conditions(dark matter halo concentration, stellar mass distribution, gas fraction) and interaction orbits repre-sentative of star-forming galaxies at redshift z=1–2. These simulations have a maximal resolution of 6 pc, making it possible to model very high-density gas up to∼105–6cm−3and to explicitly resolve the main sites of star formation. While these simulations predict that the SFR enhancement in gas-rich mergers at high redshift is, on average, weaker than in gas-poor low-redshift mergers, they do include phases with substantial SFR enhancements and deviations from the MS and Kennicutt– Schmidt relation that characterize isolated star-forming galaxies.
We use this sample of simulations to determine the difference between the“observed” and “true” dynamical mass. Specifically, we select 15 snapshots where the merger has triggered a substantial SFR enhancement(>3×) and generate 10 random projections for each snapshot. We exclude projections where the angular momentum is inclined by less than 20° or more than 70° from the line of sight because the observed morphology of PACS-787 strongly suggests that the system is not observed as being close to edge-on(the spatial distribution of gas in each galaxy would be highlyflattened), and the observed velocity gradients indicate that the system is not observed close to being face-on (the projected velocity amplitudes would be substantially lower). The simulated projections are distributed in an isotropic manner over the allowed range. We post-process the simulation outputs with a dedicated tool (Bournaud et al. 2015) that models CO(5–4)
emission, smoothed to match the spatial resolution of the ALMA observations, and use the mock CO emission line to estimate the dynamical mass as defined in Equation (2). We
compare to the dynamical mass encompassed in the same region(which is directly known in simulations). We find that our dynamical mass estimates are low by a factor of 2.0
(Figure 10). The underestimated value results from projection
factors(i.e., the projection angle of PACS-787 is unknown and the mock data are analyzed without assuming a known projection angle) and physical effects such as turbulence and non-circular gas motions. We use the average ratio and dispersion (0.2 in log Mdyn Mreal) that encompasses 75% of the trials shown in Figure 10, as input ( fc) to our dynamical
mass estimate.
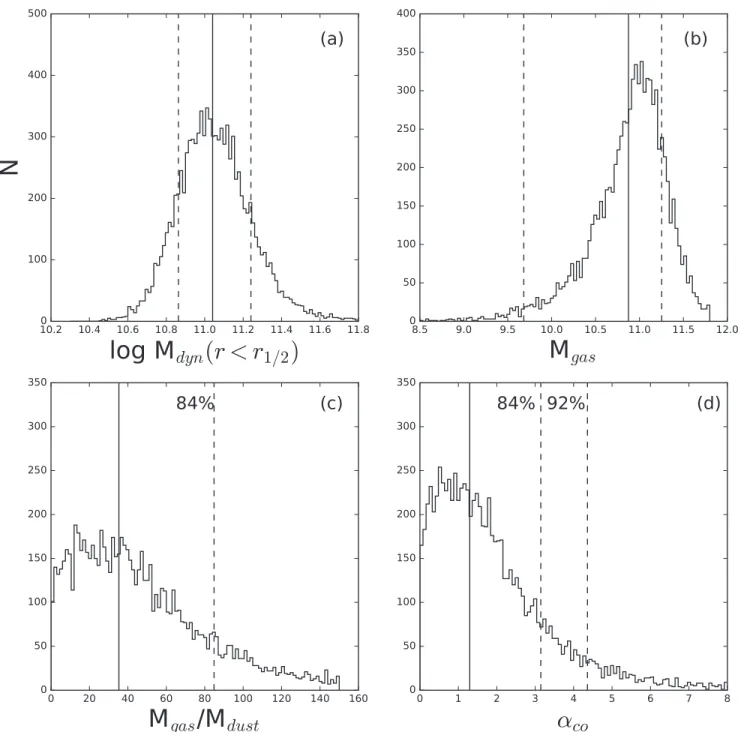
5.3. Likelihood Distribution of the Dynamical Mass We calculate the dynamical mass within a half-light radius, as given in Equation (2), by generating 10k realizations that
incorporate all sources of uncertainty while assuming Gaussian distributions for each parameter with errors (1σ) provided in Table2. For our purpose of using the dynamical mass to assess the amount of molecular gas mass independent of CO luminosity (see below), we sum the dynamical masses from both galaxies to lessen the effect of random errors on individual measurements. The results of this exercise are shown in Figure 11(a). In addition to the full distribution of trials,
we indicate the median dynamical mass (Mdyn(r<r1 2)= 1.1 0.4 10
0.6 ´ 11
-+ M
e) and an interval containing 68% of the
realizations.
5.4. Contribution of Gas to the Dynamical Mass The total gas mass(Mgas), including both galaxies, is derived
from the following equation that relates the different contribu-tions(i.e., Mgas, Mstellar, and Mdark matter) to the dynamical mass (Mdyn):
M 2 M r r M r r M .
3
dm
gas= ´[ dyn( < 1 2)- ( < 1 2)]- stellar ( ) Mdynis determined using Equation(2), which is applied to our
data and simulated observations of galaxy mergers are matched to the properties of PACS-787. This ensures that the distribution of Mgasincludes unphysical results that factor into
the assessment of the uncertainties. We assume that the dark matter mass(Mdm) is equal to 0.2× Mdynwith a dispersion of
0.05, consistent with that of local disk galaxies (De Blok et al.2008; Genzel et al.2017). The measurement of the stellar
mass is described in Section2.1. In Figure11(b), we show 10k
realizations to assess the distribution of Mgas, which has a
median gas mass and likelihood distribution (i.e., a 68% confidence interval) of Mgas 7.5 7.1 10
10.3 10
= -+ ´ M
e. The large
estimate of the lower bound of the confidence interval is due to a non-negligible fraction(14%) of cases that are unphysical due to a dynamical mass that is smaller than the stellar mass. Such solutions are primarily the result of uncertainties on each parameter, in particular, the inclination of the western galaxy (being closer to face-on) or a low correction factor fc. Even so,
there are important implications from placing a constraint on the maximum amount of gas that may be present, as demonstrated below.
5.5.αCO
We use the dynamical assessment of Mgasfor the sum of both
galaxies to estimate the median value and upper limits on the ratio of Mgas to LCO 1 0¢ - (aCO; units of Me (K km s−1pc2)−1), a key conversion factor used in the literature
to derive gas masses from the CO luminosity (see Bolatto et al.2013, for a review). Currently, there are few constraints on
CO
a at high redshifts. First, we measure the total CO(1–0) luminosity(LCO 1 0¢ - =5.790.69´1010K km s−1pc2) from our estimate of the CO(2–1) luminosity, as reported in Silverman et al. (2018), and the appropriate conversion factor
between CO excitation levels(LCO 2 1¢ - LCO 1 0¢ - =0.85;Daddi et al.2015). We confirm that an additional uncertainty (∼15%)
on LCO 2 1- , due toflux calibration, has no impact on the results due to the larger uncertainty on Mgas. With 10k realizations
(Figure 11(d)), we find the median aCO to be 1.3 Me (K km s−1pc2)−1. Due to the significant number of trials for
which our procedure fails to provide a physical result (i.e., a positive gas mass), we cannot place a reliable lower limit on the value of a . Although, a theoretical lower limit wouldCO correspond to ≈0.3 M (K km s−1pc2)−1 in the optically thin case (Papadopoulos et al. 2012; Bolatto et al. 2013). For the
upper limit, we find that 84% of the trials have a value less than 3.1 Me (K km s−1pc2)−1, as is shown in the figure. Furthermore, 92% of the realizations have a value less than
Figure 10.Hydrodynamic simulations of high-redshift galaxy mergers(Fensch et al.2017). (Top) Example simulation of CO-emitting gas in a galaxy merger
with similar properties to PACS-787 at a higher spatial resolution of 0 04 (350 pc at z=1.5) than our current data. (Bottom) Ratio of the dynamical mass as measured in Equation(2) compared to the “true” value from a suite of
simulations. The mean of the distribution of trials indicates that Mdyn is
4.36 Me (K km s−1pc2)−1 that is commonly used (Tacconi et al. 2018). If our stellar mass estimates are in reality higher,
the amount of gas will be effectively lower, as willa . UsingCO stellar masses based on a Salpeter as opposed to a Chabrier IMF, we find 96% of the trials to have aCO<4.36 Me
(K km s−1pc2)−1. Our estimate of
CO
a given here as 1.3 Me (K km s−1pc2)−1is used for subsequent estimates of the total
molecular gas mass for each individual galaxy in PACS-787 and the full sample of starbursts having CO(2–1) luminosities in Silverman et al.(2018).
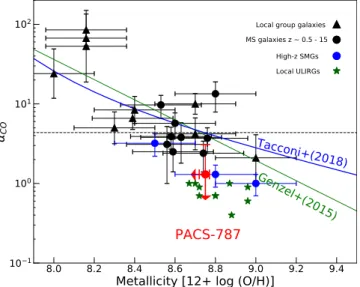
In Figure12, we compare our estimate ofaCOfor PACS-787 to other measurements in the literature and derived relations with gas-phase metallicity. We include results based on Local
Group galaxies (Leroy et al. 2011), MS galaxies with
z∼0.5–1.5 (Magdis et al. 2012a), high-z SMGs (i.e., GN
20, SMM J2135-0102, HERMES J105751.1+573027) and local ULIRGs (Downes & Solomon 1998). The gas-phase
metallicities are based on the calibration of Pettini & Pagel (2004). In addition, we show analytic relations from Genzel
et al. (2015) and Tacconi et al. (2018). The metallicity
measurement for PACS-787 is based on the [NII]/Hα ratio reported in the Appendix. From the figure, it is evident that PACS-787 has a value ofaCO closer to that of local ULIRGs and dissimilar to the value of 4.36 Me (K km s−1pc2)−1 ,as expected from published relations (e.g., Tacconi et al.2018).
As discussed in the Appendix, there may be an AGN that
Figure 11.Dynamical modeling of the total(i.e., sum of both galaxies) CO emission to derive the (a) dynamical mass within a half-light radius, (b) total gas mass, (c) gas-to-dust ratio, and (d) αCO, the ratio of Mgasto LCO 1-0. Median values and the 68% regions are indicated by the vertical lines in the top two panels. In the bottom panels, the median value is shown along with vertical dashed lines that indicate the value for which a percentage of trials, as given, are lower.
contributes to the emission-lineflux, in particular [NII] thus we have placed an arrow indicating that the metallicity may be lower. This has no effect on our conclusions since a lower metallicity would result in a further discrepancy with the relation given in Tacconi et al.(2018).
5.6. Dust-to-gas Ratio
Using the total dust mass (Section 2.2), we estimate the
likely value of the gas-to-dust(G/D) ratio to be 35 based on the median of 10k trials(Figure11(c)). On the upper limit, we find
that 84% of the trials have G D<83. Of course, the gas mass, hence G/D, has considerable uncertainty coming from the difference (Mdyn-Mstellar-MDM) of comparable quantities, each affected by sizable errors. The 10k realizations are meant to incorporate all known uncertainties. In any case, this range of the G/D ratio is consistent that from Magdis et al. (2012a)
given its high total stellar mass that likely indicates a high gas-phase metallicity based on the M–Z relation at z~1.5from Kashino et al. (2017). In fact, the [NII]/Hα ratio shown in Figure 16 could provide evidence for high-metallicity gas. Although, we cannot rule out the influence of a weak AGN on the line ratio.
6. Derived Physical Properties for Each Galaxy 6.1. Gas Masses
Preferably, the gas mass for each individual galaxy should be determined from a dynamical assessment based on their respective CO(5–4) emission. However, there are limitations with respect to this data set, when considering each galaxy separately, due to random effects that we are trying to mitigate as discussed above; thus, for this exercise, we determine the amount of molecular gas in each individual galaxy based on the CO emission which is calibrated by an independent analysis through dynamical modeling(Section5.4) to assess the conversion factor
CO
a . The total gas mass(Mgas=aCO´ ¢LCO1 0– ) is based on the CO(2–1) emission for the two blended galaxies, the conversion factor to CO(1–0) luminosity, and the value ofaCOto be 1.3 Me
(K km s−1pc2)−1. This is equivalent to using the median total gas
mass based on the dynamical argument given above while assessing the error on Mgas to reflect the error on CO(2–1)
luminosity and not on the uncertainty ofa . The contributionCO from each galaxy, to the total gas mass is then determined based on the ratio of the CO(5–4) emission that is cleanly separated between the two components (Figure6). This assumes that the
excitation states of the two galaxies are the same. As reported in Table 2, we find high gas masses for both galaxies: 4.4 0.6´1010 M
(east) and 3.20.4´1010 M (west). With these gas masses, we further estimate the gas fraction fgasto be
70-+118 (28-+67)% for the east (west) components respectively as given by Equation(4): f M M M . 4 gas gas gas stellar = + ( )
6.2. Star Formation Rates and Gas Consumption Timescales With each galaxy detected separately by ALMA, HST, VLA, and UltraVISTA, we assess the impact of the merger on the SFR for the individual components. We start from the total SFR for both galaxies(991-+8796 Myr−1) based on Herschel photometry (Section 2.2). We then determine the SFRs for each galaxy
separately(east: 515 ± 56 M yr−1; west: 476±47 M yr−1) under the assumption that the ratio (1.10 ± 0.08) of the continuum emission atlrest=505.5 mm , detected by ALMA, reflects the ratio in SFR. This assumes the dust species and temperature of both galaxies are the same and thus have similar SEDs.
As an independent check, we measure the SFR from the radio flux at 3 GHz (Smolčić et al. 2017) that is observed at
spatial resolution sufficient to detect each galaxy, as shown in the bottom-right panel of Figure6. It is interesting to note that the flux ratio of the 3 GHz emission between the eastern and western galaxy is 1.35, closer to theflux ratio of LCO 5 4( – )(1.39) than the 1.27 mm continuum. These differences are small with respect to the goals of this study, so they are of not of much concern. Even so, we convert the 3 GHzflux to the rest-frame luminosity at 1.4 GHz based on a power-law model with a spectral indexa = -0.7. Using the radio-SFR relation given in Bell(2003) and applying a conversion to a Chabrier IMF, we
find SFRs (east: 438 M yr−1; west: 323 M yr−1) in fairly good agreement with the estimates given above, including the western galaxy that may have a weak AGN based on a Chandra X-ray detection with very few X-ray counts (Appendix). Therefore, we do not find any evidence for the
AGN contributing to the radio luminosity.
Recently, Daddi et al. (2015) demonstrated that the
integrated CO(5–4) luminosity can be used as an indirect tracer of the SFR. As a check on the SFRs measured above, the
LCO 5 4¢ ( – ) for each galaxy is converted to SFR through its correlation with LTIR in Equation (4) of the aforementioned
paper. We find that SFRs are, in general, in very good agreement with those reported above. The western component is essentially the same while the eastern nucleus is slightly higher by 26%. Each of these methods based on the ALMA fluxes, either the integrated line emission or the continuum, indicate high levels of star formation(>300 Myr−1) in each galaxy.
Using the SFRs based on total LTIR and the ratio of the
continuum luminosity at 1.28 mm, we plot the location of each galaxy in relation to the star-forming MS in Figure4. Wefind that both nuclei are undergoing a starburst event, having SFRs
Figure 12. aCO as a function of gas-phase metallicity with PACS-787
indicated in red and all other reference samples and relations as described in the text.
elevated by 4× above the MS given their stellar mass estimates. In particular, the boost in SFR is notably high(15×) for the less massive galaxy, assuming that both galaxies were on the MS prior to the interaction.
With SFRs and gas masses for each galaxy, we calculate the ratio of these as a SFE(Equation (5)) with its inverse usually
denoted as a gas depletion timescale (tdepl):
M SFR; SFE 1 . 5 depl gas depl t t = = ( )
For both galaxies, we find short gas depletion timescales (<100 Myr). For instance, the eastern (western) galaxy is rapidly depleted of its gas reservoir on a mean timescale of 85±14 (67 ± 10) Myr. Both of these timescales are shorter than typical MS galaxies at these SFRs (Figure 13), in
agreement with that obtained from CO(2–1) observations of our larger sample of starburst galaxies(Silverman et al.2018)
with an assumption on aCO as measured above and local ULIRGs(Solomon et al. 1997).
7. Diffuse CO and Continuum Emission
We merged the visibilities from the compact and extended ALMA configurations (Band 6), only for this exercise, to gain sensitivity to extended structure and better estimate the total flux for our target galaxies. The combined image (Δv= 667.6 km s−1) is shown in Figure14(a) with overlying contours
that give the significance level of the CO emission. A multi-component fit was performed on the CO(5–4) visibility data with an elliptical Gaussian at the position of each of the two galaxies. After removing the two components associated with the galaxies, we found significant residuals with a 5σ peak, but with substantial extension (hence much higher significance; Figure 14(e)), even though each galaxy may have been
overestimated, as shown by the lower residuals(still positive) under each galaxy indicated by the blue contours.
With evidence for an extended component, we re-fit the data allowing for a third Gaussian component and inspected the residuals after subtracting the two galaxies. This resulted in the very extended signal shown by the red contours(Figure14(b))
and gray scale image(panel c) with minimal ( 2 s) residuals after subtracting all three components(panel d). With a three-componentfit, the significance of the diffuse component is 10σ based on the uncertainty of itsflux, after marginalizing over the other parameters. As a result of this exercise, we claim that the detection of the extended component of the CO(5–4) emission is robust as further supported by the existence of an extended component with the continuum-only visibilities (Figure 15).
This extended component appears to contain≈20% of the total flux of the system, both in terms of CO(5–4) emission and continuum. The diffuse gas/dust component is remarkably co-spatial with the stellar emission as seen in the HST/WFC3 image(Figure 14(b)) with the western component being more
extended for both the gas and stars. The peak emission is located between both galaxies and thus is possibly indicative of a bridge connection the two galaxies that may have been tidally stripped during the current or an earlier passage. Furthermore, the strength and morphology of the diffuse component matches very well to the simulation shown in the top panel of Figure10.
8. Discussion and Conclusions
With our ALMA observations of PACS-787, we can address the physical mechanisms or conditions in the ISM that can produce large enhancements in SFRs since hydrodynamic simulations(Di Matteo et al.2007; Fensch et al.2017) of
gas-rich galaxies at high-z generally tend not to exhibit the extreme levels of enhancement seen in PACS-787. This is because high gas fractions in isolated galaxies already induce high levels of turbulence and the formation of clumps(Bournaud et al.2011)
hence high levels of SFRs. PACS-787 is likely an exception that we discovered by selecting within our sample one of the most extreme in SFR above the MS for its stellar mass. Furthermore, the two starburst galaxies in PACS-787 are occurring at projected separation of 8.6 kpc. This is unexpected since hydrodynamic simulations usually have the starburst episodes at close to final coalescence. Here we discuss the particular characteristics of PACS-787 for which each may contribute to maximizing the rate of forming stars.
1. High gas content. Wefind large amounts ( 10> 10 M ) of molecular gas in each galaxy participating in the merger. The eastern galaxy actually has a slightly higher gas mass than stellar mass ( fgas 70 11%
8
= -+ ) while the western galaxy has a higher stellar mass and lower gas fraction (28 %6
7
-+ ). These gas fractions were likely higher prior to the initial interaction since we find ∼20% of the CO emission on larger scales stripped in the course of the close interaction.
2. Near-equal mass merger. The ratio of the masses(stars + gas) for the two galaxies is 2:1, thus classifying the system as undergoing a major merger. If only considering their stellar mass, the ratio would be reduced to 4:1. The consideration of not only the stellar mass but the molecular gas as well is important in assessing the impact of the merger since hydrodynamical simulations (e.g.,
Figure 13.Gas depletion time(tdepl=Mgas SFR) of the individual galaxies
associated with PACS-787 as a function of their SFR(green symbols) both with 1σ errors as indicated. The slanted black line is the best-fit relation from Sargent et al. (2014). Red (filled) data points mark our other 11 high-z
starbursts, as described in Silverman et al. (2018). The inverted triangle
represents a 3σ upper limit. Small gray circles (black triangles) represent SF MS galaxies at z<1 (>1) as compiled by Sargent et al. (2014) that include
samples from HERACLES (Leroy et al. 2013), COLD GASS (Saintonge
et al. 2011), THINGS (Walter et al. 2008), and additional higher redshift
studies(e.g., Daddi et al.2010a,2010b; Geach et al.2011; Magdis et al.2012b,
2017; Tacconi et al.2013). The blue symbols show the local ULIRGs (crosses;
Solomon et al.1997) and additional high-z starbursts (filled blue squares).
Cox et al. 2008) demonstrate that the boost in SFR in
galaxy mergers is sensitive to the mass ratio.
3. Central gas concentration. The majority of the CO-emitting gas is confined to regions within a few kiloparsec. The eastern and western galaxies have a half-light radius of 0.9 and 1.2 kpc, respectively, that are similar to local ULIRGs (Solomon et al. 1997) and
continuum observations with ALMA of high-z submilli-meter galaxies(Simpson et al.2015).
4. High SFE. Both galaxies are highly efficient at forming stars similar to those seen in local ULIRGs. Wefind very similar gas depletion times of∼70–80 Myr for the eastern and western galaxies respectively. These timescales indicate a consumption of their molecular gas much shorter than typical MS galaxies at an equivalent SFR (Figure 13).
5. Orbital configuration. Even with limited information on the orbital dynamics of the system, we estimate the amount of angular momentum, expressed as L =mgas´r1 2´ ,v
that may be canceled in the merger using our measurements
in hand for each galaxy: size(r1 2), inclination (i), velocity (v=vFWHM (2´sini)), and gas mass (mgas). In all four
possible orientations for the two disks (counter-rotating versus co-rotating (inclination being positive or negative with respect to the plane of the sky), the component of the total angular momentum in the plane of the sky for each individual galaxy will be opposite to each other. We note that in the co-rotating case, the disks are essentially perpendicular to each other hence there is no distinction from co- or counter-rotation. Wefind that the difference in angular momentum for the two components(in the plane of the sky) will be ∼37% of the sum of the angular momentum of both galaxies. This is a considerable amount of angular momentum that may be lost and possibly relevant in explaining the high SFRs. For this exercise, we neglect to consider the total angular momentum of the system.
We highlight that these results are derived from a procedure to assess the amount of molecular gas independent of the CO
Figure 14.Diffuse CO(5–4) emission. (a) ALMA CO(5–4) image generated from the combined low- and high-resolution data sets over a velocity interval (667.59 km s ;-1 channels 120-185) that encompasses the full extent of the CO line for both galaxies. The white contours indicate the CO brightness level at 1, 2, 4, 8, 16,
32´srms, wheresrms=4.67´10-5Jy beam−1.(b) After removing the CO emission from both galaxies (based on a three-component fit—see the text for details)
with their location marked by the blue contours, residual emission(i.e., diffuse gas; red contours at 2, 4, 6, 8, 10´srms) is present with a bright concentration (i.e., a
bridge) between the two nuclei. The diffuse emission supports the scenario that an earlier collision likely occurred at a smaller physical separation. The underlying HST/WFC3 image, shown in gray with a log scaling, displays stellar emission between the two galaxies and co-spatial with the diffuse CO emission. (c) Gray scale image of the diffuse component,fit as a third component, with log scaling. (d) Residual emission after removing all three components (red contours at −2 (dashed), −1, 1 (solid), 2´srms). (e) Residual emission after subtracting only two components (both galaxies) based on the two-component fit. Contours are shown at 2,
luminosity. The high signal-to-noise detection of CO(5–4) for each galaxy and the survival of the their kinematic structure as a disk at this stage of the merger allow us to carry out such an analysis. Whether this situation is fortuitous or prevalent throughout the high-z starburst population is yet to be determined. Additional examples are obviously needed given their impact on the use of CO as a tracer of the molecular gas mass at high redshift. We refer the reader to the discussion in Silverman et al.(2018) on the impact of uncertainties onaCOin measuring the molecular gas content for high-z starburst galaxies.
To conclude, the observations presented here of a quintes-sential starburst induced by the pre-merging interaction of two galaxies at high redshift demonstrate the remarkable capability of ALMA to study such systems in detail. In particular, the molecular gas and dust properties are measured for both galaxies at a stage in the merger prior tofinal coalescence. As
indicative of the interaction, we detect diffuse CO emission, likely tidally stripped, for thefirst time at high redshift (z 1). With sufficient spatial and spectral resolution, we were able to model the kinematics of the system to derive a dynamical mass and account of the mass contribution from the stellar and gas mass with an assumption on the amount of dark matter present. For the first time, we use simulations of galaxy mergers to calibrate the estimate of the dynamical mass, which indicates that other attempts may be off by a factor ∼2. As described above, this led to constraints on two key parameters(aCO and the G/D ratio) that are poorly established at high redshift. Finally, we expect that future ALMA observations of PACS-787 at a higher spatial resolution will unveil the structure of the gas and its velocity structure on scales (∼100 pc) of giant molecular cloud complexes.
We are grateful for the support from the regional ALMA ARCs. J.D.S. was supported by the ALMA Japan Research Grant of NAOJ Chile Observatory, NAOJ-ALMA-0127, JSPS KAKENHI grant No. JP18H04346, and the World Premier International Research Center Initiative(WPI Initiative), MEXT, Japan. C.M., A.R., and G.R. acknowledge support from an INAF PRIN-SKA 2017 grant. W.R. is supported by Thailand Research Fund/Office of the Higher Education Commission grant No. MRG6080294 and Chulalongkorn University’s CUniverse. G.E.M. acknowledges support from the Carlsberg Foundation, the ERC Consolidator Grant funding scheme(project ConTExt, grant No. 648179), and a research grant (13160) from Villum Fonden. N.A. is supported by the Brain Pool Program, which is funded by the Ministry of Science and ICT through the National Research Foundation of Korea (2018H1D3A2000902). This paper makes use of the following ALMA data: ADS/JAO. ALMA#2012.1.00952.S, ADS/JAO.ALMA#2015.1.00861.S, and ADS/JAO.ALMA#2016.1.01426.S. ALMA is a partner-ship of ESO (representing its member states), NSF (USA) and NINS(Japan), together with NRC (Canada), NSC and ASIAA (Taiwan), and KASI (Republic of Korea), in cooperation with the Republic of Chile. The Joint ALMA Observatory is operated by ESO, AUI/NRAO, and NAOJ.
Appendix AGN
PACS-787 may be the host to an AGN, powered by a supermassive black hole. There is very weak hard (2–7 keV) emission detected by Chandra (Figure 16; left panel). This source was not found in previous X-ray analysis (Civano et al. 2016) of the COSMOS field, possibly hampered by
having only four X-ray counts in the 2–7 keV band and at a distance of 11″ to a bright X-ray source to the southeast that has a photometric redshift of 1.27 (Marchesi et al. 2016).
Attributing all X-ray counts within an aperture of 8″ to PACS-787, the AGN would have LX ~2´1043 ergs s−1, which may be responsible for the high ionization state of the interstellar medium as indicated by the ratio [NII]/Ha = 0.540.04 (right panel). Although, we cannot rule out the possibility that PACS-787 has a high metallicity as opposed to an underlying AGN as the source of photoionization. Whether the X-ray detection is real or not, there is no impact on the analysis used in this study that would alter our conclusions.
Figure 15. Extended continuum emission is present after removing the contribution from both galaxies using either a three- (a) or two-component (b) fit for the individual components. Contour levels in red are 3, 5, 7, 9, 11´srms (2, 3, 4, 5´srms) in panel a (b), where srms=1.64´10-5 Jy
beam−1. The HST/WFC3 image is shown in gray. The aqua blue contours indicate the continuum emission from the individual galaxies at levels given in Figure6.