HAL Id: hal-00298621
https://hal.archives-ouvertes.fr/hal-00298621
Submitted on 19 Jan 2005HAL is a multi-disciplinary open access
archive for the deposit and dissemination of sci-entific research documents, whether they are pub-lished or not. The documents may come from teaching and research institutions in France or abroad, or from public or private research centers.
L’archive ouverte pluridisciplinaire HAL, est destinée au dépôt et à la diffusion de documents scientifiques de niveau recherche, publiés ou non, émanant des établissements d’enseignement et de recherche français ou étrangers, des laboratoires publics ou privés.
Landslide susceptibility mapping of Cekmece area
(Istanbul, Turkey) by conditional probability
T. Y. Duman, T. Can, C. Gokceoglu, H. A. Nefeslioglu
To cite this version:
T. Y. Duman, T. Can, C. Gokceoglu, H. A. Nefeslioglu. Landslide susceptibility mapping of Cekmece area (Istanbul, Turkey) by conditional probability. Hydrology and Earth System Sciences Discussions, European Geosciences Union, 2005, 2 (1), pp.155-208. �hal-00298621�
HESSD
2, 155–208, 2005 Landslide susceptibility mapping of Cekmece T. Y. Duman et al. Title Page Abstract Introduction Conclusions References Tables Figures J I J I Back CloseFull Screen / Esc
Print Version Interactive Discussion
EGU
Hydrol. Earth Syst. Sci. Discuss., 2, 155–208, 2005 www.copernicus.org/EGU/hess/hessd/2/155/ SRef-ID: 1812-2116/hessd/2005-2-155 European Geosciences Union
Hydrology and Earth System Sciences Discussions
Landslide susceptibility mapping of
Cekmece area (Istanbul, Turkey) by
conditional probability
T. Y. Duman1, T. Can2, C. Gokceoglu3, and H. A. Nefeslioglu1
1
General Directorate of Mineral Research and Exploration, Department of Geological Research, 06520 Ankara, Turkey
2
Cukurova University, Department of Geological Engineering, 01330 Balcali, Adana, Turkey
3
Hacettepe University, Department of Geological Engineering, Applied Geology Division, 06532 Beytepe, Ankara, Turkey
Received: 29 November 2004 – Accepted: 17 January 2005 – Published: 19 January 2005 Correspondence to: C. Gokceoglu ([email protected])
HESSD
2, 155–208, 2005 Landslide susceptibility mapping of Cekmece T. Y. Duman et al. Title Page Abstract Introduction Conclusions References Tables Figures J I J I Back CloseFull Screen / Esc
Print Version Interactive Discussion
EGU
Abstract
As a result of industrialization, throughout the world, the cities have been growing rapidly for the last century. One typical example of these growing cities is Istanbul. Today, the population of Istanbul is over 10 millions. Depending on this rapid urbaniza-tion, new suitable areas for settlements and engineering structures are necessary. For 5
this reason, the Cekmece area, west of the Istanbul metropolitan area, is selected as the study area, because the landslides are frequent in this area. The purpose of the present study is to produce landslide susceptibility map of the selected area by condi-tional probability approach. For this purpose, a landslide database was constructed by both air – photography and field studies. 19.2% of the selected study area is covered 10
by landslides. Mainly, the landslides described in the area are generally located in the lithologies including the permeable sandstone layers and impermeable layers such as claystone, siltstone and mudstone layers. When considering this finding, it is possible to say that one of the main conditioning factors of the landslides in the study area is lithology. In addition to lithology, many landslide conditioning factors are considered 15
during the landslide susceptibility analyses. As a result of the analyses, the class of 5– 10◦of slope, the class of 180–225 of aspect, the class of 25–50 of altitude, Danisment formation of the lithological units, the slope units of geomorphology, the class of 800– 1000 m of distance from faults (DFF), the class of 75–100 m of distance from drainage (DFD) pattern, the class of 0–10 m of distance from roads (DFR) and the class of low or 20
impermeable unit of relative permeability map have the higher probability values than the other classes. When compared with the produced landslide susceptibility map, most of the landslides identified in the study area are found to be located in the most (54%) and moderate (40%) susceptible zones. This assessment is also supported by the performance analysis applied at end of the study. As a consequence, the landslide 25
HESSD
2, 155–208, 2005 Landslide susceptibility mapping of Cekmece T. Y. Duman et al. Title Page Abstract Introduction Conclusions References Tables Figures J I J I Back CloseFull Screen / Esc
Print Version Interactive Discussion
EGU
1. Introduction
In Turkey, landslides are one of the important natural hazards. In the period of 1959– 1994, landslides damaged 76995 buildings throughout Turkey (Ildir, 1995) in addition to death of people, destroyed farming lands and roads etc. For this reason, the regional landslide susceptibility assessments have crucial importance for the landslide – prone 5
areas of Turkey. Within this framework, earth sciences, and geomorphology in particu-lar, may play relevant role in assessing areas at high landslide hazard and in helping to mitigate the associated risk, providing a valuable aid to a sustainable progress. Tools for handling and analysing spatial data (i.e. GIS) may facilitate the application of quan-titative techniques in landslide hazard assessment and mapping (Guzzetti et al., 1999). 10
However, it is possible to find many studies in literature for the landslide susceptibility and hazard mapping. The landslide susceptibility and hazard maps can be produced either by using direct mapping techniques or by using indirect mapping techniques. Di-rect hazard mapping, in which the degree of hazard is determined by the mapping ge-omorphologist, based on his experience and knowledge of the terrain conditions (van 15
Westen et al., 1999). Indirect hazard mapping, in which either statistical models or deterministic models are used to predict landslide prone areas, based on information obtained from the interrelation between landscape factors and the landslide distribu-tion (van Westen et al., 1999). In recent years, many studies on the indirect landslide susceptibility mapping have been published depending on the developments of GIS 20
techniques and the digital cartography. It is possible to produce a landslide susceptibil-ity map employing various indirect mapping techniques such as combination of index maps (Gupta and Joshi, 1990; Pachauri and Pant, 1992; Maharaj, 1993; Anbalagan and Singh, 1996; Gokceoglu and Aksoy, 1996; Turrini and Visintainer, 1998; Pachauri et al., 1998; Wachal and Hudak, 2000; Donati and Turrini, 2002; Ayenew and Barbieri, 25
2005), statistical analyses (Carrara et al., 1991; Jade and Sarkar, 1993; Atkinson and Massari, 1998; Fernandez et a., 1999; Guzzetti et al., 1999; Baeza and Corominas, 2001; Lee and Min, 2001; Pistocchi et al., 2002; Ercanoglu et al., 2004; Suzen and
HESSD
2, 155–208, 2005 Landslide susceptibility mapping of Cekmece T. Y. Duman et al. Title Page Abstract Introduction Conclusions References Tables Figures J I J I Back CloseFull Screen / Esc
Print Version Interactive Discussion
EGU
Doyuran, 2004a; Ayalew and Yamagishi, 2004), probabilistic approach (Gritzner et al., 2001; Rowbotham and Dudycha, 1998; Clerici et al., 2002), neural networks (Lee et al., 2001, 2003 and 2004; Gomez and Kavzoglu, 2004) and fuzzy approach (Juang et al., 1992; Binaghi et al., 1998; Ercanoglu and Gokceoglu, 2002 and 2004). It is evident that each landslide susceptibility assessment method considered by landslide 5
community has some advantages and drawbacks. For this reason, among the land-slide researchers, there is no agreement either on the methods or on the scope of producing hazard maps (Brabb, 1984). Surprisingly, Brabb’s idea (Brabb, 1984) is still valid for the techniques employed in landslide susceptibility mapping studies, because regional landslide susceptibility assessments pose complex problems due to a lack of 10
knowledge and variability.
A hundred years ago, the world population totalled 1.1 billion, and about 5% of peo-ple lived in cities. Today, the population has risen to 5.3 billion and approximately 45% of it is concentrated in urban areas. The most explosive growth has been in the de-veloping world, where urban populations have tripled in the last 30 years. Between 15
the years of 1950–1995, the number of cities with population of more than one million increased sixfold in the third world (Helmore, 1996; after Guzzetti et al., 1999). One typical example among the cities having explosive growth is Istanbul. This metropolitan city, located in the northern west of Turkey, is the most crowded city of Turkey with a population of above 10 million and Istanbul is also the financial and cultural centre of 20
Turkey. At the same time, it is a city world-famous for its natural beauty and historical monuments, reflecting its role as the capital of three separate empires. It enjoys the unique amenities of shorelines on the Black Sea, the Marmara Sea and the Bospho-rus Strait. The rapid growth of the city since the 1950s, due to rural migration, has affected the quality of life in various sections of the city (Dokmeci and Berkoz, 2000). 25
Due to this rapid growth of Istanbul, new settlement areas are needed and the study area is one of the new settlemet areas of Istanbul. In the study area (Fig. 1), new tall appartments, houses having two or three storeys and factories are constructed. Moreover, as a result of urbanization, new roads, highways and lifelines are built up.
HESSD
2, 155–208, 2005 Landslide susceptibility mapping of Cekmece T. Y. Duman et al. Title Page Abstract Introduction Conclusions References Tables Figures J I J I Back CloseFull Screen / Esc
Print Version Interactive Discussion
EGU
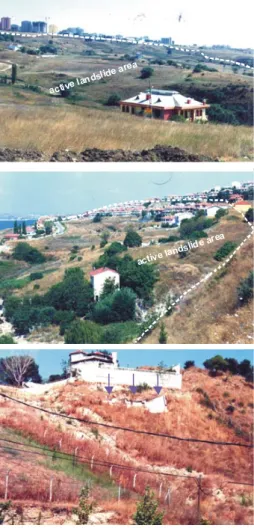
As can be seen in Fig. 2, many structures in the study area are constructed in active landslides and/or the areas susceptible to landsliding. For this reason, preparation of a realistic landslide susceptibility map for the planning and correct site selection pur-poses is indispensable. Generally, the landslide susceptibility maps help to planners and decision – makers for correct site selection and planning. For this reason, in this 5
study, production of landslide susceptibility map of a part of Istanbul, Cekmece area is aimed considering conditional probability method. This study is composed of four main stages such as (a) preparation of landslide inventory by air – photography studies, (b) field checks of landslide inventory, (c) preparation of index maps of the study area and production of landslide susceptibility map, and (d) assessment of performance of the 10
produced landslide susceptiblity map.
2. General properties of the study area
The study area locates at the northern coast of the sea of Marmara and western part of Istanbul metropolitan area (see Fig. 1). The Buyuk Cekmece lake, and the Kucuk Cekmece lake and Dikilitas creek are the western and eastern borders of the study 15
area, respectively. The study area is in the Marmara region having a high – seismicity. Recently, Turkey has experienced some large earthquakes. The 17 August 1999 Izmit earthquake on the NAF’s northern branch has also increased the earthquake risk in the Sea of Marmara (Parsons et al., 2000). More than 300 earthquakes are reported to have occurred between 2100 BC and AD 1900 (Soysal et al., 1981). The active north-20
ern branch of the Northern Anatolian Fault Zone (NAFZ) passes through the distance of 9 km from south of the study area. In the last 20 centuries, between Izmit and Gulf of Saros, 29 historically large (between 6.3 and 7.4 Ms) earthquakes occurred along the northern branch NAFZ (Ambraseys, 2002). One of the main landslide triggers is earthquakes while the other is heavy rainfall. The seismicity of the study area becomes 25
one of these triggers.
HESSD
2, 155–208, 2005 Landslide susceptibility mapping of Cekmece T. Y. Duman et al. Title Page Abstract Introduction Conclusions References Tables Figures J I J I Back CloseFull Screen / Esc
Print Version Interactive Discussion
EGU
area of the Middle-Late Eocene, observed in the eastern parts of the study area. The Ihsaniye formation, interfingered with the Kirklareli limestone, consists of sedimentary units such as shale-marls of the Late Eocene-Early Oligocene observed in the northern parts of the study area (Fig. 3). The Danisment formation of Late Oligocene includes alternance of sandstone, shale and marl with thin-moderate beddings (Fig. 4) (Duman 5
et al., 2004). This formation is observed at the western parts of the study area. Sand-stone and shale alternation bearing gypsum and coal layers comprising the Suloglu formation is interfingered with the Danisment formation. Tuffs, sandstones and gravel-stones form the Cantakoy formation, appear in the southwestern and southern parts of the area. The age of the Cantakoy formation is Early Miocene. The Ergene formation 10
unconformably lie over the Cantakoy formation. The age of the Ergene formation is Middle Miocene and it consists of sandstones and gravelly sandstones. This formation is observed at northern and southern parts of the area. The Bakirkoy formation, repre-sented by limestones and claystones, crops out middle parts of the area (Fig. 3). The age of the Bakirkoy formation is Late Miocene (Safak et al., 1999). The terraces un-15
conformably covers the oldest rocks and it is observed at the coast of Buyuk Cekmece lake. The youngest unit in the study area is actual alluviums.
In the area, some inactive normal faults are typical. The direction of these faults are generally northeast - southwest, but that of the most important normal fault, Yesilbayir fault, is roughly northwest – southeast (Duman et al., 2004). These faults can be 20
observed in the Miocene lithologies in the area. The dip values of the beddings of the sedimentary units in the area are rather low, 5–15◦. For this reason, the strikes and the dip directions exhibit a high variation in short distances. However, in the study area, there is no considerable folding.
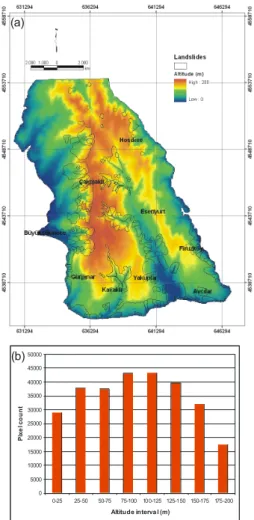
The altitude values vary between 0–200 m while the dominant altitude ranges are 25
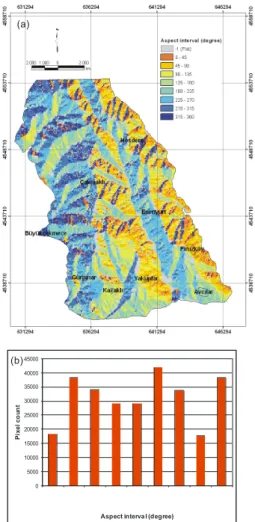
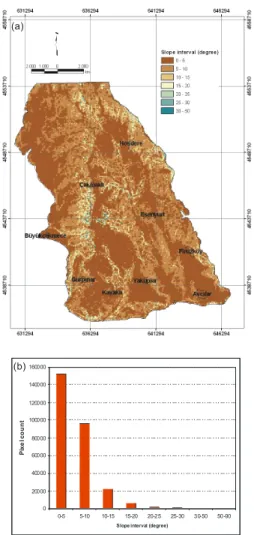
75–100 and 100–125 m (Figs. 5a and 5b). The study area has a dendritic drainage pattern, because of presence of soft lithologies and low slope angles. The general physiographic trend of the study area is NW–SE as can be seen in Figs. 6a and 6b. Although the range of slope angle values is 0 to 90◦, the majority of them are between
HESSD
2, 155–208, 2005 Landslide susceptibility mapping of Cekmece T. Y. Duman et al. Title Page Abstract Introduction Conclusions References Tables Figures J I J I Back CloseFull Screen / Esc
Print Version Interactive Discussion
EGU
0–20◦(Figs. 7a and 7b). These slope values indicate that the majority of the area has gentle slopes.
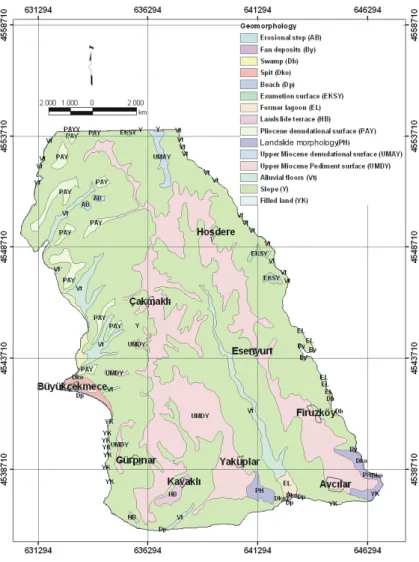
The geomorphology map of the study area was produced by Duman et al. (2004) (Fig. 8). In the study area, denudation and pediment surfaces, slope zones, transition zones, alluvial floors and coastal zones form the main geomorphological units. Consid-5
ering the purpose of the present study, the most important geomorphological units are the slope zones contributing the landslides occurrence. Especially, lower borders of the Late Miocene eroding surfaces are the failure surfaces of the landslides in the region (Duman et al., 2004). In addition, a dense landslide occurrence can be observed at the slope zones near the coast lines of the lakes and the Sea of Marmara in the area. 10
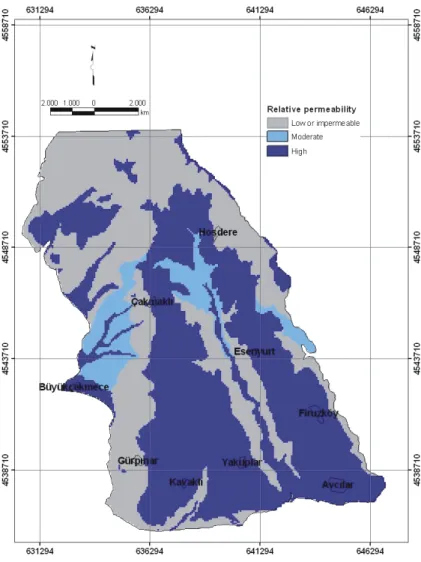
According to the relative permeability map of the lithologies prepared by Duman et al. (2004), considering the classification of proposed by Todd (1980), permeable, semi – permeable and impermeable units exist in the area (Fig. 9). Mainly, the eastern and southern parts of the area have permeable units while impermeable and semi – permeable units are dominant at the western and northern parts of the area. In the 15
area, there are many springs. These springs discharge along the borders of perme-able and semi or impermeperme-able units. This indicates that the permeperme-able units have a considerable groundwater. The main streams in the study area are the Dikilitas creek, Cekmece creek, Uzuncayir creek and Harami creek. The general stream direction of the Cekmece creek and Uzuncayir creek in the study area is from northeast to south-20
west and they discharge to the Cekmece lake while that of Dikilitas creek is northwest to southeast and it discharges to the Sea of Marmara. Besides, there are many lower order streams flowing only after rainy periods and their flowing directions are generally southwest.
In the region, the Marmara and Western Black Sea climate prevails. Generally, in 25
the summer season, the weather is hot and slightly rainy while the weather of winter seasons is warm and rainy. The topography of the region and presence of lakes and dams affect the weather conditions (http://istanbul.meteor.gov.tr). The region receives 85% of the total annual precipitation in rainy season, September–May (http://istanbul.
HESSD
2, 155–208, 2005 Landslide susceptibility mapping of Cekmece T. Y. Duman et al. Title Page Abstract Introduction Conclusions References Tables Figures J I J I Back CloseFull Screen / Esc
Print Version Interactive Discussion
EGU
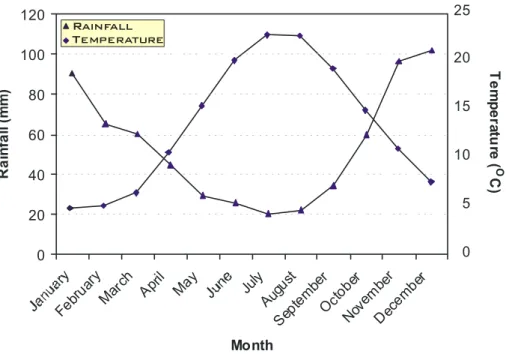
meteor.gov.tr). In this study, the data of Florya Meteorology Station, the nearest station to the study area, was employed. According to the meteorological data of the period of 1937–1990, the average monthly rainfall varies between 20.5 mm and 102.0 mm (Fig. 10). The annual precipitation varies between 500 mm and 1000 mm in the region while average annual precipitation of long period of the Florya Meteorology Station is 5
642.4 mm (DMI, 1990). The average monthly temperature varies from 5.3◦C to 23.2◦C. The coldest month is January with average temperature of 5.3◦C and the hottest month is July with average temperature of 23.2◦C. In winter seasons particularly, the region sometimes receive heavy precipitation causing some floods and triggering landslides. The maximum daily precipitation recorded in the period of 1937–1990 varies between 10
43.8 mm and 112.5 mm (DMI, 1990). When 112.5 mm is considered, the maximum rainfall intensity is calculated as 4.7 mm/h. As a consequence, the region has the landslide triggers such as earthquake and heavy precipitation. However, in this study, the conditioning factors are only taken into consideration when producing landslide susceptibility map.
15
3. Landslide characteristics
In the hope that the geomorphologic conditions of a specific dynamic type of mass movement (e.g. shallow translational landslides, debris flows, rock falls) can be suf-ficiently described by corresponding combinations of basic thematic maps (e.g. to-pographic slope, land cover, lithological units, distribution of past landslides) spatial 20
databases need to be constructed for analysing and modelling by geographical infor-mation systems (GIS) (Fabbri et al., 2003). In general, mapping past and recent slope movements, together with the identification and mapping of the conditioning or prepara-tory factors of slope instability, are the keys in predicting future landslides (Carrara et al., 1998). A reliable landslide inventory defining the type and activity of all landslides, 25
as well as their spatial distribution, is essential before any analysis of the occurrence of landslides and their relationship to environmental conditions undertaken (Soeters
HESSD
2, 155–208, 2005 Landslide susceptibility mapping of Cekmece T. Y. Duman et al. Title Page Abstract Introduction Conclusions References Tables Figures J I J I Back CloseFull Screen / Esc
Print Version Interactive Discussion
EGU
and van Westen, 1996). Therefore, it is possible to say that a reliable landslide inven-tory is a crucial part of a landslide susceptibility map among the parameters employed, because it is the fundamental component of the assessments.
In Turkey, there are no a landslide inventory at the national scale. For this reason, in this study, a landslide inventory was prepared by using the vertical black-and-white 5
aerial photographs of medium scale (1:35 000), dated 1955–1956, were used to iden-tify the landslides. When describing the type and activity of the landslides in the study area, the similar criteria defined in the Turkish Landslide Inventory Mapping Project initiated by the Natural Hazards and Environmental Geology division of the General Di-rectorate of Mineral Research and Exploration (MTA) were considered. In this project 10
(Duman et al., 2001), mass movements were classified according to the main types of classification proposed by Varnes (1978), i.e. flows, falls and slides. The landslides are also classified according to their relative depths, as shallow – (depth <5 m) and deep-seated (depth >5 m). For simplicity, their activities are classified into two groups as active and inactive. Active landslides are defined as those currently moving, whereas 15
inactive ones are as relict according to WP/WLI (1993). Shallow landslides are clas-sified as active because of their ongoing observed movements (Duman et al., 2005). The landslide locations described in the air-photography studies were controlled by field studies. One of the most important stages of landslide susceptibility mapping is to describe the factors governing the landslides identified in the area. To complete 20
this stage, an extensive field study is needed to describe the mechanisms, activity and conditioning factors of landslides. For this purpose, in this study, following the air-photography studies, a field study was conducted. During the field studies, some observations were carried out on the areal extent of landslides and their mechanisms. The characters of landslides identified in the area are mainly deep seated and active. 25
The landslides are the most frequent in the selected study area when compared with the Trakya region. The described landslides are generally located in the lithologies including the permeable sandstone layers and impermeable layers such as claystone, siltstone and mudstone layers. This is typical for the landslides identified in the study
HESSD
2, 155–208, 2005 Landslide susceptibility mapping of Cekmece T. Y. Duman et al. Title Page Abstract Introduction Conclusions References Tables Figures J I J I Back CloseFull Screen / Esc
Print Version Interactive Discussion
EGU
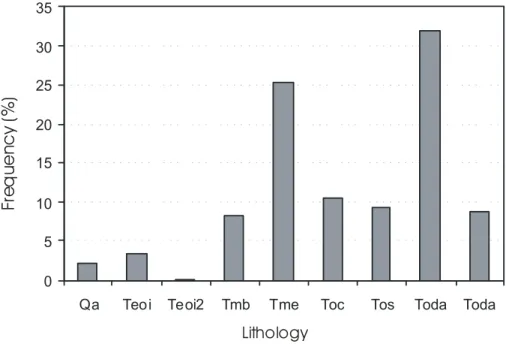
area. When considering this finding, it is possible to say that one of the main condi-tioning factors of the landslides in the study area is lithology. This can be seen clearly in Fig. 11. As can be seen in Fig. 11, the majority of the landslides (approximately 60%) occurred in two formations such as Danisment formation – Acmalar member (Toda) and Ergene (Tme) formations. An another factor governing the landslides is 5
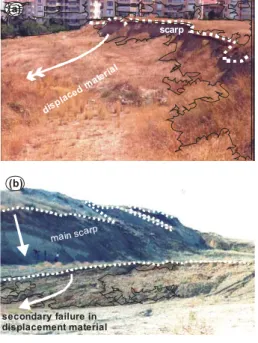
the sandstone bedding planes and their orientations. If there is a daylight between the orientation of slope and bedding plane, some large landslides occur (Fig. 12). In these areas, the beginning of the landslides are controlled by the bedding planes as planar failure, and then in the displaced and accumulated material, some rotational landslides are observed (Fig. 13). Rarely, in this material, some earthflows may occur depending 10
on the heavy rainfalls. The average failure surface depth of the landslides described in the study area is about 15 m (Arpat, 1999). Based on cross-sections, however, the es-timated maximum failure are about 20–25 m. The pixel number of the landslide areas is 53674, this indicates that 19.2% of the study area is covered by the landslides.
The most important topographical factor conditioning landslides is the slope angle. In 15
the regional landslide susceptibility or hazard assessments, several researchers (Roth, 1983; Barisone and Bottino, 1990; Koukis and Ziourkas, 1991; Anbalagan, 1992; Pachauri and Pant, 1992; Maharaj, 1993; Jager and Wieczorek, 1994; Anbalagan and Singh, 1996; Atkinson and Massari, 1998; Baum et al., 1998; Guzzetti et al., 1999; Zezere et al., 1999; Guzzetti et al., 2000; Jakob, 2000; Nagarajan et al., 2000) took into 20
consideration statistical techniques for the assessment of slope angle in terms of land-slide activity. In the study area, the frequency of the identified landland-slides reached peak value at the slope angle range of 5–15◦(Fig. 14) and the slope angle is considered as a conditioning factor during the analyses.
Although the relation between slope aspect and mass movement has long been in-25
vestigated, no general agreement exists on slope aspect (Carrara et al., 1991). Several authors (i.e. Carrara et al., 1991; Maharaj, 1993; Gokceoglu and Aksoy, 1996; Jakob, 2000; Nagarajan et al., 2000) considered the slope aspect as a factor conditioning the landslides. Mainly, the slope aspect is related to the general physiographic trend of the
HESSD
2, 155–208, 2005 Landslide susceptibility mapping of Cekmece T. Y. Duman et al. Title Page Abstract Introduction Conclusions References Tables Figures J I J I Back CloseFull Screen / Esc
Print Version Interactive Discussion
EGU
area and/or the main precipitation direction. The relationship between direction of the landslides and general physiographic trend of the area should be roughly perpendicu-lar. The general physiographic trend of the area is NW–SE and an important part of the landslides observed in the area studied has failure directions to NE and NW (Fig. 15).
Some authors (i.e. Pachauri and Pant, 1992; Ercanoglu and Gokceoglu, 2002) re-5
ported that the altitude is a good indicator for the landslide susceptibility assessments. However, in the area studied, there is no a considerable difference between the lowest and the highest altitude values, 200 m. For this reason, there is no an agreement be-tween landslide frequency and altitude (Fig. 16). Even though this finding, the altitude is taken into consideration in the analyses.
10
It can be thought as the structural elements such as faults, folds, joints or some parts of them, make the materials where landslides occur more susceptible to slid-ing because of material weakenslid-ing, stress accumulation or tectonic activity in different distances. However, there is not a consensus among the researchers about the dis-tances from the structural elements to be considered. As a result, the researchers 15
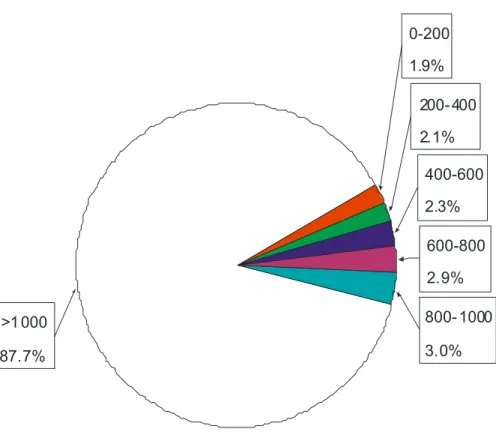
have used different distances with respect to the closeness to the structural elements in the literature (Anbalagan, 1992; Pachauri and Pant, 1992; Maharaj, 1993; Gokceoglu and Aksoy, 1996; Luzi and Pergalani, 1999; Donati and Turrini, 2002; Ercanoglu and Gokceoglu, 2004). In this study, inactive faults in the study area are considered as the structural elements and the distances of 0–200, 200–400, 400–600, 600–800, 800– 20
1000, and >1000 m to the faults are buffered (Fig. 17) and the landslide distribution in these buffer zones is shown in Fig. 18. It is evident that the majority of the landslides locates in the zone of >1000 m. However, the class of >1000 m is accepted as the zone unaffected from the faults. For this reason, during the analyses, the probability of this class is accepted as zero.
25
One of the important factors conditioning the landslides is the proximity to the drainage pattern, because streams may adversely affect the stability by either erod-ing the toe or saturaterod-ing the slope material or both (Gokceoglu and Aksoy, 1996). For this reason, this parameter is also evaluated by creating buffer zones of 0–25, 25–50,
HESSD
2, 155–208, 2005 Landslide susceptibility mapping of Cekmece T. Y. Duman et al. Title Page Abstract Introduction Conclusions References Tables Figures J I J I Back CloseFull Screen / Esc
Print Version Interactive Discussion
EGU
50–75, 75–100, 100–125, and >125 m (Fig. 19), and the results is given in Fig. 20. However, there is no an agreement between the landslide density and the proximity to drainage pattern. 85.3% of the landslides accumulate in the class of >125 m. However, this class is not considered during the analyses.
In addition to the lithological features, the relative permeability map of the units is 5
taken into consideration as the conditioning factors of the landslides. One of the main conditioning factors is permeability characteristic of the units (Fig. 21). 88.6% of the landslides is in the class of >50 m of the distance from roads (Fig. 22 and Fig. 23). This is typical for all the parameters having the line character such as roads, faults and drainage pattern. Due to the fact that this line character, the class of >50 m is not taken 10
into consideration during the analyses. The geomorphological units and land – units are considered in the landslide susceptibility analyses (Fig. 24). As an expected result, most of the landslides locate in the slopes while minority of them is observed in the landslide morphology (PH) and Upper Miocene infilling surfaces (UMDY).
4. Methodology
15
In the present study, the digital elevation model (DEM) was produced by digitizing 10 m altitude contours of the 1/25 000 scaled topographical maps. The slope, aspect and altitude maps obtained from the DEM are raster maps with a pixel size of 25×25 m. However, the other maps such as lithology, geomorphology, distance from faults, dis-tance from drainage, disdis-tance from roads, relative permeability and landslide inventory 20
are vector maps, and these maps were converted to raster maps with a pixel size of 25×25 m for the implementation in the susceptibility analyses.
Landslide susceptibility evaluation involves a high level of uncertainty due to data limitations and model shortcomings (Zezere, 2002). For this reason, the landslide re-searchers have considered different techniques for preparation landslide susceptibility 25
maps as mentioned in the introduction chapter of this paper. One of these techniques is statistical analyses. Among the statistical techniques, a special place is held by
Con-HESSD
2, 155–208, 2005 Landslide susceptibility mapping of Cekmece T. Y. Duman et al. Title Page Abstract Introduction Conclusions References Tables Figures J I J I Back CloseFull Screen / Esc
Print Version Interactive Discussion
EGU
ditional Analysis, a conceptually simple technique which is highly compatible with GIS operating features and produces results that can easily be assessed by non-specialists (Clerici et al., 2002). This method is profitably applied in relation to a particular land sur-face subdivision in the so-called Unique Condition Units (Carrara et al., 1995), Unique Condition Subareas (Chung et al., 1995) or pixels. Mainly the probability that event 5
A will occur if event B occurs is called the conditional probability (Negnevitsky, 2002). More specifically, the conditional probability approach considers a number of factors governing the landslides, which are thought to be strictly connected with landslide oc-currence. The data layers, in which each factor is subdivided into a convenient number of classes, are crossed in order to obtain all the possible combinations of the various 10
classes of the different factors (Clerici et al., 2002). Each specific combination rep-resents a pixel. Subsequently, the landslide spatial frequency, usually represented by the landslide density, is determined within each pixel. Assuming the already mentioned principle that slope-failure in the future will be more likely to occur under those condi-tions which led to past instability and working on the statistical concept whereby the fre-15
quency of an event, the density of an event, equals the probability that the same event will occur, the resulting landslide density equals the landslide susceptibility (Clerici et al., 2002). Conditional probability is denoted mathematically as p(AIB) (Eq. 1) (Neg-nevitsky, 2002).
P(A|B)= (the number of times A and B can occur)/(the number of times B can occur). (1) 20
The number of times A and B can occur, or the probability that both A and B will occur, is also called “joint probability” of A and B. It represents mathematically as P (A∩B). The number of ways B can occur is the probability of B, P (B);
P (A|B)= P (A ∩ B)/P (B). (2)
Similarly, the conditional probability of event B occurring given that event A has oc-25
curred equals;
HESSD
2, 155–208, 2005 Landslide susceptibility mapping of Cekmece T. Y. Duman et al. Title Page Abstract Introduction Conclusions References Tables Figures J I J I Back CloseFull Screen / Esc
Print Version Interactive Discussion
EGU
Hence,
P (B ∩ A)= P (B|A) × P (A). (4)
The joint probability is commutative, thus;
P (A ∩ B)= P (B ∩ A), (5)
therefore, 5
P (A|B)= [P (B|A) × P (A)]/P (B). (6)
The last equation (Eq. 6) is known as the Bayesian rule. This principle can extended to event A being dependent on a number of mutually exclusive events B1, B2, . . . , Bn. The following set of equations can then be derived from Eq. (2):
P (A ∩ B1)= P (A|B1) × P (B1) 10 P (A ∩ B2)= P (A|B2) × P (B2) : : P (A ∩ Bn)= P (A|Bn) × P (Bn) or, when combined;
15 P(A)= n X i=1 P(A ∩ B)= n X i=1 P(AIBi) × P(Bi). (7)
In the present study, Eq. (7) was employed to obtain the final susceptibility map the area.
The limitations of this approach are summarized by Clerici et al. (2002). According to these researchers (Clerici et al., 2002), one such limitation is the necessity to in-20
HESSD
2, 155–208, 2005 Landslide susceptibility mapping of Cekmece T. Y. Duman et al. Title Page Abstract Introduction Conclusions References Tables Figures J I J I Back CloseFull Screen / Esc
Print Version Interactive Discussion
EGU
the analysis. Otherwise, a high number of pixels of small dimensions, and so of little statistical significance, could result from the crossing of the data layers. But probably the most limiting aspect is that an eventual change of the factors, or simply their reclas-sification, implies restarting the entire procedure which, however conceptually simple it may be, is nevertheless complicated to execute. To overcome this difficulty, Clerici et 5
al. (2002) have produced a shell program (or shell script) that executes the procedure automatically making it, therefore, possible to repeat it quickly and with limited user involvement.
In recent years, the conditional probability approach has been applied successfully to produce landslide susceptibility maps by researchers (Clerici et al., 2002; Suzen and 10
Doyuran, 2004a; Lee, 2004). According to the findings of Suzen and Doyuran (2004b) and Lee (2004), the logical regression analysis seems to be more consistent when compared with the conditional probability. However, the application of conditional prob-ability to the production of landslide susceptibility maps is easy; the process of input, calculation, and output can be readily understood. Also, the speed of bivariate meth-15
ods could be said to be an advantage over multivariate methods (Suzen and Doyuran, 2004b). For these reasons, the conditional probability approach is preferred to prepare the landslide susceptibility map of Cekmece area.
In the first stage of the application of the conditional probability approach, the p(A|B),
p(A) and p(B) values are calculated (Table 1). Then, the probability values for landslide
20
susceptibility are calculated for each pixel by summing up the p(A) values of each conditioning parameter considered in this study. Considering the probability values, the final landslide susceptibility map of the Cekmece area is produced (Fig. 25). Also, to assess the weights of the parameters visually, the weights of each parameter class are calculated (Eq. 8) and given in Fig. 26.
25
w= P (A|B) – (area of all landslides)/(whole area). (8)
As can be seen in Fig. 26, some classes of the lithology, slope, aspect, altitude, ge-omorphology, distance from drainage and relative permeability are the most effective parameters on the landslides identified in the study area (Fig. 26).
HESSD
2, 155–208, 2005 Landslide susceptibility mapping of Cekmece T. Y. Duman et al. Title Page Abstract Introduction Conclusions References Tables Figures J I J I Back CloseFull Screen / Esc
Print Version Interactive Discussion
EGU
When making a close inspection to the produced susceptibility map, it can be ob-served that a considerable part of the slopes having NW–SE direction have the most susceptible zones to landsliding (Fig. 25). When compared with the produced landslide susceptibility map for the Cekmece area, all of the landslides identified in the study area are found to be located in the most (54%) and moderate (40%) susceptibility classes. 5
As far as performance of the conditional probability approach for processing is con-cerned (Fig. 27), the images appear to be quite satisfactory, the zones described on the map being zones of relative susceptibility. The approach employed herein can be taken into consideration to be practical for assessing the susceptibility to landsliding. The produced landslide susceptibility map will help to the decision makers during site 10
selection and site planning processes. This map may also be accepted as a basis for the landslide risk management studies to be applied in the study area.
5. Results and conclusions
The following results and conclusions can be drawn from the present study.
The sedimentary units having different ages form the lithology of the study area 15
are shale – marls of the Late Eocene – Early Oligocene, alternance of sandstone, shale and marl of Late Oligocene, tuffs, sandstones and gravelstones of Early Miocene, sandstones and gravely sandstones of Middle Miocene, limestones and claystones of Late Miocene, the terraces and actual alluviums. The dip values of the beddings of these sedimentary units are rather low. For this reason, the strikes and the dip 20
directions exhibit a high variation in short distances. However, in the study area, there is no considerable folding while some inactive normal faults are typical. The direction of these faults are generally NE–SW.
The study area has a dendritic drainage pattern, because of presence of soft litholo-gies and low slope angles, and the general physiographic trend of the study area is 25
NW–SE. The majority of the area has gentle slopes.
HESSD
2, 155–208, 2005 Landslide susceptibility mapping of Cekmece T. Y. Duman et al. Title Page Abstract Introduction Conclusions References Tables Figures J I J I Back CloseFull Screen / Esc
Print Version Interactive Discussion
EGU
are typically located in the lithologies including the permeable sandstone layers and impermeable layers such as claystone, siltstone and mudstone layers. Considering this finding, it is possible to say that one of the main conditioning factors of the landslides in the study area is lithology. An another factor governing the landslides is the sandstone bedding planes and their orientations. If there is a daylight between the orientation of 5
slope and bedding plane, some large landslides occur. In these areas, the beginning of the landslides are controlled by the bedding planes as planar failure, and then in the displaced and accumulated material, some rotational landslides are observed. Rarely, in this material, some earthflows may occur depending on the heavy rainfalls.
Altitude, slope, aspect, lithology, distance to faults, distance to drainage, distance 10
to roads, geomorphological units and relative permeability map are considered as the conditioning factors of the landslides. The results of conditional probability analyses revealed that the classes of 5–10◦ of slope, the class of 180–225 of aspect, the class of 25–50 of altitude, Danisment formation – Acmalar member (Toda) of the lithological units, the slope units of geomorphology, the class of 800–1000 m of distance to faults, 15
the class of 75–100 m of distance to drainage pattern, the class of 0–10 m of distance to roads and the class of low or impermeable unit of relative permeability map have the higher probability values than the other classes.
When compared with the so – prepared landslide susceptibility map, all of the land-slides identified in the study area are found to be located in the most (54%) and mod-20
erate (40%) susceptible zones. This assessment is also supported by the performance analysis. As a consequence, the produced landslide susceptibility map can be ac-cepted as valuable performance for the planning purposes.
The produced landslide susceptibility map will help to the decision makers during site selection and site planning processes. This map may also be accepted as a basis 25
HESSD
2, 155–208, 2005 Landslide susceptibility mapping of Cekmece T. Y. Duman et al. Title Page Abstract Introduction Conclusions References Tables Figures J I J I Back CloseFull Screen / Esc
Print Version Interactive Discussion
EGU
References
Ambraseys, N.: The seismic activity of the Marmara Sea region over the last 2000 years, B Seismol. Soc. Am., 92, 1, 1–18, 2002.
Anbalagan, R.: Landslide hazard evaluation and zonation mapping in mountainous terrain, Engineering Geology 32, 269–277, 1992.
5
Anbalagan, R. and Singh, B.: Landslide hazard and risk assessment mapping of mountainous terrains – a case study from Kumaun Himalaya, India, Engineering Geology, 43, 237–246, 1996.
Arpat, E.: B ¨uy ¨ukcekmece ile Kucukcekmece (Istanbul) heyelanlarinin genel ozellikleri ve yarat-tiklari baslica sorunlar, In: Proceedings of the 52, Turkey Geological Congress, 17–23, 1999
10
(In Turkish).
Atkinson, P. M. and Massari, R.: Generalised linear modelling of susceptibility to landsliding in the Central Appenines, Italy, Computers and Geosciences, 24, 4, 373–385, 1998.
Ayalew, L. and Yamagishi, H.: The application of GIS-based logistic regression for landslide susceptibility mapping in the Kakuda-Yahiko Mountains, Central Japan, Geomorphology,
15
doi:10.1016/j.geomorph.2004.06.010, in press, 2004.
Ayenew, T. and Barbieri, G.: Inventory of landslides and susceptibility mapping in the Dessie area, northern Ethiopia, Engineering Geology, in press, 2004.
Baeza, C. and Corominas, J.: Assessment of shallow landslide susceptibility by means of multivariate statistical techniques, Earth Surface Processes and Landforms, 26, 1251–1263,
20
2001.
Binaghi, E., Luzi, L., Madella, P., Pergalani, F., and Rampini, A.: Slope instability zonation: a comparison between certainty factor and fuzzy Dempster – Shafer approaches, Natural Hazards, 17, 77–97, 1998.
Barisone, G. and Bottino, G.: A practical approach for hazard evaluation of rock slopes in
25
mountainous areas, Proceedings of the 6th Int. IAEG Cong., Balkema, 1509–1515, 1990. Baum, R. L., Chleborad, A. F., and Schuster, R. L.: Landslides triggered by the winter 1996–
1997 stroms in the Puget Lowland, Washington, U.S. Geological Survey, Open-File Report 98-239, 1998.
Brabb, E. E.: Innovative approaches to landslide hazard and risk mapping, In: Proceedings of
30
4th International Symposium on Landslides, September 1984, Toronto, Canada, 1, 307–323, 1984.
HESSD
2, 155–208, 2005 Landslide susceptibility mapping of Cekmece T. Y. Duman et al. Title Page Abstract Introduction Conclusions References Tables Figures J I J I Back CloseFull Screen / Esc
Print Version Interactive Discussion
EGU
Carrara, A., Cardinali, M., Detti, R., Guzzetti, F., Pasqui, V., and Reichenbach, P.: GIS tech-niques and statistical models in evaluating landslide hazard, Earth Surface Processes and Landforms, 16, 5, 427–445, 1991.
Carrara, A., Cardinali, M., Guzzetti, F., Reichenbach, P.: GIS based techniques for mapping landslide hazard, (http://deis158.deis.unibo.it), 1995.
5
Carrara, A., Guzzetti, F., Cardinali, M., and Reichenbach, P.: Current limitations in modeling landslide hazard, In Proceedings of IAMG’98, edited by Buccianti, A., Nardi, G., and Potenza, R., 195–203, 1998.
Clerici, A., Perego, S., Tellini, C., and Vescovi, P.: A procedure for landslide susceptibility zonation by the conditional analysis method, Geomorphology, 48, 349–364, 2002.
10
Chung, Ch., Fabbri, A. G., van Westen, C. J.: Multivariate regression analysis for landslide hazard zonation, In Geographical Information Systems in Assessing Natural Hazards, edited by Carrara, A. and Guzzetti, F., Kluwer Academic Publishing, Dordrecht, The Netherlands, 7–142, 1995.
DMI (State Meteorological Organization): Temperature and Precipitation Records of Florya
15
Station, DMI, Ankara, 1990.
Dokmeci, V. and Berkoz, L.: Residential – location preferences according to demographic char-acteristics in Istanbul, Landscape and Urban Planning, 48, 45–55, 2000.
Donati, L. and Turrini, M. C.: An objective method to rank the importance of the factors pre-disposing to landslides with the GIS methodology: application to an area of the Apennines
20
(Valnerina; Perugia, Italy), Eng. Geol., 63, 277–289, 2002.
Duman, T. Y., Emre, ¨O., Can, T., Ates, S., Kecer, M., Erkal, T., Durmaz, S., Dogan, A., Corek-cioglu, E., Goktepe, A., CiCorek-cioglu, E., and Karakaya, F.: Turkish Landslide Inventory Mapping Project: Methodology and results on Zonguldak quadrangle (1/500000), Working in progress on the Geology of Turkey and its surroundings, In: Abstract Book of the 4th Int. Turkish
Ge-25
ology Symp., 24–28 September 2001, 392, 2001.
Duman, T. Y., Kecer, M., Ates, S., Emre, O., Gedik, I., Karakaya, F., Durmaz, S., Olgun, S., Sahin, H., and Gokmenoglu, O.: Istanbul Metropolu Batisindaki (Kucukcekmece – Silivri – Catalca yoresi) Kentsel Gelisme Alanlarinin Yer Bilim Verileri, MTA, Special Publication No. 3, 249, 2004 (in Turkish).
30
Duman, T. Y., Can, T., Emre, ¨O., Kecer, M., Dogan, A., Ates, S., and Durmaz, S.: Landslide inventory of northwestern Anatolia, Engineering Geology, 77, 1/2, 99–114, 2005.
HESSD
2, 155–208, 2005 Landslide susceptibility mapping of Cekmece T. Y. Duman et al. Title Page Abstract Introduction Conclusions References Tables Figures J I J I Back CloseFull Screen / Esc
Print Version Interactive Discussion
EGU
area (North of Yenice, NW Turkey) by fuzzy approach, Environ. Geol., 41, 720–730, 2002. Ercanoglu, M. and Gokceoglu, C.: Use of fuzzy relations to produce landslide susceptibility
map of a landslide prone area (West Black Sea Region, Turkey), Engineering Geology, 75, 229–250, 2004.
Ercanoglu, M., Gokceoglu, C., and Van Asch, Th. W. J.: Landslide susceptibility zoning north of
5
Yenice (NW Turkey) by multivariate statistical techniques, Natural Hazards, 32, 1–23, 2004. Fabbri, A. G., Chung, C. J. F., Cendrero, A., and Remondo, J.: Is Prediction of Future Landslides
Possible with a GIS?, Natural Hazards, 30, 487–499, 2003.
Fernandez, C. I., Del Castillo, T. F., El Hamdouni, R., and Montero, J. C.: Verification of landslide susceptibility mapping: A case study, Earth Surface Process and Landforms, 24, 537–544,
10
1999.
Gokceoglu, C. and Aksoy, H.: Landslide susceptibility mapping of the slopes in the residual soils of the Mengen region (Turkey) by deterministic stability analyses and image processing techniques, Eng. Geol., 44, 147–161, 1996.
Gomez, H. and Kavzoglu, T.: Assessment of shallow landslide susceptibility using
ar-15
tificial neural networks in Jabonosa River Basin, Venezuela, Engineering Geology, doi:10.1016/j.enggeo.2004.10.004, in press, 2004.
Gritzner, M. L., Marcus, W. A., Aspinall, R., and Custer, S. G.: Assessing landslide potential using GIS, soil wetness modeling and topographic attributes, Payette River, Idaho. Geomor-phology, 37, 149–165, 2001.
20
Gupta, R. P. and Joshi, B. C.: Landslide hazard zoning using the GIS approach – A case study from the Ramganga Catchment, Himalayas, Engineering Geology, 28, 119–131, 1990. Guzzetti, F., Carrara, A., Cardinali, M., and Reichenbach, P.: Landslide hazard evaluation: a
review of current techniques and their application in a multi-scale study, Central Italy, Geo-morphology, 31, 181–216, 1999.
25
Guzzetti, F., Cardinali, M., Reichenbach, P., and Carrara, A.: Comparing landslide maps: A case study in the Upper Tiber River Basin, Central Italy, Environmental Management, 25, 3, 247–263, 2000.
http://istanbul.meteor.gov.tr: Website of State Meteorological Organisation, 2004.
Ildir, B.: Turkiyede heyelanlarin dagilimi ve afetler yasasi ile ilgili uygulamalar, In: Proc. Of 2nd
30
National Landslide Symposium of Turkey, Sakarya University, 1–9, 1995 (in Turkish). Jade, S. and Sarkar, S.: Statistical models for slope instability classification, Engineering
HESSD
2, 155–208, 2005 Landslide susceptibility mapping of Cekmece T. Y. Duman et al. Title Page Abstract Introduction Conclusions References Tables Figures J I J I Back CloseFull Screen / Esc
Print Version Interactive Discussion
EGU
Jager, S. and Wieczorek, G. F.: Landslide susceptibility in the Tully Valley Area, Finger Lakes Region, U.S. Geological Survey, Open-File Report 94-615, 1994.
Jakob, M.: The impacts of logging on landslide activity at Clayoquot Soung, British Columbia, Catena 38, 279–300, 2000.
Juang, C. H., Lee, D. H., and Sheu, C.: Mapping slope failure potential using fuzzy sets, J.
5
Geotech. Eng. Div., ASCE 118, 475–493, 1992.
Koukis, G. and Ziourkas, C.: Slope instability phenomena in Greece: A statistical anlysis, Bulletin of International Association of Engineering Geologists, 43, 47–60, 1991.
Lee, S.: Application of Likelihood Ratio and Logistic Regression Models to Landslide Suscep-tibility Mapping Using GIS, Environmental Management, 34, 223–232, 2004.
10
Lee, S. and Min, K.: Statistical analysis of landslide susceptibility at Yongin, Korea Environ. Geol., 40, 1095–1113, 2001.
Lee, C. F., Ye, H., Yeung, M. R., Shan, X., and Chen, G.: AIGIS based methodology for natural terrain landslide susceptibility mapping in Hong Kong, Episodes, 24, 3, 150–159, 2001. Lee, S., Ryu, J. H., Min, K., and Won, J. S.: Landslide susceptibility analysis using GIS and
15
artificial neural network, Earth Surf., Processes Landf., 28, 1361–1376, 2003.
Lee, S., Ryu, J. H., Won, J. S., and Park, H. J.: Determination and application of the weights for landslide susceptibility mapping using an artificial neural network, Eng. Geol., 71, 289–302, 2004.
Luzi, L. and Pergalani, F.: Slope instability in static and dynamic conditions for urban planning:
20
the “Oltre Po Pavese” case history (Regione Lombardia-Italy), Natural Hazards, 20, 57–82, 1999.
Maharaj, R.: Landslide processes and landslide susceptibility analysis from an upland water-shed: A case study from St. Andrew, Jamaica,West Indies, Engineering Geology, 34, 53–79, 1993.
25
Nagarajan, R., Roy, A., Vinod Kumar, R., Mukherjee, A., and Khire, M. V.: Landslide hazard susceptibility mapping based on terrain and climatic factors for tropical monsoon regions, Bulletin of Engineering Geology and the Environment, 58, 275–287, 2000.
Negnevitsky, M.: Artificial Intelligence – A Guide to Intelligent Systems, Addison – Wesley Co., Great Britain, 394, 2002.
30
Pachauri, A. K. and Pant, M.: Landslide hazard mapping based on geological attributes, Engi-neering Geology, 32, 81–100, 1992.
HESSD
2, 155–208, 2005 Landslide susceptibility mapping of Cekmece T. Y. Duman et al. Title Page Abstract Introduction Conclusions References Tables Figures J I J I Back CloseFull Screen / Esc
Print Version Interactive Discussion
EGU
Himalayas, Environmental Geology, 36, 3–4, 325–334, 1998.
Parsons, T., Stein, R. S., Barka, A. A., Dieterich, J. H.: Heightened odds of large earthquakes near Istanbul; an interaction – based probability calculation, Sci. Mag., April 28, 661–665, 2000.
Pistocchi, A., Luzi, L., and Napolitano, P.: The use of predictive modeling techniques for optimal
5
exploitation of spatial databases: a case study in landslide hazard mapping with expert system – like methods, Environmental Geology, 41, 765–775, 2002.
Roth, R. A.: Factors affecting landslide susceptibility in SanMateo County, California, Bulletin of the Association of Engineering Geologists, XX, 4, 353–372, 1983.
Rowbotham, D. N. and Dudycha, D.: GIS modelling of slope stability in Phewa Tal watershed,
10
Nepal, Geomorphology, 26, 151–170, 1998.
Safak, U., Avsar, N., and Meric, E.: Bati Bakirkoy (Istanbul) Tersiyer cokellerinin ostrakod ve formanifer toplulugu, MTA Journal, 121, 17–31, 1999 (in Turkish).
Soeters, R. S. and Van Westen, C. J.: Slope instability recognition, analysis and zonation, In: Landslides: Investigation and Mitigation, edited by Turner A. K. and Schuster, R. L.,
15
Transportation Research Board, Special Report, National Academy Press, Washington, C, 247, 129–177, 1996.
Soysal, H., Sipahioglu, S., Kolcak, D., and Altinok, Y.: Tuurkiye ve Cevresinin Tarihsel Deprem Katalogu (MO 2100–MS 1900), TUBITAK project Tbag 341, Istanbul, 1981.
Suzen, M. L. and Doyuran, V.: A comparison of the GIS based landslide susceptibility
assess-20
ment methods: multivariate versus bivariate, Environmental Geology, 45, 665–679, 2004a. Suzen, M. L. and Doyuran, V.: Data driven bivariate landslide susceptibility assessment using
geographical information systems: a method and application to Asarsuyu catchment, Turkey, Eng. Geol., 71, 303–321, 2004b.
Todd, D. C.: Groundwater Hydrology, John Wiley and Sons, New York, 336, 1980.
25
Turrini, M. C. and Visintainer, P.: Proposal of a method to define areas of landslide hazard and application to an area of the Dolomites, Italy, Engineering Geology, 50, 255–265, 1998. Van Westen, C. J., Seijmonsbergen, A. C., and Mantovani, F.: Comparing landslide hazard
maps, Natural Hazards, 20, 137–158, 1999.
Varnes, D. J.: Slope movement types and processes, In: Landslides Analysis and Control,
30
edited by Schuster, R. L. and Krizek, R. J., Special Report, Transportation Research Board, National Academy of Sciences, New York, 176, 12–33, 1978.
HESSD
2, 155–208, 2005 Landslide susceptibility mapping of Cekmece T. Y. Duman et al. Title Page Abstract Introduction Conclusions References Tables Figures J I J I Back CloseFull Screen / Esc
Print Version Interactive Discussion
EGU
Geo. Journal, 51, 245–253, 2000.
WP/WLI (Working Party on World Landslide Inventory): A suggested method for describing the activity of a landslide, Bull. Int. Assoc. Eng. Geol., 47, 53–57, 1993.
Zezere, J. L.: Landslide susceptibility assessment considering landslide typology. A case study in the area north of Lisbon (Portugal), Natural Hazards and Earth System Sciences, 2, 73–
5
82, 2002,SRef-ID: 1684-9981/nhess/2002-2-73.
Zezere, J. L., Ferreira, A. B., and Rodrigues, M. L.: Landslides in the North of Lisbon Region (Portugal): Conditioning and triggering factors, Physical and Chemical Earth (A), 24, 10, 925–934, 1999.
HESSD
2, 155–208, 2005 Landslide susceptibility mapping of Cekmece T. Y. Duman et al. Title Page Abstract Introduction Conclusions References Tables Figures J I J I Back CloseFull Screen / Esc
Print Version Interactive Discussion
EGU
Table 1. The data employed in the analyses and the results obtained from the conditional
probability approach.
Landslide area in Parameter class area parameter class
Parameter Pix. Count. m2 Pix. Count. m2 P(A/Bi) P(Bi) P(A)
Slope (◦) 0–5 152235 95146875 13078 8173750 0.085907 0.543440 0.046685 5–10 96444 60277500 26665 16665625 0.276482 0.344281 0.095187 10–15 22221 13888125 9389 5868125 0.422528 0.079323 0.033516 15–20 5959 3724375 2851 1781875 0.478436 0.021272 0.010177 20–25 1980 1237500 1011 631875 0.510606 0.007068 0.003609 25–30 767 479375 402 251250 0.524120 0.002738 0.001435 30–50 520 325000 275 171875 0.528846 0.001856 0.000982 50–90 6 3750 3 1875 0.500000 0.000021 0.000011 Aspect (◦) 0–45 18323 11451875 4075 2546875 0.222398 0.065408 0.014547 45–90 38150 23843750 6521 4075625 0.170931 0.136186 0.023278 90–135 33985 21240625 5203 3251875 0.153097 0.121318 0.018573 135–180 29140 18212500 6671 4169375 0.228929 0.104022 0.023814 180–225 29119 18199375 7733 4833125 0.265565 0.103947 0.027605 225–270 41964 26227500 7706 4816250 0.183634 0.149801 0.027508 270–315 33657 21035625 6920 4325000 0.205604 0.120147 0.024703 315–360 17597 10998125 3693 2308125 0.209865 0.062817 0.013183 −1 38197 23873125 5152 3220000 0.134880 0.136354 0.018391
HESSD
2, 155–208, 2005 Landslide susceptibility mapping of Cekmece T. Y. Duman et al. Title Page Abstract Introduction Conclusions References Tables Figures J I J I Back CloseFull Screen / Esc
Print Version Interactive Discussion
EGU
Table 1. Continued.
Landslide area in Parameter class area parameter class
Parameter Pix. Count. m2 Pix. Count. m2 P(A/Bi) P(Bi) P(A)
Altitude (m) 0–25 28974 18108750 4862 3038750 0.167806 0.103430 0.017356 25–50 37867 23666875 9930 6206250 0.262234 0.135176 0.035448 50–75 37542 23463750 9526 5953750 0.253742 0.134015 0.034005 75–100 43156 26972500 8829 5518125 0.204583 0.154056 0.031517 100–125 43277 27048125 8164 5102500 0.188645 0.154488 0.029143 125–150 39680 24800000 7352 4595000 0.185282 0.141648 0.026245 150–175 32089 20055625 4467 2791875 0.139207 0.114550 0.015946 175–200 17547 10966875 544 340000 0.031002 0.062638 0.001942 Lithology Qa 15644 9777500 1127 704375 0.072040 0.055845 0.004023 Tek 1613 1008125 0 0 0.000000 0.005758 0.000000 Teoi 43337 27085625 1810 1131250 0.041766 0.154702 0.006461 Teoi2 478 298750 66 41250 0.138075 0.001706 0.000236 Teoiy 1035 646875 0 0 0.000000 0.003695 0.000000 Tmb 56253 35158125 4473 2795625 0.079516 0.200809 0.015967 Tme 71366 44603750 13617 8510625 0.190805 0.254758 0.048609 To 14336 8960000 5706 3566250 0.398019 0.051176 0.020369 Tod 20650 12906250 4728 2955000 0.228959 0.073715 0.016878 Toda 34254 21408750 17151 10719375 0.500701 0.122278 0.061225 Tos 21166 13228750 4996 3122500 0.236039 0.075557 0.017834
HESSD
2, 155–208, 2005 Landslide susceptibility mapping of Cekmece T. Y. Duman et al. Title Page Abstract Introduction Conclusions References Tables Figures J I J I Back CloseFull Screen / Esc
Print Version Interactive Discussion
EGU
Table 1. Continued.
Landslide area in Parameter class area parameter class
Parameter Pix. Count. m2 Pix. Count. m2 P(A/Bi) P(Bi) P(A)
Geomorphology AB 385 240625 0 0 0.000000 0.001374 0.000000 By 128 80000 69 43125 0.539063 0.000457 0.000246 Db 231 144375 76 47500 0.329004 0.000825 0.000271 Dko 1754 1096250 57 35625 0.032497 0.006261 0.000203 Dp 207 129375 0 0 0.000000 0.000739 0.000000 EKSY 1004 627500 0 0 0.000000 0.003584 0.000000 EL 1296 810000 6 3750 0.004630 0.004626 0.000021 HB 1387 866875 144 90000 0.103821 0.004951 0.000514 PH 3511 2194375 1071 669375 0.305041 0.012533 0.003823 UMAY 1356 847500 1 625 0.000737 0.004841 0.000004 UMDY 67225 42015625 1566 978750 0.023295 0.239976 0.005590 Vt 9845 6153125 420 262500 0.042661 0.035144 0.001499 Y 184517 115323125 50242 31401250 0.272289 0.658679 0.179351 YK 91 56875 21 13125 0.230769 0.000325 0.000075 Dist. Fr. Faults (m) 0–200 22328 13955000 1009 630625 0.045190 0.079705 0.003602 200–400 19180 11987500 1150 718750 0.059958 0.068468 0.004105 400–600 14661 9163125 1251 781875 0.085328 0.052336 0.004466 600–800 13224 8265000 1567 979375 0.118497 0.047206 0.005594 800–1000 11443 7151875 1604 1002500 0.140173 0.040849 0.005726
HESSD
2, 155–208, 2005 Landslide susceptibility mapping of Cekmece T. Y. Duman et al. Title Page Abstract Introduction Conclusions References Tables Figures J I J I Back CloseFull Screen / Esc
Print Version Interactive Discussion
EGU
Table 1. Continued.
Landslide area in Parameter class area parameter class
Parameter Pix. Count. m2 Pix. Count. m2 P(A/Bi) P(Bi) P(A)
Dist. Fr. Drain. (m) 0–25 6855 4284375 1066 666250 0.155507 0.024471 0.003805 25–50 6810 4256250 1571 981875 0.230690 0.024310 0.005608 50–75 6714 4196250 1763 1101875 0.262586 0.023967 0.006293 75–100 6590 4118750 1792 1120000 0.271927 0.023525 0.006397 100–125 6578 4111250 1691 1056875 0.257069 0.023482 0.006036 Dist. Fr. Roads (m) 0–10 11531 7206875 1308 817500 0.113433 0.041163 0.004669 10–20 11197 6998125 1217 760625 0.108690 0.039970 0.004344 20–30 10141 6338125 1219 761875 0.120205 0.036201 0.004352 30–40 9972 6232500 1192 745000 0.119535 0.035598 0.004255 40–50 8976 5610000 1171 731875 0.130459 0.032042 0.004180 Relative permeability
Low (or impermeable) 113571 70981875 29729 18580625 0.261766 0.405420 0.106125 Moderate 20650 12906250 4728 2955000 0.228959 0.073715 0.016878 High 145911 91194375 19217 12010625 0.131704 0.520865 0.068600
HESSD
2, 155–208, 2005 Landslide susceptibility mapping of Cekmece T. Y. Duman et al. Title Page Abstract Introduction Conclusions References Tables Figures J I J I Back CloseFull Screen / Esc
Print Version Interactive Discussion
EGU
Figure 1
Fig. 1. Location map of the study area.
HESSD
2, 155–208, 2005 Landslide susceptibility mapping of Cekmece T. Y. Duman et al. Title Page Abstract Introduction Conclusions References Tables Figures J I J I Back CloseFull Screen / Esc
Print Version Interactive Discussion EGU Figure 2 active lan dslide are a active lan dslide ar ea
Fig. 2. Some typical views from the study area (many buildings were constructed in the active
landslides).
HESSD
2, 155–208, 2005 Landslide susceptibility mapping of Cekmece T. Y. Duman et al. Title Page Abstract Introduction Conclusions References Tables Figures J I J I Back CloseFull Screen / Esc
Print Version Interactive Discussion
EGU
Figure 3
Fig. 3. Geological map of the study area (Duman et al., 2004a).
HESSD
2, 155–208, 2005 Landslide susceptibility mapping of Cekmece T. Y. Duman et al. Title Page Abstract Introduction Conclusions References Tables Figures J I J I Back CloseFull Screen / Esc
Print Version Interactive Discussion
EGU
Figure 4
Fig. 4. A close view from the Danisment formation.
HESSD
2, 155–208, 2005 Landslide susceptibility mapping of Cekmece T. Y. Duman et al. Title Page Abstract Introduction Conclusions References Tables Figures J I J I Back CloseFull Screen / Esc
Print Version Interactive Discussion EGU Figure 5 0 5000 10000 15000 20000 25000 30000 35000 40000 45000 50000 0-25 25-50 50-75 75-100 100-125 125-150 150-175 175-200 Altitude interva l (m) P ix e lc ount (a) (b)
Fig. 5. (a) Altitude map of the study area and (b) Histogram showing the distribution of altitude
values of the study area.
HESSD
2, 155–208, 2005 Landslide susceptibility mapping of Cekmece T. Y. Duman et al. Title Page Abstract Introduction Conclusions References Tables Figures J I J I Back CloseFull Screen / Esc
Print Version Interactive Discussion EGU Figure 6 0 5000 10000 15000 20000 25000 30000 35000 40000 45000
Aspect interva l (degree)
P ix e lc ou nt (a) (b)
Fig. 6. (a) Aspect map of the study area and (b) Histogram showing the distribution of the
aspect values of the study area.
HESSD
2, 155–208, 2005 Landslide susceptibility mapping of Cekmece T. Y. Duman et al. Title Page Abstract Introduction Conclusions References Tables Figures J I J I Back CloseFull Screen / Esc
Print Version Interactive Discussion EGU Figure 7 0 20000 40000 60000 80000 100000 120000 140000 160000 0-5 5-10 10-15 15-20 20-25 25-30 30-50 50-90
Slope interval (degree)
P ix e lc ount (a) (b)
Fig. 7. (a) Slope map of the study area and (b) Histogram showing the distribution of the slope
values of the study area.
HESSD
2, 155–208, 2005 Landslide susceptibility mapping of Cekmece T. Y. Duman et al. Title Page Abstract Introduction Conclusions References Tables Figures J I J I Back CloseFull Screen / Esc
Print Version Interactive Discussion
EGU
Figure 8
Landslide morphology
Fig. 8. Geomorpholoy map of the study area (Duman et al., 2004a).
HESSD
2, 155–208, 2005 Landslide susceptibility mapping of Cekmece T. Y. Duman et al. Title Page Abstract Introduction Conclusions References Tables Figures J I J I Back CloseFull Screen / Esc
Print Version Interactive Discussion
EGU
Figure 9
Fig. 9. Relative permeability map of the lithologies (Duman et al., 2004a).
HESSD
2, 155–208, 2005 Landslide susceptibility mapping of Cekmece T. Y. Duman et al. Title Page Abstract Introduction Conclusions References Tables Figures J I J I Back CloseFull Screen / Esc
Print Version Interactive Discussion EGU
Figure 10
0 5 10 15 20 25 Te m p e ra tur e ( O C) 0 20 40 60 80 100 120 Febr uaryMarch April May July Augu st Sept embe r Octo ber Nove mbe r Dece mbe r Month R a in fa ll (m m ) Rainfall TemperatureFig. 10. Average annual rainfall and temperature graph of the data from Florya Meteorology
Station.
HESSD
2, 155–208, 2005 Landslide susceptibility mapping of Cekmece T. Y. Duman et al. Title Page Abstract Introduction Conclusions References Tables Figures J I J I Back CloseFull Screen / Esc
Print Version Interactive Discussion EGU
Figure 11
0 5 10 15 20 25 30 35Qa Teoi Teoi2 Tmb Tme Toc Tos Toda Toda
Lithology Fr eq ue nc y (% )
Fig. 11. Histogram illustrating the distribution of the landslides with respect to the lithologies at
the study area.
HESSD
2, 155–208, 2005 Landslide susceptibility mapping of Cekmece T. Y. Duman et al. Title Page Abstract Introduction Conclusions References Tables Figures J I J I Back CloseFull Screen / Esc
Print Version Interactive Discussion
EGU
Figure 12
Fig. 12. A large landslide identified in the area.
HESSD
2, 155–208, 2005 Landslide susceptibility mapping of Cekmece T. Y. Duman et al. Title Page Abstract Introduction Conclusions References Tables Figures J I J I Back CloseFull Screen / Esc
Print Version Interactive Discussion EGU Figure 13 (c) (a) scarp displa ced m ateria l (b) main scarp secondary failure in displacement material
Fig. 13. Some typical views from the landslides in the area.
HESSD
2, 155–208, 2005 Landslide susceptibility mapping of Cekmece T. Y. Duman et al. Title Page Abstract Introduction Conclusions References Tables Figures J I J I Back CloseFull Screen / Esc
Print Version Interactive Discussion
EGU
Figure 14
Sl ope interval (degree) on slide mass
55.0 - 6 0.0 50.0 - 5 5.0 45.0 - 5 0.0 40.0 - 4 5.0 35.0 - 4 0.0 30.0 - 3 5.0 25.0 - 3 0.0 20.0 - 2 5.0 15.0 - 2 0.0 10.0 - 1 5.0 5.0 - 1 0.0 0.0 - 5.0 F re qu enc y 30000 20000 10000 0 Std. Dev = 5.31 Mean = 8.0 N = 53674.00
Fig. 14. Histogram illustrating the distribution of the landslides with respect to the slope angle
at the study area.
HESSD
2, 155–208, 2005 Landslide susceptibility mapping of Cekmece T. Y. Duman et al. Title Page Abstract Introduction Conclusions References Tables Figures J I J I Back CloseFull Screen / Esc
Print Version Interactive Discussion
EGU
Figure 15
Aspect interval (degree) on sl ide mass
31 5 -360 27 0 -315 22 5 -270 18 0 -225 13 5 -180 90 -135 45 - 90 0 -45 F re q uen cy 10000 8000 6000 4000 2000 0 Std. Dev = 104.37 Mean = 166 N = 53674.00
Fig. 15. Histogram illustrating the distribution of the landslides with respect to the aspect at the
study area.
HESSD
2, 155–208, 2005 Landslide susceptibility mapping of Cekmece T. Y. Duman et al. Title Page Abstract Introduction Conclusions References Tables Figures J I J I Back CloseFull Screen / Esc
Print Version Interactive Discussion
EGU
Figure 16
Al titude interval on slide m ass (m )
17 5.0 - 200 .0 15 0.0 -17 5 .0 12 5.0 -150 .0 10 0.0 -125 .0 75.0 - 100 .0 50.0 - 7 5.0 25.0 - 5 0.0 0.0 - 25.0 F re q uen cy 12000 10000 8000 6000 4000 2000 0 Std. Dev = 45.16 Mean = 85.1 N = 53674.00
Fig. 16. Histogram illustrating the distribution of the landslides with respect to the altitude
values at the study area.
HESSD
2, 155–208, 2005 Landslide susceptibility mapping of Cekmece T. Y. Duman et al. Title Page Abstract Introduction Conclusions References Tables Figures J I J I Back CloseFull Screen / Esc
Print Version Interactive Discussion
EGU
Figure 17
Fig. 17. The main faults and the buffer zones indicating to closeness to the faults.