HAL Id: hal-00298484
https://hal.archives-ouvertes.fr/hal-00298484
Submitted on 18 Sep 2007HAL is a multi-disciplinary open access
archive for the deposit and dissemination of sci-entific research documents, whether they are pub-lished or not. The documents may come from teaching and research institutions in France or abroad, or from public or private research centers.
L’archive ouverte pluridisciplinaire HAL, est destinée au dépôt et à la diffusion de documents scientifiques de niveau recherche, publiés ou non, émanant des établissements d’enseignement et de recherche français ou étrangers, des laboratoires publics ou privés.
Ice-shelf ? ocean interactions at Fimbul Ice Shelf,
Antarctica from oxygen isotope ratio measurements
M. R. Price, K. J. Heywood, K. W. Nicholls
To cite this version:
M. R. Price, K. J. Heywood, K. W. Nicholls. Ice-shelf ? ocean interactions at Fimbul Ice Shelf, Antarctica from oxygen isotope ratio measurements. Ocean Science Discussions, European Geosciences Union, 2007, 4 (5), pp.709-732. �hal-00298484�
OSD
4, 709–732, 2007
Ice-shelf – ocean interactions at Fimbul Ice Shelf
M. R. Price Title Page Abstract Introduction Conclusions References Tables Figures ◭ ◮ ◭ ◮ Back Close
Full Screen / Esc
Printer-friendly Version Interactive Discussion
EGU Ocean Sci. Discuss., 4, 709–732, 2007
www.ocean-sci-discuss.net/4/709/2007/ © Author(s) 2007. This work is licensed under a Creative Commons License.
Ocean Science Discussions
Papers published in Ocean Science Discussions are under open-access review for the journal Ocean Science
Ice-shelf – ocean interactions at Fimbul
Ice Shelf, Antarctica from oxygen isotope
ratio measurements
M. R. Price1, K. J. Heywood1, and K. W. Nicholls2
1
School of Environmental Sciences, University of East Anglia, Norwich, NR4 7TJ, UK
2
British Antarctic Survey, High Cross, Madingley Road, Cambridge, CB3 0ET, UK
Received: 3 September 2007 – Accepted: 11 September 2007 – Published: 18 September 2007
OSD
4, 709–732, 2007
Ice-shelf – ocean interactions at Fimbul Ice Shelf
M. R. Price Title Page Abstract Introduction Conclusions References Tables Figures ◭ ◮ ◭ ◮ Back Close
Full Screen / Esc
Printer-friendly Version Interactive Discussion
EGU Abstract
Melt water from the floating ice shelves at the margins of the southeastern Weddell Sea makes a significant contribution to the fresh water budget of the region. In Febru-ary 2005 a multi-institution team conducted an oceanographic campaign at Fimbul Ice Shelf on the Greenwich Meridian as part of the Autosub Under Ice programme. This
in-5
cluded a mission of the autonomous submarine Autosub 25 km into the cavity beneath Fimbul Ice Shelf, and a number of ship-based hydrographic sections on the continen-tal shelf and adjacent to the ice shelf front. The measurements reveal two significant sources of glacial melt water at Fimbul Ice Shelf: the main cavity under the ice shelf and an ice tongue that protrudes from the main ice front and out over the continental slope
10
into deep water. Glacial melt water is concentrated in a 200 m thick Ice Shelf Water (ISW) layer below the base of the ice shelf at 150–200 m, with a maximum glacial melt concentration of up to 1.16%. Some glacial melt is found throughout the water column, and much of this is from sources other than Fimbul Ice Shelf. However, at least 0.2% of the water in the ISW layer cannot be accounted for by other processes and must have
15
been contributed by the ice shelf. Just downstream of Fimbul Ice Shelf we observe locally created ISW mixing out across the continental slope. The ISW formed here is much less dense than that formed in the southwest Weddell Sea, and will ultimately contribute a freshening (and reduction inδ18O) to the upper 100–150 m of the water column in the southeast Weddell Sea.
20
1 Introduction
Floating ice shelves at the periphery of Antarctica play an important role in the water mass transformations that take place there. The source water is Warm Deep Water (WDW), derived from Circumpolar Deep Water, an old, salty and relatively warm wa-ter mass. Around Antarctica a portion of this is ultimately transformed into Antarctic
25
trans-OSD
4, 709–732, 2007
Ice-shelf – ocean interactions at Fimbul Ice Shelf
M. R. Price Title Page Abstract Introduction Conclusions References Tables Figures ◭ ◮ ◭ ◮ Back Close
Full Screen / Esc
Printer-friendly Version Interactive Discussion
EGU formation are many, complex and not yet fully understood, involving interaction with the
atmosphere, formation and melting of sea ice, and interaction with floating glacial ice shelves. Of the ice shelves in the Weddell Sea, most attention has been directed at the Filchner-Ronne Ice Shelf in the southwest Weddell Sea (Foldvik et al., 2004). Here the wide continental shelf provides a source of cold and saline High Salinity Shelf Water
5
for the extensive under-ice cavity, where it is transformed into Ice Shelf Water (ISW). The ISW forms an important component of the subsequent water mass mixture that is dense enough to descend the continental slope into the deep layers of the Weddell Sea.
The ice shelves further east, the Brunt, Riiser-Larsen and Fimbul, for example, have
10
much narrower continental shelves, which produce fresher and less dense shelf waters, and are not believed to be locations for formation of Antarctic Bottom Water. The meltwater from the ice shelves mixes into the near-surface layers of the southeast Weddell Sea. Indeed, Fahrbach et al. (1994) argued that the input of glacial melt water from these ice shelves plays an important role in suppressing bottom water formation
15
in the southeast Weddell Sea. In a numerical model of the Weddell Sea (Beckmann et al., 1999), the eastern Weddell ice shelves provide a fresh water source that caps deep convection in the open Weddell Sea. Toggweiler and Samuels (1995) argue that global ocean models tend to be fundamentally deficient in the Antarctic because they neglect the contribution of ice shelves to the freshwater budget of the high latitude oceans.
20
Fimbul Ice Shelf (Fig. 1) is fed by the Jutulstraumen ice stream that flows northward along the Greenwich meridian, draining the substantial Jutul basin, Dronning Maud Land. Data from the first and only full seismic survey of the ice shelf and sea bed topography (Nøst, 2004) have been used to produce Fig. 1. The ice shelf thickness is typically 300–400 m in Jutulstraumen (over 550 m near the grounding line), and 200–
25
350 m over the remaining shelf area. Offset slightly west of Jutulstraumen is a cavity with up to 900 m water column thickness, intersecting the continental shelf break to form a sill of sea bed depth less than 600 m, and water column thickness less than 400 m. Ice draft at the ice front is typically 150–200 m. East of Jutulstraumen the
OSD
4, 709–732, 2007
Ice-shelf – ocean interactions at Fimbul Ice Shelf
M. R. Price Title Page Abstract Introduction Conclusions References Tables Figures ◭ ◮ ◭ ◮ Back Close
Full Screen / Esc
Printer-friendly Version Interactive Discussion
EGU main cavity is connected to three smaller basins, each with a (shallower) sill out onto
the continental shelf. Finally, Jutulstraumen feeds a floating ice tongue that protrudes around 40 km further north than the rest of the ice shelf, out over the continental slope to a water depth of more than 2000 m.
Smedsrud et al. (2006) applied an isopycnic coordinate model to the cavity beneath
5
Fimbul Ice Shelf, and the continental shelf and slope. They find a flow of relatively warm water (some warmer than 0◦C, though the average modelled cavity temperature is −1◦C) across the sill into the main cavity, driving a typical sub-ice-shelf thermohaline
plume at the base of the ice shelf (Grosfeld et al., 1997). The ingress of such warm water gives a modelled maximum basal melt rate of greater than 10 m per year, with
10
an average of 1.9 m per year. Such high melt rates would provide a freshwater flux comparable to that from the much larger Filchner-Ronne and Ross ice shelves. Other estimates of basal melting of Fimbul Ice Shelf from numerical models (Beckmann and Goose, 2004) and remote sensing (Rignot and Jacobs, 2002) bracket this estimate, but there is general agreement that the narrow continental shelf and close proximity of
15
relatively warm waters will produce high basal melt rates and a significant freshwater flux.
Although waters warmer than 0◦C are found as shallow as 200 m less than 100 km offshore at the Greenwich meridian, isotherms deepen markedly as they approach the coast, reflecting the baroclinic westward flow associated with the Antarctic Slope
20
Front/Coastal Current system (Heywood et al., 1998). By the time it intersects the bathymetry, the 0◦C isotherm in this area is typically found at a depth of around 700 m, below the sill at the entrance to the Fimbul cavity. Consequently, Nøst (2004) argues that water warmer than −1◦C will not have direct access to the cavity.
Here we report on measurements made in February as part of the UK Autosub Under
25
Ice programme, which included sending the autonomous submarine Autosub 25 km into the main Fimbul cavity. Nicholls et al. (2006) report on the main results from this mission, including finding that the ISW in the cavity has not been formed from waters found at the main sill or on the adjacent continental slope. Instead, the most likely
OSD
4, 709–732, 2007
Ice-shelf – ocean interactions at Fimbul Ice Shelf
M. R. Price Title Page Abstract Introduction Conclusions References Tables Figures ◭ ◮ ◭ ◮ Back Close
Full Screen / Esc
Printer-friendly Version Interactive Discussion
EGU source water candidate is found at the sill-entrance to one of the smaller cavities east of
Jutulstraumen, in waters that have been modified by shelf processes. In this paper our main focus is on oxygen isotope ratio measurements made on the continental shelf in front of Fimbul Ice Shelf. The relative abundance of water containing the two common isotopes of oxygen, H162 O and H182 O, is used as a tracer for meteoric water input, and
5
is especially sensitive to the input of glacial melt water. Freezing and melting of sea ice have only a small effect on the ratio, whereas evaporation and precipitation have a large effect. The consequence is that high latitude meteoric water, and especially glacial ice, is strongly depleted in18O, which makes oxygen isotopes an excellent tracer of water of glacial origin.
10
2 Data and methods
In February 2005, 48 hydrographic stations were occupied from R.R.S. James Clark Ross on and adjacent to the continental shelf in front of Fimbul Ice Shelf as part of the UK Autosub Under Ice programme (Fig. 1). The stations form six sections in total, occupied over 10 days from 12 to 21 February 2005. Section A runs
15
perpendicular to the ice front out to the 2000 m depth contour at the western end of the ice shelf, section C similarly crosses the shelf just west of the floating ice tongue, with section E just east of the tongue. Heavy sea ice prevented us from going shoreward of the 470 m contour in section E. Section B runs along the ice front from east to west, from the end of a small creek on the west side of the ice tongue to the ice-front end
20
of section A. Section D runs along a roughly 10-km long creek into the west side of the ice tongue. Finally, section F runs from the eastern end of the ice shelf west along the ice front down into the deepest of the smaller eastern sills. Heavy sea ice cover prevented further work east of the ice tongue. The southern-most three stations of section E and the northern-most four stations of section A were deployed from the
25
stern of the ship in heavy sea-ice. The ship’s propellers were used to maintain ice free water at the stern during deployment, and will have vigorously stirred the near surface
OSD
4, 709–732, 2007
Ice-shelf – ocean interactions at Fimbul Ice Shelf
M. R. Price Title Page Abstract Introduction Conclusions References Tables Figures ◭ ◮ ◭ ◮ Back Close
Full Screen / Esc
Printer-friendly Version Interactive Discussion
EGU water column. Thus no shallow18O samples were collected at these stations, and the
near surface CTD data should be treated with caution. Temperature and salinity data from Autosub mission 382 are also used (Fig. 1). The mission ran from the intersection of sections B and C to the southeast, 25 km into the cavity towards the northern end of the deepest part of the cavity. The southeastern end of the mission reaches a water
5
column thickness of around 650 m at a sea bed depth of 860 m.
Hydrographic sections were occupied using a Seabird 911 plus Conductivity-Temperature-Depth (CTD) system (with two pairs of conductivity and temperature sen-sors) and a 24-bottle water sampling carousel. Laboratory CTD calibration was per-formed both before and after the cruise. CTD salinity was calibrated against water
10
samples collected at each station and analysed using a Guildline 8400b salinometer. An SBE 35 deep ocean standards thermometer was used as a cross-check on the tem-perature sensors and to identify a sensor which became slightly unstable for a handful of stations. We estimate temperature and salinity overall to be accurate to ±1 mK and ±0.001 respectively. The Autosub was equipped with a Seabird 9 plus CTD system,
15
with sensors calibrated before the cruise. Drift rates given by the manufacturer sug-gest uncertainties for the Autosub CTD similar to the ship-borne instrument. However, we were unable to perform an in situ calibration, or a post-cruise calibration since the Autosub was lost on a subsequent mission, and must allow that the uncertainties could be a little higher.
20
Water samples for oxygen isotope ratio analysis were drawn from 10 litre Niskin bot-tles into 50 ml glass botbot-tles, closed using aluminium caps with rubber insert and further sealed with Parafilm. The water samples were stored in a 4◦C cold room both at sea and on our return until they were sent for analysis. The samples were analysed at the National Isotope Geosciences Laboratory (UK) by equilibration with CO2(Epstein and 25
Mayeda, 1953), using a VG Isoprep 18 and Sira 10 mass spectrometer. H182 O to H162 O ratios are expressed in delta notation (δ18O) relative to Vienna Standard Mean Ocean
OSD
4, 709–732, 2007
Ice-shelf – ocean interactions at Fimbul Ice Shelf
M. R. Price Title Page Abstract Introduction Conclusions References Tables Figures ◭ ◮ ◭ ◮ Back Close
Full Screen / Esc
Printer-friendly Version Interactive Discussion
EGU Water (VSMOW) where:
δ18O =" ( 18 O/16O)sample (18O/16O) VSMOW − 1 # ×1000.
Samples were analysed in triplicate, with a mean per sample standard deviation of ±0.025‰. Long term absolute accuracy at the laboratory is ±0.04‰. The latter is the best estimate of uncertainty for comparisons with other data sets, while for
compar-5
isons within this data set the uncertainty lies somewhere between the two.
Salinity andδ18O are used in a three-end-member mass balance in which the shelf waters are assumed to be formed from a linear mixture of sea ice melt water, glacial melt water, and Warm Deep Water (WDW). The technique calculates the fraction of the three source water masses required to produce the properties of each sampled water
10
parcel. The choice of end member properties, and the uncertainties in the resulting fractions will be discussed along with the results in Sect. 4.
3 Hydrographic properties
Temperature and salinity sections (Fig. 2) reveal a three-layer structure over the conti-nental shelf on the west side of the ice tongue (sections A, B, C and D). A near surface
15
layer, down to around the ice draft at 150–200 m (the depth of the ice near the ice front), is typically rather fresh (salinity 33.05 to 34.2) and somewhat warmer than the surface freezing point (−1.9◦C to −0.5◦C). The range of properties in this layer are clearly seen in Fig. 3, with a large scatter in potential temperature below salinity 34.2 reflecting the range of processes at work. In addition to mixing, temperature is altered near the
sur-20
face by radiative, sensible and latent heat fluxes, including melting of ice. Note that the warmest near surface waters (warmer than −0.5◦C) are not found over the continental
shelf. Salinity is similarly affected by mixing, sea ice melting (in summer) or freezing, melting of the ice shelf both at the wall and underside, melting of icebergs, direct local
OSD
4, 709–732, 2007
Ice-shelf – ocean interactions at Fimbul Ice Shelf
M. R. Price Title Page Abstract Introduction Conclusions References Tables Figures ◭ ◮ ◭ ◮ Back Close
Full Screen / Esc
Printer-friendly Version Interactive Discussion
EGU precipitation and melting of winter snow accumulated on top of sea ice. The freshest
and coldest water at the surface is found in section F, with a minimum of −1.75◦C. This
section is on the continental shelf and was surrounded by sea ice. Surface tempera-ture in the other sections lies in the range −1.5◦C to −0.7◦C. Lower temperatures than these in the upper layer are due to mixing with the colder layer below, the remnant of
5
the cold winter mixed layer, named Winter Water.
A 200 m thick layer from the ice shelf base down to around 400 m has a temperature below the −1.9◦C surface freezing point, with a minimum temperature of −2.03◦C near
250 m depth. Salinity in this layer lies in the range 34.2 to 34.3, with salinity at the temperature minimum in the range 34.22 to 34.25. Since these temperatures are
be-10
low the surface freezing point, these waters are by definition ISW that has been cooled (and freshened) by melting glacial ice at the ice shelf base. The ISW formed beneath Filchner-Ronne Ice Shelf, which contributes to deep water formation, has a salinity typ-ically in the range 34.5 to 34.65 (Gammelsrød et al., 1994), reflecting the high salinity of its source waters. The minimum temperature of the Filchner-Ronne ISW outflow is
15
also much lower, as low as −2.3◦C. By comparison, Fimbul ISW is only around 0.15◦C colder than the surface freezing point, and has much lower salinities. Away from the coastal region, water in the density range of the Fimbul ISW (σ0=27.50 to 27.62) would
mix into the upper 100–150 m of the water column (Heywood et al., 1998). Aside from the surface waters, Fimbul ISW may be expected to contribute to two Weddell Sea
wa-20
ter masses: Winter Water (WW), a cold water mass formed by winter convection and identified in summer by a temperature minimum below the surface layer; and Eastern Shelf Water (ESW), the less saline variety of the Weddell Sea shelf waters found east of Filchner Ice Shelf. Fimbul ISW will be a cooling and freshening influence on both ESW and WW.
25
Below 400 m on the Fimbul continental shelf, potential temperature increases again above the surface freezing point. The eastern end of section B runs down the west-ern slope into the sill at the entrance to the main cavity. The eastwest-ern most station (station 15) was in 560 m of water, and therefore close to the maximum depth of the
OSD
4, 709–732, 2007
Ice-shelf – ocean interactions at Fimbul Ice Shelf
M. R. Price Title Page Abstract Introduction Conclusions References Tables Figures ◭ ◮ ◭ ◮ Back Close
Full Screen / Esc
Printer-friendly Version Interactive Discussion
EGU sill. The warmest water sampled at the bottom of station 15 was −1.86◦C. Section D
similarly runs down the western slope of the sill, but closer to the shelf break, and has a maximum bottom temperature of −1.73◦C in 499 m of water. Turning to the temperature-salinity data from Autosub mission 382 (Fig. 3; see Nicholls et al. (2006) for a detailed description), in the cavity Autosub detected water colder than −1.9◦C at
5
all water depths less than the sill depth, reaching a maximum temperature of −1.84◦C at 706 m depth. It is conceivable that warmer water than sampled at any of these lo-cations might lie on the eastern slope of the sill, which was not sampled either from the ship or Autosub. However, the width of the sill is only 10–20 km, and it seems un-likely that much warmer water could enter the cavity so close to the sampled locations
10
without betraying its presence by some warm intrusions or mixing. Given the general westward flow in this location associated with the Antarctic Slope Front and coastal current, section E can be considered to reflect conditions upstream of the sill. The deepest water at the shallowest station at the southern end of that section (in 480 m of water) is −1.46◦C, and at the sill depth 100 m deeper the water will be still warmer.
15
The next deeper station in section E is in 924 m of water, and has water as warm as −0.5◦C at 580 m. The southward-deepening isotherms mean that the water at the sea bed at this depth will be colder, so this represents an unrealistically high upper limit on the temperature of water that had access to the sill during our field campaign.
Over the continental slope, below the depth of the ice shelf, the water becomes
20
both warmer and saltier down to the temperature maximum core of Warm Deep Water (WDW). Since isotherms and isohalines shoal towards the north, warmer and saltier water is also found at a given depth horizon with increasing distance from the shelf break. Less than 20 km from the shelf break, all on-shelf isolines have shoaled to 250 m or shallower, giving an indication of the depth horizon into which these waters
25
will ultimately mix. Typical temperature maximum properties at the northern end of sections A, C and E are 0.4−0.5◦C, with maximum salinity 34.67−34.68 (Fig. 3). These are very similar to the near-shelf break temperature maximum observed by Heywood et al. (1998) at 17◦W (their maximum temperature is perhaps 0.1◦C higher), though
OSD
4, 709–732, 2007
Ice-shelf – ocean interactions at Fimbul Ice Shelf
M. R. Price Title Page Abstract Introduction Conclusions References Tables Figures ◭ ◮ ◭ ◮ Back Close
Full Screen / Esc
Printer-friendly Version Interactive Discussion
EGU their section extends further offshore where warmer and saltier waters are found. The
warmest water sampled was 0.66◦C near 800 m depth at the northern end of section C,
with a salinity of 34.655, which is likely to be an intrusion from further north (Fig. 3). Below the temperature maximum the water becomes both cooler and fresher, with a minimum temperature of −0.182◦C and a salinity of 34.665.
5
4 Oxygen isotope ratios
A similar layered water mass structure is seen inδ18O as in temperature and salinity, although with more horizontal variability over the shelf, particularly around the depth of the ice shelf base (Figs. 2c, 3b). The freshest layer above the ice shelf draft has
δ18O in the range −0.45 to −0.35‰ typical of near surface southern Weddell Sea
10
waters that have received meteoric water input from the range of processes discussed earlier (Weppernig et al., 1996), in combination with freshwater exchanges from sea-ice melting and freezing that are close to isotopically neutral. Both salinity and temperature are highly variable, temporally and spatially; whileδ18O is the only surface property that is well-constrained, presumably because it is set at larger temporal and spatial scales
15
(compare Figs. 3a,b and c). The figures must be interpreted with care, because the measurement error inδ18O is very much greater as a proportion of the observed range than in either temperature or salinity, which tends to exaggerate the measured scatter inδ18O.
The highest values ofδ18O are just above −0.1 ‰ in the WDW. This is typical, with
20
WDW in the central Weddell Gyre having δ18O slightly closer to zero (Weiss et al., 1979). Below the WDW core,δ18O decreases again to below −0.2‰ in the WSDW, reflecting the glacial melt water input (at other locations) into this water type. Some of this isotopically light signature may come from direct precipitation into surface waters in the Antarctic zone during deep water formation. However in areas close to the
Antarc-25
tic continental shelf, the primary source of isotopically light freshwater is expected to be the glacial melt water (Jacobs et al., 1985). The WSDW properties are typical of
OSD
4, 709–732, 2007
Ice-shelf – ocean interactions at Fimbul Ice Shelf
M. R. Price Title Page Abstract Introduction Conclusions References Tables Figures ◭ ◮ ◭ ◮ Back Close
Full Screen / Esc
Printer-friendly Version Interactive Discussion
EGU those found below WDW in the Weddell Sea. The source of the WSDW may be the
southwest or western Weddell Sea, and it may have circulated to the Fimbul region with the Weddell Gyre. The water mass properties are also consistent with the bottom-intensified westward flow hugging the bottom of the Antarctic continental slope in the Weddell Basin. This WDSW may form near the Amery Ice Shelf or enter the
Wed-5
dell Basin from the Australian-Antarctic Basin through the Princess Elizabeth Trough (Meredith et al., 1999).
The ISW layer has δ18O below −0.45‰, typically below −0.5‰ and with a mini-mum of −0.59‰ sampled at 205 m at the western end of section D. These values show a marked influence of meteoric water, which can only be sub-ice shelf melt at
10
these depths and temperatures. For comparison,δ18O as low as −0.8‰ has been re-ported close to the front of Filchner Ice Shelf (Schlosser et al., 1990), with values below −0.7‰ routinely found in the Filchner Trough. δ18O depletion is linearly related to both the fraction of glacial melt water added to the source water, and theδ18O of the glacial ice. The latter depends on the latitude, altitude and climate under which the water was
15
precipitated. Glaciologically, Fimbul Ice Shelf consists of a relatively thin ice sheet fed by snow falling seaward of coastal mountain ranges, incised by a much thicker, rapidly moving core of ice that is an extension of the Jutulstraumen ice stream. The catchment of the Jutulstraumen ice stream is the Jutul Basin, which lies poleward of the coastal mountain ranges, and is relatively high and cold with a strongly negative surface snow
20
δ18O. Stenberg et al. (1998) give the variation of δ18O in surface snow with elevation for this area, based on shallow ice cores. By combining this with the accumulation rate field (Vaughan et al., 1999) and the surface elevation for the Jutulstraumen catchment we find a mean, present-dayδ18O for Jutulstraumen of −38.7±2‰. However, the Ju-tulstraumen ice presently melting from the base of Fimbul Ice Shelf is likely to be rather
25
old, possibly having been precipitated during the last glacial maximum. Based on the results of the Dronning Maud Land ice core, this would reduce the estimate by up to 8‰ (EPICA Community Members, 2006). An additional problem with the estimate is that it is not clear how much of the melting at the base of Fimbul Ice Shelf is of the thick,
OSD
4, 709–732, 2007
Ice-shelf – ocean interactions at Fimbul Ice Shelf
M. R. Price Title Page Abstract Introduction Conclusions References Tables Figures ◭ ◮ ◭ ◮ Back Close
Full Screen / Esc
Printer-friendly Version Interactive Discussion
EGU Jutulstraumen-sourced ice, and how much is from the rather thinner ice to the east and
west. The area of the non-Jutulstraumen-sourced ice shelf is larger, but as that part of the ice shelf is also thinner, it is likely to have lower melt rates. It is clear that the ice in the thinner ice shelf will have a much higherδ18O, as the snow comprising it is likely to have been fallen more recently, and at lower (and therefore warmer) elevation. In the
5
face of the uncertainties, we assume aδ18O for the glacial meltwater of −40±5‰. We use this δ18O value at zero salinity as one of the source water masses in a three-end-member mass balance. The other source waters are sea ice and WDW. The
δ18O of sea ice is typically +2.1‰ higher than the waters from which it formed (Melling and Moore, 1994). Measured surface values ofδ18O during our field programme were
10
around −0.4‰, but we expect this to be a lower limit on the δ18O of waters form-ing sea ice, so we choose a value of +1.9‰ for sea ice δ18O, with an uncertainty of ±0.2‰ to allow for sea ice formation from waters with δ18O in the range −0.4 to 0.0‰. Sea ice salinity is assumed to be 3, a typical bulk salinity for multi-year ice (Eicken, 1992). Finally, the WDW source water mass is chosen by taking the average
salin-15
ity and δ18O from the samples taken near the salinity maximum (defined as salinity 34.67−34.68, potential temperature 0.3−0.5◦C). The chosen end member has salinity
34.76 andδ18O −0.131‰. The error in δ18O is assumed to be the standard error of the mean of the five measurements used, which is ±0.018‰.
The sensitivity of the calculated fractions to these uncertainties has been examined
20
by repeating the 3-end-member calculations with every pair of end members perturbed in every combination. This gives twelve perturbed results, of which four produce the largest errors in sea ice and meteoric water fractions. In the worst case combination for the meteoric fraction, 95% of the calculated fractions lie within 0.19% of the unper-turbed fractions, while in the worst case combination for sea ice 95% of the calculated
25
fractions lie within 0.21% of the unperturbed fractions. Thus the uncertainty in a me-teoric fraction of 1%, for example, is ±0.19%. Fractions of meme-teoric water and sea ice are shown in Figs. 4a and 4b respectively. Again a layered structure is apparent; with the meteoric fraction also showing the strong horizontal variability noted inδ18O.
OSD
4, 709–732, 2007
Ice-shelf – ocean interactions at Fimbul Ice Shelf
M. R. Price Title Page Abstract Introduction Conclusions References Tables Figures ◭ ◮ ◭ ◮ Back Close
Full Screen / Esc
Printer-friendly Version Interactive Discussion
EGU The near surface layer above the ice shelf draft has a relatively high sea ice fraction
up to a maximum of 4.1% and typically greater than 1.5%. Meteoric fraction over the continental shelf varies between 0.6% and 1.2%, and is generally less than 1.0% in the upper layer. Consequently the very fresh near-surface layers have been predominantly freshened by sea ice melt. Two sections, section F along the ice front to the east of
5
the ice tongue and section D in the creek, are very fresh and have a high proportion of sea ice melt down to the depth of the ice shelf base. For section D this is probably a consequence of sea ice melting in an enclosed area. Significant sea ice melt is also indicated around section F where heavy sea ice cover was experienced at the time of the section occupation; this may be a region into which sea ice is advected from the
10
east and subsequently melts.
The sea ice melt fraction below the ice shelf draft is between −0.5% and +0.5%, mostly within ±0.21% (i.e. not significantly different from zero). The average meteoric fraction in the ISW layer is only slightly higher than in the near-surface layer, but there are cores of higher meteoric fraction marked in Fig. 2c by cores of low δ18O. These
15
high fractions of meteoric water are all found west of the ice tongue. Meteoric fractions above 1.0% are not present east of the ice tongue, because there is no local source of ISW here and the general flow along the shelf is westward. Instead, the high meteoric fraction/low δ18O cores mark likely ISW sources west of the ice tongue. There are several cores along the ice front section B, including one lying at around 250 m against
20
the bathymetry on the slope down into the sill. Dynamically this is the most likely location for an ISW rich current flowing out of the Fimbul cavity, at a realistic depth and hugging the slope on its left. However, the horizontal (and vertical) structure in the high meteoric fraction cores perhaps indicate that episodic eddying processes carry some ISW out of the cavity, and that ISW collects at some locations (e.g. around the shallow
25
bathymetry in section A and the west end of section B).
Section C shows an ISW tongue extending back to the cavity, probably reflecting the source there, but the highest fraction core of meteoric water (1.16%) can be seen in station 9 (Fig. 1) at the open end of section D, and just landward of the shelf break
OSD
4, 709–732, 2007
Ice-shelf – ocean interactions at Fimbul Ice Shelf
M. R. Price Title Page Abstract Introduction Conclusions References Tables Figures ◭ ◮ ◭ ◮ Back Close
Full Screen / Esc
Printer-friendly Version Interactive Discussion
EGU section C (the same station is part of both sections). Given that the flow is westward
near the shelf break, this points to the ice tongue as a second source of ISW. Two additional pieces of evidence support this. First, there is a core of ISW with meteoric fraction greater than 1.0% at the closed end of the section D creek, though this could conceivably have a source within the cavity. Secondly, there are two small cores of
5
meteoric fraction greater than 0.8% around 150 m water depth in eddy-like structures seaward of the shelf break in section C. This is evidence of locally sourced glacial melt water being mixed out across the Antarctic Slope Front into the southern Weddell Sea. The slope front will be a strong dynamic barrier to ISW from the cavity; it seems more likely that the source of this glacial melt water is the ice tongue itself.
10
We find negative sea-ice fractions in the warmer layer beneath the ISW. This could indicate water that has been made more saline by brine rejection during sea ice forma-tion. The negative fractions are sufficiently small that they could be an artefact of the uncertainty in end-member choice.
5 Discussion and conclusions
15
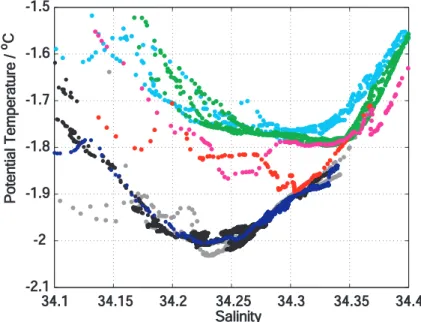
Nicholls et al. (2006) were able to determine that the source water that ultimately be-comes ISW through modification under the ice shelf was not found in our measure-ments at the main sill or upstream in section E. Instead they found a candidate source water at the eastern most sill sampled in section F. Figure 5 includes some of the data they presented, together with some additional stations that show the fate of the ISW
20
that is produced. From west of the ice tongue stations 15 (eastern end of section B), 9 and 29 (west and east ends of section D respectively) are shown, overlain by the data from Autosub mission 382. Below the surface freezing point the water sampled by each lie along the same trajectory inθ−S space. Stations 39 to 41 are shown from seaward
of the shelf break in section E and stations 11 to 14 and 18 from seaward of the shelf
25
break in section C are also shown – the figure shows the temperature minimum into which the ISW will mix. Finally, station 10 at the section C shelf break and station 25
OSD
4, 709–732, 2007
Ice-shelf – ocean interactions at Fimbul Ice Shelf
M. R. Price Title Page Abstract Introduction Conclusions References Tables Figures ◭ ◮ ◭ ◮ Back Close
Full Screen / Esc
Printer-friendly Version Interactive Discussion
EGU at the section A shelf break are shown. The latter two stations show clear evidence
of interleaving and mixing between the ISW and the water over the continental slope downstream of the Fimbul cavity and ice tongue.
Figure 6 provides a summary of the distribution of the two sources of fresh water in the region of Fimbul Ice Shelf. In the upper water column, there is little meteoric input
5
(Fig. 6a) compared with the significant addition of fresh sea ice melt water (Fig. 6b). Two regions show particularly high additions of sea ice melt water, namely upstream of the ice tongue, and in the creek in the lee of the ice tongue. In both depth ranges, great sea ice melt water contributions are seen in the region of the Antarctic Slope Front, tied to the steep topography of the continental slope (Figs. 6b and 6d). The deeper depth
10
range illustrates clearly the outflow of freshwater influenced primarily by the ice shelf (Fig. 6c) where a greater meteoric column height is seen just to the west of the ice shelf.
The sill at the main entrance to the cavity will tend to guide water sourced in the cavity out towards the continental shelf, so that ISW found at station 9 could come from either
15
the cavity or the ice tongue. However, the Antarctic Slope Front and general westward flow makes it unlikely that the melt observed in section C out over the continental slope comes from the cavity. Consequently it seems most likely that two significant sources of ISW have been identified at Fimbul Ice Shelf: the main cavity and the floating ice tongue itself.
20
In their model runs Smedsrud et al. (2006) find an inflow of relatively warm water into Fimbul Ice Shelf system, which adds weight to the argument that the proximity of the eastern Weddell ice shelves to relatively warm deep water makes particularly vulnerable to the effects of any ocean warming. Nicholls et al. (2006) find support for the suggestion of Nøst (2004) that such warm waters will not have direct access
25
to the ice shelf cavity, but instead the source water for the cavity is modified by shelf processes. Our examination of the ship-based hydrographic sections supports this conclusion; we find water warmer than the surface freezing point below the ISW layer but no evidence that WDW enters the cavity directly. However this does not exclude
OSD
4, 709–732, 2007
Ice-shelf – ocean interactions at Fimbul Ice Shelf
M. R. Price Title Page Abstract Introduction Conclusions References Tables Figures ◭ ◮ ◭ ◮ Back Close
Full Screen / Esc
Printer-friendly Version Interactive Discussion
EGU the possibility that warmer water may episodically enter the shelf and ice-cavity system
as the Antarctic Slope Front varies internally and responds to variable wind forcing.
Acknowledgements. We thank the NERC Autosub Under Ice programme for funding of the
UEA and BAS groups. The research would not have been possible without the hard work and enthusiasm of those involved in the programme and in particular all onboard RRS James Clark
5
Ross cruise 97.
References
Beckmann A., Hellmer, H. H., and Timmermann, R.: A numerical model of the Weddell Sea: Large-scale circulation and water mass distribution, J. Geophys. Res., 104(C10), 23 375– 23 391, 1999.
10
Beckmann, A., and Goose, H.: A parameterization of ice shelf-ocean interaction for climate models, Ocean Mod., 5, 157–170, 2004.
Eicken, H.: Salinity Profiles of Antarctic Sea Ice: Field Data and Model Results, J. Geophys. Res., 97(C10), 15 545–15 557, 1992.
EPICA Community Members: One-to-one coupling of glacial climate variability in Greenland
15
and Antarctica, Nature, 444, 195–198, 2006.
Epstein, S. and Mayeda, T.: Variations of O18 content of waters from natural sources, Geochim. Cosmochim. Acta, 4, 213–224, 1953.
Fahrbach, E., Peterson, R. G., Rohardt, G., Schlosser, P., and Bayer, R.: Suppression of bottom water formation in the southeastern Weddell Sea, Deep-Sea Res. I, 41(2), 389–411, 1994.
20
Foldvik, A., Gammelsrod, T., Osterhus, S., Fahrbach, E., Rohardt, G., Schroder, M., Nicholls, K. W., Padman, L., and Woodgate, R. A.: Ice shelf water overflow and bottom water formation in the southern Weddell Sea, J. Geophys. Res. 109, doi:10.1029/2003JC002008, 2004. Gammelsrod, T., Foldvik, A., Nøst, O. A., Skagseth, O., Anderson, L.G., Fogelqvist, E., Olsson,
K., Tanhua, T., Jones, E.P., and Osterhus, S.: Distribution of Water Masses on the
Continen-25
tal Shelf in the Southern Weddell Sea, in: The Polar Oceans and Their Role in Shaping the Global Environment, edited by: O. M. Johannessen, Monogr. Ser., Vol 85, 1994.
Grosfeld, K, Gerdes, R., and Determann, J.: Thermohaline circulation and interaction between ice shelf cavities and the adjacent open ocean, J. Geophys. Res. 102(C7), 15 595–15 610, 1997.
OSD
4, 709–732, 2007
Ice-shelf – ocean interactions at Fimbul Ice Shelf
M. R. Price Title Page Abstract Introduction Conclusions References Tables Figures ◭ ◮ ◭ ◮ Back Close
Full Screen / Esc
Printer-friendly Version Interactive Discussion
EGU Heywood, K. J., Locarnini, R. A., Frew, R. D., Dennis, P. F., and King, B. A.: Transport and
Water Masses of the Antarctic Slope Front System in the Eastern Weddell Sea, Ocean, Ice and Atmosphere: Interactions at the Antarctic Continental Margin, Antarctic Research Series vol. 75, 203–214, 1998.
Jacobs, S. S., Fairbanks, R. G., and Horibe, Y.: Origin and evolution of water masses near the
5
Antarctic continental margin: Evidence from H218O/H216O ratios in seawater, in: Oceanol-ogy of the Antarctic continental shelf, Antarctic Research Series vol. 43, edited by: S. S. Ja-cobs, AGU, Washington D.C., 59–85, 1985.
Melling, H. and Moore, R. M.: Modification of halocline source waters during freezing on the Beaufort Sea shelf: evidence from oxygen isotopes and dissolved nutrients, Cont. Shelf
10
Res., 15, 89–113, 1995.
Meredith, M. P., Heywood, K. J., Frew, R. D., and Dennis, P. F.: Formation and circulation of the water masses between the southern Indian Ocean and Antarctica: Results fromδ18O, J. Mar. Res., 57, 449–470, 1999.
Nicholls, K. W., Abrahamsen, E. P., Buck, J. J. H., Dodd, P. A., Goldblatt, C. , Griffiths, G.,
15
Heywood, K. J., Hughes, N. E., Kaletzky, A., Lane-Serff, G. F., McPhail, S. D. Millard, N. W., Oliver, K. I. C., Perrett, J., Price, M. R., Pudsey, C. J., Saw, K., Stansfield, K. , Stott, M. J., Wadhams, P., Webb, A. T., and Wilkinson, J. P.: Measurements beneath an Antarctic ice shelf using an autonomous underwater vehicle, Geophys. Res. Lett., 33, doi:10.1029/2006GL025998, 2006.
20
Nøst, O. A.: Measurements of ice thickness and seabed topography under the Fimbul Ice Shelf, Dronning Maud Land, Antarctica, J. Geophys. Res. 109, doi:10.1029/2004JC002277, 2004. Rignot, E. and Jacobs, S. S.: Rapid Bottom Melting Widespread near Antarctic Ice Sheet
Grounding Lines, Science, 296, 2020–2022, 2002.
Schlosser, P., Bayer, R., Foldvik, A., Gammelsrod, T., Rohardt, G., and Munnich, K. O.: Oxygen
25
18 and Helium as Tracers of Ice Shelf Water and Water / Ice Interactions in the Weddell Sea, J. Geophys. Res., 95(C3), 3253–3263, 1990.
Smedsrud, L. H., Jenkins, A., Holland, D. M., and N ost, O. A.: Modeling Ocean Processes Beneath Fimbulisen, Antarctica, J. Geophys. Res. 111, doi:10.1029/2006JC001007, 2006. Stenberg, M., Isaksson, E., Hansson, M., Karlen, W., Mayewski, P. A., Twickler, M. S., Whitlow,
30
S. I., and Gundestrup, N.: Spatial variability of snow chemistry in western Dronning Maud Land, Antarctica, Ann. Glaciol., 27, 378–384, 1998.
OSD
4, 709–732, 2007
Ice-shelf – ocean interactions at Fimbul Ice Shelf
M. R. Price Title Page Abstract Introduction Conclusions References Tables Figures ◭ ◮ ◭ ◮ Back Close
Full Screen / Esc
Printer-friendly Version Interactive Discussion
EGU J. Phys. Oceanogr., 25, 1980–1997, 1995.
Vaughan, D. G., Bamber, J. L. , Giovinetto, M., Russell, J., and Cooper, A. P. R.: Reassessment of net surface mass balance in Antarctica, J. Clim., 12, 933–946, 1999
Weiss, R. F., Ostlund, H. G., and Craig, H.: Geochemical studies of the Weddell Sea, Deep-Sea Res., 26A, 1093–1120, 1979.
5
Weppernig, R., Schlosser, P., Khatiwala, S., and Fairbanks, R. G.: Isotope data from Ice Sta-tion Weddell: ImplicaSta-tions for deep water formaSta-tion in the Weddell Sea, J. Geophys. Res., 101(C10), 25 723–25 739, 1996.
OSD
4, 709–732, 2007
Ice-shelf – ocean interactions at Fimbul Ice Shelf
M. R. Price Title Page Abstract Introduction Conclusions References Tables Figures ◭ ◮ ◭ ◮ Back Close
Full Screen / Esc
Printer-friendly Version Interactive Discussion EGU o o o o o o o o o 40’ 20’ o 250 250 500 500 250 750 250 2000 250 500 750 500 2500 3oW W 2oW W 1oW 0o 1oE E 2oE E 3o E E 4o E E 71 71oS S 70 70S S 40
A
B
C
D
E
F
44 25 22 3 15 9 29 10 11-14 18 39-41 43 38 33 Longitude / Longitude / oE Latitude / L a tit u d e / o SFig. 1. Hydrographic sections A to F (red, markers indicate stations) and Autosub Mission 382
(blue). The Fimbul ice edge is shown in black, with bathymetry both inside and out of the ice shelf cavity shown.
OSD
4, 709–732, 2007
Ice-shelf – ocean interactions at Fimbul Ice Shelf
M. R. Price Title Page Abstract Introduction Conclusions References Tables Figures ◭ ◮ ◭ ◮ Back Close
Full Screen / Esc
Printer-friendly Version Interactive Discussion EGU -1.9 -1.9 -1.5 -1.5 -1.0 -1.0 -0.5 -0.5 0.0 0.0 0.2 0.2 0.4 0.4 0 38 38 0 64 64 0 27 27 0 10 10 0 22 22 0 55 55 0 250 250 500 500 750 750 1000 1000 1250 1250 1500 1500
Distance along track / km Distance along track / km
Pressure / dbP re ss u re / d b A B A B CC DD EE FF a 44 4625 22 18 7 4 13 9 189 2939 4338 33 33.5 33.5 34.0 34.0 34.2 34.2 34.4 34.4 34.60 34.60 34.65 34.65 34.67 34.67 0 38 38 0 64 64 0 27 27 0 10 10 0 22 22 0 55 55 0 250 250 500 500 750 750 1000 1000 1250 1250 1500 1500
Distance along track / km
Distance along track / km
Pressure / db P re ss u re / d b A B A B CC DD EE FF b -0.55 -0.55 -0.50 -0.50 -0.45 -0.45 -0.40 -0.40 -0.35 -0.35 -0.30 -0.30 -0.20 -0.20 -0.10 -0.10 0.00 0.00 00 38 38 00 64 64 00 27 27 00 10 10 0 22 22 00 55 55 0 250 250 500 500 750 750 1000 1000 1250 1250 1500 1500
Distance along track / km
Distance along track / km
Pressure / db P re ss u re / d b A B C D E F c
Fig. 2. (a) Potential temperature (b) salinity and (c) oxygen isotope ratioδ18O for the six
hydro-graphic sections A to F (for locations see Fig. 1). Black dots indicate bottle sample locations for theδ18O data. The depth of the base of the ice shelf is indicated by the white dashed line.
OSD
4, 709–732, 2007
Ice-shelf – ocean interactions at Fimbul Ice Shelf
M. R. Price Title Page Abstract Introduction Conclusions References Tables Figures ◭ ◮ ◭ ◮ Back Close
Full Screen / Esc
Printer-friendly Version Interactive Discussion EGU 33 33.2 33.4 33.6 33.8 34 34.2 34.4 34.6 -2 -1.5 -1 -0.5 0 0.5 LSSW AASW WDW MWDW ISW Salinity Potential Temperature / oC 33 33.2 33.4 33.6 33.8 34 34.2 34.4 34.6 -0.5 -0.4 -0.3 -0.2 -0.1 0 Salinity delta 18O -0.5 -0.4 -0.3 -0.2 -0.1 0 -2 -1.5 -1 -0.5 0 0.5 Potential Temperature / oC delta18O
Fig. 3. Property-property diagrams of (a) Potential temperature (◦C) – salinity, (b) Salinity –
δ18O (‰) and (c) Potential temperature (◦C) –δ18
O (‰). In (a) red denotes Autosub CTD data; Blue denotes the eastern-most section F; black denotes other stations on the continental shelf; grey denotes the stations over the slope or deep ocean. In (b) the red marker shows the chosen WDW end member, with red dashed lines connecting to the glacial and sea ice end members.
OSD
4, 709–732, 2007
Ice-shelf – ocean interactions at Fimbul Ice Shelf
M. R. Price Title Page Abstract Introduction Conclusions References Tables Figures ◭ ◮ ◭ ◮ Back Close
Full Screen / Esc
Printer-friendly Version Interactive Discussion EGU 0.2 0.2 0.4 0.4 0.6 0.6 0.8 0.8 1.0 1.0 1.2 1.2
Distance along track / km
Distance along track / km
Pressure / dbP re ss u re / d b A B A B C D EE FF a 00 38 38 0 64 64 00 27 27 00 10 10 0 22 22 0 55 55 0 250 250 500 500 750 750 1000 1000 1250 1250 1500 1500 0.0 0.0 0.5 0.5 1.0 1.0 1.5 1.5 2.0 2.0 2.5 2.5 3.0 3.0 3.5 3.5 4.0 4.0
Distance along track / km
Distance along track / km
Pressure / dbP re ss u re / d b A B A B CC DD EE FF b 00 38 38 00 64 64 0 27 27 0 10 10 0 22 22 00 55 55 0 250 250 500 500 750 750 1000 1000 1250 1250 1500 1500 44 4625 22 18 7 4 13 9 189 2939 4338 33
Fig. 4. (a) Meteoric water fraction (%) and (b) sea ice fraction (%) for the six hydrographic
sections A to F (for locations see Fig. 1) derived from the data shown in Fig. 2. Black dots indicate bottle locations, and the depth of the base of the ice shelf is indicated by the white dashed line.
OSD
4, 709–732, 2007
Ice-shelf – ocean interactions at Fimbul Ice Shelf
M. R. Price Title Page Abstract Introduction Conclusions References Tables Figures ◭ ◮ ◭ ◮ Back Close
Full Screen / Esc
Printer-friendly Version Interactive Discussion EGU 34.1 34.1 34.1534.15 34.234.2 34.2534.25 34.334.3 34.3534.35 34.434.4 -2.1 -2.1 -2 -2 -1.9 -1.9 -1.8 -1.8 -1.7 -1.7 -1.6 -1.6 -1.5 -1.5 Salinity Salinity Potential Temperature / P o te n tia l T e m p e ra tu re / o C
Fig. 5. Potential temperature – salinity diagram for stations 15, 9 and 29 (grey), Autosub
Mission 382 inbound (blue) and outbound (black), stations 39 to 41 (cyan), stations 11 to 14 and 18 (green), station 10 (red) and station 25 (magenta).
OSD
4, 709–732, 2007
Ice-shelf – ocean interactions at Fimbul Ice Shelf
M. R. Price Title Page Abstract Introduction Conclusions References Tables Figures ◭ ◮ ◭ ◮ Back Close
Full Screen / Esc
Printer-friendly Version Interactive Discussion
EGU
Meteoric column height /
Meteoric column height / m
-3 -3 -2-2 -1-1 0 1 2 3 4 -70. -70.4 -70. -70.2 -7 -70 -69. -69.8 -69. -69.6 -69.4 -69.4 1 2 3 4 5 6
Sea ice column height /
Sea ice column height / m
-3 -3 -2-2 -1-1 0 1 2 3 4 -70. -70.4 -70. -70.2 -7 -70 -69. -69.8 -69. -69.6 -69. -69.4 1 2 3 4 5 6
Meteoric column height /
Meteoric column height / m
-3 -3 -2-2 -1-1 0 1 2 3 4 -70. -70.4 -70. -70.2 -7 -70 -69. -69.8 -69. -69.6 -69. -69.4 0. 0.5 1 1.1.5 2
Sea ice column height /
Sea ice column height / m
-3 -3 -2-2 -1-1 0 1 2 3 4 -70. -70.4 -70. -70.2 -7 -70 -69. -69.8 -69. -69.6 -69. -69.4 0. 0.5 1 1.1.5 2 a b c d
Fig. 6. Integrated column heights (m) of freshwater content. The upper two panels show the
depth range from 0–200 m while the lower two panels show 200–400 m. Left hand panels show meteoric input (primarily glacial ice melt in this location) and right hand panels show sea ice melt water. Note the change of colour scale between the upper and lower panels.