HAL Id: hal-00295365
https://hal.archives-ouvertes.fr/hal-00295365
Submitted on 25 Nov 2003
HAL is a multi-disciplinary open access
archive for the deposit and dissemination of
sci-entific research documents, whether they are
pub-lished or not. The documents may come from
teaching and research institutions in France or
abroad, or from public or private research centers.
L’archive ouverte pluridisciplinaire HAL, est
destinée au dépôt et à la diffusion de documents
scientifiques de niveau recherche, publiés ou non,
émanant des établissements d’enseignement et de
recherche français ou étrangers, des laboratoires
publics ou privés.
study of its seasonal variability across the North
Atlantic utilizing tropospheric ozone residuals and its
relationship to the North Atlantic Oscillation
J. K. Creilson, J. Fishman, A. E. Wozniak
To cite this version:
J. K. Creilson, J. Fishman, A. E. Wozniak. Intercontinental transport of tropospheric ozone: a
study of its seasonal variability across the North Atlantic utilizing tropospheric ozone residuals and
its relationship to the North Atlantic Oscillation. Atmospheric Chemistry and Physics, European
Geosciences Union, 2003, 3 (6), pp.2053-2066. �hal-00295365�
www.atmos-chem-phys.org/acp/3/2053/
Chemistry
and Physics
Intercontinental transport of tropospheric ozone: a study of its
seasonal variability across the North Atlantic utilizing tropospheric
ozone residuals and its relationship to the North Atlantic Oscillation
J. K. Creilson1,2, J. Fishman1, and A. E. Wozniak1,2,3
1Atmospheric Sciences Research, NASA Langley Research Center, Hampton, Virginia, USA 2Science Applications International Corporation (SAIC), Hampton, Virginia, USA
3NASA Goddard Space Flight Center, Greenbelt, Maryland, USA
Received: 17 July 2003 – Published in Atmos. Chem. Phys. Discuss.: 12 August 2003 Revised: 31 October 2003 – Accepted: 13 November 2003 – Published: 25 November 2003
Abstract. Using the empirically-corrected tropospheric ozone residual (TOR) technique, which utilizes coincident observations of total ozone from the Total Ozone Mapping Spectrometer (TOMS) and stratospheric ozone profiles from the Solar Backscattered Ultraviolet (SBUV) instruments, the seasonal and regional distribution of tropospheric ozone across the North Atlantic from 1979–2000 is examined. Its relationship to the North Atlantic Oscillation (NAO) is also analyzed as a possible transport mechanism across the North Atlantic. Monthly climatologies of tropospheric ozone for five different regions across the North Atlantic exhibit strong seasonality. The correlation between these monthly clima-tologies of the TOR and ozonesonde profiles at nearby sites in both eastern North America and western Europe are highly significant (R values of +0.98 and +0.96 respectively) and help to validate the use of satellite retrievals of tropospheric ozone. Distinct springtime interannual variability over North Atlantic Region 5 (eastern North Atlantic-western Europe) is particularly evident and exhibits similar variability to the positive phase of the NAO (R=+0.61, ρ=<0.01). Positive phases of the NAO are indicative of a stronger Bermuda-Azores high and a stronger Icelandic low and thus faster more zonal flow across the North Atlantic from west to east. This flow regime appears to be causing the transport of tro-pospheric ozone across the North Atlantic and onto Europe. The consequence of such transport is the impact on a down-wind region’s ability to meet their ozone attainment goals. This link between the positive phase of the NAO and in-creased tropospheric ozone over Region 5 could be an im-portant tool for prediction of such pollution outbreaks.
Correspondence to: J. K. Creilson ([email protected])
1 Introduction
The distribution of ozone in the troposphere is important and of particular interest for a number of reasons. On one hand, ozone photolysis initiates the oxidizing process in the tropo-sphere through the formation of the hydroxyl radical, OH. While on the other hand, it is a greenhouse gas that can af-fect the radiative properties of the atmosphere and potentially the climate system (e.g., Fishman et al., 1979a; Gauss et al., 2003). After considerable debate in the 1970s, it is now rec-ognized that tropospheric ozone has both natural and anthro-pogenic sources: Injection from the stratosphere provides the primary natural source, while the anthropogenic source is photochemical production in the boundary layer (e.g., see discussions by Fishman et al., 1979b; Wang et al., 1998; von Kuhlmann et al., 2003).
To obtain a better understanding of the global tropospheric ozone budget, it is important that a clear picture of its global distribution be obtained. To this end, several ob-servational techniques have been developed using informa-tion from satellite measurements (e.g., Fishman et al., 1990; Kim and Newchurch, 1996, 1998; Hudson and Thompson, 1998; Ziemke et al., 1998, 2000; Fishman and Balok, 1999; Thompson et al., 2003; Fishman et al., 2003). In this study, we use the data set described in Fishman et al. (2003) to ex-amine how an important regional aspect of the tropospheric ozone distribution is influenced by long-range transport and how this transport may vary from year to year. In particular, it has been shown that during the summer over the North At-lantic the amount of photochemically-generated ozone trans-ported from North America appears to be greater than the amount injected from the stratosphere (Parrish et al., 1993), supporting the speculation that transport of pollution off the North American continent can have a strong effect on down-wind regions. Li et al. (2002b) found that the spring tropo-spheric ozone maximum seen at Bermuda is primarily due to
boundary layer transport from eastern North America and not injection from the stratosphere, as previously thought (Olt-mans and Levy, 1992, 1994; Moody et al., 1995).
It is of particular concern that pollution from North Amer-ica may be impacting the overall air quality of Europe (Jon-son et al., 2001; Li et al., 2002a; Prather et al., 2003). One of the goals of the current study is to determine if this long-range transport of tropospheric ozone can be observed in the TOR data base, and whether or not a relationship can be es-tablished between the amount of ozone transport and prevail-ing meteorological parameters that exhibit significant inter-annual variability.
The North Atlantic Regional Experiment (NARE) specifi-cally focused on the magnitude of the pollution coming off of the east coast of North America and the amount found over the adjacent North Atlantic Ocean (Parrish et al., 1993, 1998; Berkowitz et al., 1996). Parrish et al. (1993) speculated that this pollution may be getting transported across the North At-lantic and impacting Europe. Chemical transport models and tracer studies have estimated that the flux of ozone and other trace gases from North America to the North Atlantic Ocean can be high (Chin et al., 1994; Atherton et al., 1996; Liang et al., 1998; Li et al., 2002a) and under the right meteorological conditions can be seen thousands of kilometers downwind of its sources (Stohl and Trickl, 1999; Li et al., 2002a; Stohl et al., 2002, 2003). Quantitative estimates of this flux of ozone from eastern North America to the North Atlantic have been approximated to range from 1.0 to 1.6 Gmol/day (Chin et al., 1994; Berkowitz et al., 1996). While flux estimates for the entire North American boundary layer have been estimated to range from 3.8 Gmol/day (Liang et al., 1998) to as much as 6 Gmol/day (Li et al., 2002a).
Previous studies identified episodes of long range trans-port of North American tropospheric ozone towards Europe (Parrish et al., 1993; Stohl and Trickl, 1999; CENR, 2001; Li et al., 2002a; Reeves et al., 2002; Stohl et al., 2002). Most of these studies focus on the warm conveyor belt pro-cess associated with cyclonic pressure systems where tro-pospheric ozone is lifted into the free troposphere over the eastern continental U.S. and transported via the westerlies across the North Atlantic and onto Europe (Berkowitz et al., 1996; Cooper et al., 2002; Reeves et al., 2002). Berkowitz et al. (1996) found during NARE that the main synoptic scale transport mechanism was associated with these east-ward moving cyclonic systems. This process coupled with direct westerly flow off the North American continent act as the primary mechanisms of ozone transport onto the North Atlantic. Once into the North Atlantic, the movement of this ozone can come under flow patterns that are modulated by the North Atlantic Oscillation (NAO). In the mid-latitudes, the NAO is the leading mode of variability across the North Atlantic and dictates the strength and pathways of the west-erly movement of air across this region. Stohl et al. (2003) discovered that the combination of synoptic systems over eastern North America and a strong low situated over the
Icelandic region can quickly (2–3 days) transport NOx
pollu-tion directly across the North Atlantic and onto Europe. The strong low that was seen over Iceland during this event di-rected the flow of air and, even though this was a case study of one episode, highlights the strong transport mechanism associated with the Icelandic low. Seasonal Relationships involving the phase of the NAO and both surface ozone in Mace Head Ireland (Li et al., 2002a) and pollution transport to the Arctic (Eckhardt et al., 2003), as well as between the NAO and Saharan dust build-up in the Caribbean (Moulin et al., 1997), have been discovered.
Using the tropospheric ozone residual (TOR) database de-scribed in Fishman et al. (2003), the integrated result of in-tercontinental transport and in situ photochemical produc-tion of tropospheric ozone from 1979–2000 is examined and its relationship to the North Atlantic Oscillation is studied. This investigation examines the impact that the NAO has on the seasonal distribution of tropospheric ozone at several sites across the North Atlantic. We begin with a discussion about the prevailing meteorology across the North Atlantic, followed by a discussion of the distribution of tropospheric ozone across this region, its relationship with the NAO and available ozonesonde profiles on both sides of the Atlantic, and continue by examining the strongest relationship found in the data and why it may be occurring.
2 North Atlantic Circulation and the North Atlantic Os-cillation
The prevailing atmospheric flow off of North America is from west to east. This flow regime transports air parcels containing anthropogenic pollution off of the continent and out into the North Atlantic Ocean. Three dominant mecha-nisms assist in this movement of air: Frontal lifting via the warm conveyor belt process; convection over continental ar-eas that lifts air parcels into the free troposphere where they are transported by the westerlies; and direct westerly move-ment of boundary layer air. Once out over the North Atlantic Ocean, the large scale features that govern this region help determine its fate.
In the midlatitudes, the large-scale circulation over the North Atlantic is primarily governed by three features: 1) the Icelandic low, 2) the semi-permanent Bermuda-Azores high, and 3) the Northeasterly trade winds (Aguado and Burt, 1999). Across the northern part of the North Atlantic (north-ward of 30◦N), the Icelandic low and the Bermuda- Azores high dominate. The northeasterly trade winds run south of this area (20◦N) towards the equator.
The NAO index is determined by the strength and location of the Icelandic low and the Bermuda-Azores high. Hurrell (1995) defines the NAO index as the difference in sea level pressure between a station in either Lisbon, Portugal (ex-tended winter index) or Ponta Delgada, Azores (monthly and seasonal indices), and a station in Stykkisholmur/Reykjavik,
Positive Phase of the North Atlantic Oscillation
Negative Phase of the North Atlantic Oscillation
Fig 1. Graphical representation of the positive phase (1a) and negative phase (1b) of the
North Atlantic Oscillation (NAO). For this study. the focus of this figure is on the
following: Differences between the strength and location of both the Icelandic low and
Bermuda/Azores high, the position and strength of the westerlies, and climate impacts of
the two phases of the NAO. The figure is courtesy of Dr. R. Dickson
(
www.ices.dk/globec/data/bf4/naomap.htm
).
1a
1b
Fig. 1. Graphical representation of the positive phase (1a) and negative phase (1b) of the North Atlantic Oscillation (NAO). For this study,
the focus of this figure is on the following: Differences between the strength and location of both the Icelandic low and Bermuda/Azores high, the position and strength of the westerlies, and climate impacts of the two phases of the NAO. The figure is courtesy of Dr. R. Dickson (www.ices.dk/globec/data/bf4/naomap.htm).
Iceland. During the positive phase of the NAO (top image in Fig. 1), the Icelandic low and the Azores high are relatively strong. This increased difference between the two pressure systems sets up a greater north-south pressure gradient due to the difference in pressure between the low and the high and the associated meridional variation in mass balance between the subtropical mid-latitudes (Bermuda-Azores high) and the higher latitudes (Icelandic low). The gradient produces an enhanced zonal (west to east) flow, causing air to move more quickly and with less impedance from west to east across the North Atlantic. During the negative phase (bottom image in Fig. 1), the Icelandic low and the Azores high both weaken causing the circulation across the North Atlantic to be altered (i.e., less zonal, more meridional). This altered flow is less conducive to transport of air parcels making it directly from the North American continent to Europe, which is more than likely due to the increased north-south (meridional) flow pat-tern that sets up.
Studies of the NAO’s influence have focused primarily on the winter and spring seasons when the westerlies are faster and its relationship to changes in North American and European climate (temperature and precipitation anomalies) have been noted (Hurrell, 1995; Rogers, 1997). Some of the stronger relationships discovered have linked the pos-itive phase of the NAO with above normal temperatures across western Europe and below normal precipitation across central and southern Europe (Hurrell, 1995; Hurrell et al., 2003; Visbeck et al., 2001). However, the NAO displays considerable monthly and interannual variability (Hurrell, 1995) and its effects have been observed in all seasons. Re-cently, relationships between the NAO and “other” atmo-spheric phenomena, such as total ozone (Appenzeller et al., 2000; Braesicke et al., 2000), carbon monoxide (Eckhardt et al., 2003), and tropospheric ozone (Li et al., 2002a), have been studied. Li et al. (2002a) found that when the spring NAO is positive there is an increase in surface ozone at Mace Head Ireland and they concluded that the increase was due to westerly transport of North American pollution across the North Atlantic. In addition, Eckhardt et al. (2003) found that there is a strong relationship between the positive phase of the NAO and surface concentrations of carbon monoxide (CO) in the Arctic; this finding was most pronounced dur-ing the winter and sprdur-ing. They also noted that both North American and European pollution contributed to the build-up in the Arctic during the positive phase of the NAO.
3 Tropospheric Ozone Data
3.1 Tropospheric Ozone Residual (TOR) Technique and Seasonal Depictions
Fishman et al. (2003) present a summary of the global distribution of TOR using coincident measurements from the Total Ozone Mapping Spectrometer (TOMS) and Solar
Backscattered Ultraviolet (SBUV) instruments from 1979– 2000. During this period, nearly eighteen years of monthly averages over most of the globe from 50◦N to 50◦S have been calculated (data available at http://asd-www.larc.nasa. gov/TOR/data.html). A description of the technique can be found in Fishman and Balok (1999) and Fishman et al. (2003). The seasonal distributions shown in Fig. 2 rep-resent the 1979–2000 TOR climatologies across the North Atlantic. Each 1◦latitude×1.25◦longitude pixel (TOMS grid size) shown represents an average of ∼1600 points (∼90 days×∼18 years). This density of data points is able to show the seasonal variability of tropospheric ozone across the North Atlantic with areas of higher tropospheric ozone evident in the spring and summer seasons. Further regional analysis of the seasonal data is completed by binning the data into the five regions shown in Fig. 3 (Oxford Atlas of the World, 2000). Figure 4 shows the monthly climatology of each of these five regions and illustrates both the strong seasonality and regional differences that might be linked to in situ production or transport into a particular region. The regions were chosen because they represent a cross section of the North Atlantic and are in the midlatitudes (between 30 and 45◦N); two of the areas (Regions 1 and 5) are in close proximity to excellent ozonesonde profile climatolo-gies (Wallops Island and Hohenpeissenberg, respectively), which span the same time period and thus could be used for validation. The seasonal TOR values for each region are defined by 81 TOMS grid points centered on each location shown in Fig. 3 and are summarized by season in Table 1. For all seasons except summer, the data show that higher amounts of TOR are present over the North Atlantic than over the adjacent coasts of eastern North America and west-ern Europe. Such a distribution would be consistent with the hypothesis that slower photochemical generation of ozone is taking place during the non-summer seasons, but that rapid generation of boundary-layer ozone during the summer over the eastern United States dominates the observed TOR dis-tribution.
3.2 Ozonesonde Analysis and Validation
For validation, we compared the TOR over the eastern U.S. and western Europe (Regions 1 and 5 in Fig. 3) with cli-matological ozonesonde profiles from Wallops Island, Vir-ginia (USA) and Hohenpeissenberg (Germany), respectively. Ozonesonde data were obtained from an archive maintained at NASA Langley Research Center (V. Brackett, NASA Langley Research Center, personal communications, 2002). Most of the data in this archive (including the two stations used in this analysis) came from the World Ozone and Ultra-violet Data Center (WOUDC), Environment Canada (http: //www.woudc.org/index e.html). Monthly and seasonal cli-matological values of the integrated ozone in the troposphere for these two stations were calculated. These integrals were derived using the definition of the thermal tropopause, which
December-February
March-May
June-August
September-November
Dobson Units (DU)
Fig 2. Climatological depictions of tropospheric ozone residual (TOR) across the North Atlantic obtained
from the empirical correction technique (Fishman et al., 2003). The four panels correspond to NH winter (December-February), spring (March-May), summer (June-August), and autumn (September-November).
December-February
March-May
June-August
September-November
Dobson Units (DU)
Fig 2. Climatological depictions of tropospheric ozone residual (TOR) across the North Atlantic obtained from the empirical correction technique (Fishman et al., 2003). The four panels correspond to NH winter (December-February), spring (March-May), summer (June-August), and autumn (September-November).
December-February March-May
June-August September-November
Dobson Units (DU)
Fig 2. Climatological depictions of tropospheric ozone residual (TOR) across the North Atlantic obtained
from the empirical correction technique (Fishman et al., 2003). The four panels correspond to NH winter (December-February), spring (March-May), summer (June-August), and autumn (September-November).
Fig. 2. Climatological depictions of tropospheric ozone residual (TOR) across the North Atlantic obtained from the empirical correction
technique (Fishman et al., 2003). The four panels correspond to NH winter (December–February), spring (March–May), summer (June– August), and autumn (September–November).
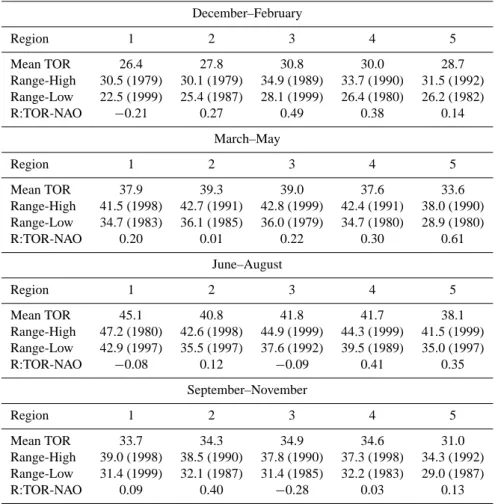
Table 1. Seasonal mean TOR, TOR range, and TOR-NAO correlation for each of the five regions shown in Fig. 3 for the 1979–2000 time
period. Significant correlations are highlighted. All TOR values are in Dobson Units (DU). December–February Region 1 2 3 4 5 Mean TOR 26.4 27.8 30.8 30.0 28.7 Range-High 30.5 (1979) 30.1 (1979) 34.9 (1989) 33.7 (1990) 31.5 (1992) Range-Low 22.5 (1999) 25.4 (1987) 28.1 (1999) 26.4 (1980) 26.2 (1982) R:TOR-NAO −0.21 0.27 0.49 0.38 0.14 March–May Region 1 2 3 4 5 Mean TOR 37.9 39.3 39.0 37.6 33.6 Range-High 41.5 (1998) 42.7 (1991) 42.8 (1999) 42.4 (1991) 38.0 (1990) Range-Low 34.7 (1983) 36.1 (1985) 36.0 (1979) 34.7 (1980) 28.9 (1980) R:TOR-NAO 0.20 0.01 0.22 0.30 0.61 June–August Region 1 2 3 4 5 Mean TOR 45.1 40.8 41.8 41.7 38.1 Range-High 47.2 (1980) 42.6 (1998) 44.9 (1999) 44.3 (1999) 41.5 (1999) Range-Low 42.9 (1997) 35.5 (1997) 37.6 (1992) 39.5 (1989) 35.0 (1997) R:TOR-NAO −0.08 0.12 −0.09 0.41 0.35 September–November Region 1 2 3 4 5 Mean TOR 33.7 34.3 34.9 34.6 31.0 Range-High 39.0 (1998) 38.5 (1990) 37.8 (1990) 37.3 (1998) 34.3 (1992) Range-Low 31.4 (1999) 32.1 (1987) 31.4 (1985) 32.2 (1983) 29.0 (1987) R:TOR-NAO 0.09 0.40 −0.28 0.03 0.13
is determined when the lapse rate becomes less than 2 K/km. These profiles were then used to compare against the TOR values adjacent or coincident to these two locations. These two data sets were chosen due to their long records that cover the same time period as the TOR data set and their relative proximity to the TOR in Regions 1 and 5. These monthly ozonesonde climatologies were used to compare against the monthly TOR climatologies for the 1979–2000 time period. Earlier work has shown that ozonesondes can be used as a validation for the amount of tropospheric ozone column data retrieved from satellites (Fishman et al., 1990; Hudson and Thompson, 1998; Ziemke et al., 1998, 2000; Fishman and Balok, 1999; Thompson et al., 2003).
Figure 5 compares the monthly climatological TOR cycles in Regions 1 and 5 with the observations from Wallops Is-land and Hohenpeissenberg, respectively. At Wallops IsIs-land, the TOR products underestimate the ozonesonde-derived val-ues by 1.9–8.2 DU per month with the average value be-ing 4.4 DU (∼11%). The comparison between Region 5 and the Hohenpeissenberg data is similarly good with the average value for the TOR being 2.2 DU higher than the
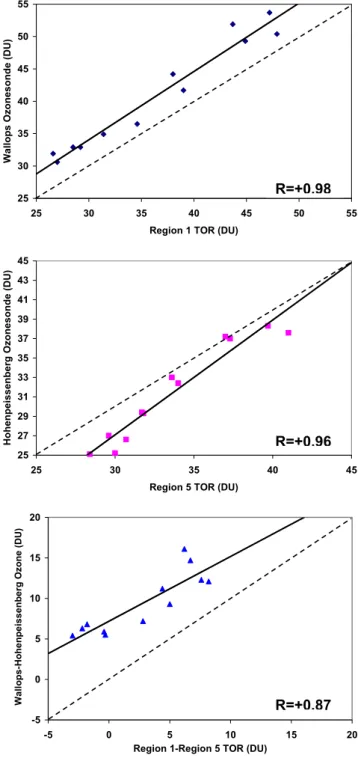
ozonesondes with an average monthly difference never ex-ceeding 4.8 DU (January difference). Figures 6a and b are plots showing the monthly-averaged profiles derived from ozonesonde measurements compared with the amount de-rived utilizing the TOR technique for Region 1 and Region 5 respectively. As can be seen in the relationships (Figs. 6a and b), the integrated amount of tropospheric ozone (TOR) over these regions succinctly captures the variability within the monthly averaged ozonesonde profiles with a correlation coefficient (R-value) of +0.98 for Wallops Island/Region 1 (Fig. 6a) and an R2 value of 0.96. A similarly strong re-lationship (R=+0.96, R2=0.93) is also seen for Hohenpeis-senberg/Region 5 (Fig. 6b). Similar results were seen at Wal-lops (R=+0.98; R2=0.96) and Hohenpeissenberg (R=+0.94; R2=0.88) when a comparison was made between the monthly ozonesonde data and the TOR located at the coincident pixel (versus the 9×9 pixel region).
Figure 6c highlights the covariance between the gradients observed in the two sets of climatological measurements. This plot confirms that the average monthly differences in the TOR between these two locations is in good agreement
40°N
40°N
50°N
50°N
30°N
30°N
20°N
20°N
60°N
60°N
70°N
70°N
Fig 3. North Atlantic Study Area (8
thOxford Atlas of the World, 2000).The
following are the five numbered regions shown in the study area above: Region
1: Wallops Island, VA (37.5N, 75W), Region 2: Bermuda (33.2N, 64.4W),
Region 3: Azores (38.5N, 27.5W),Region 4: Lisbon (38.4N, 9.8W), and Region
5: Southwest France (44.4N, 1.2W).
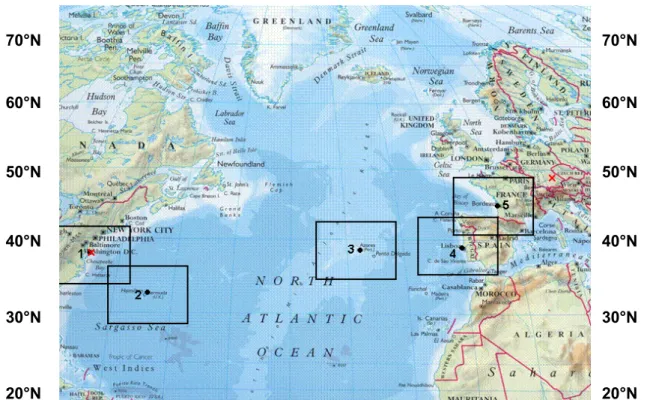
Fig. 3. North Atlantic Study Area (8th Oxford Atlas of the World, 2000).The following are the five numbered regions shown in the study area
above: Region 1: Wallops Island, VA (37.5◦N, 75◦W), Region 2: Bermuda (33.2◦N, 64.4◦W), Region 3: Azores (38.5◦N, 27.5◦W),Region 4: Lisbon (38.4◦N, 9.8◦W), and Region 5: Southwest France (44.4◦N, 1.2◦W).
with the same quantities derived from ozonesonde profiles (R=+0.87, R2=0.76). This strong correlation suggests that
regional variations observed in the TOR fields can be ana-lyzed on shorter time scales to provide insight into the in-terannual variability of TOR and its potential relationship to other physical parameters.
3.3 Meridional Differences across the North Atlantic Referring back to Fig. 4, we note that each of the five regions exhibits a distinct seasonal variability with highest amounts in the late spring/early summer timeframe and lesser amounts in the winter season. There appears to be higher amounts in the western Atlantic earlier in the year and greater amounts in the eastern Atlantic as the year progresses. The peak for Re-gions 1–4 occur in the early summer while the Region 5 peak occurs in the mid-summer. It is interesting to note the rapid increase through the mid to late spring in each region and then a subsequent leveling off or even dropping off during the early summer. The distribution for Regions 3 and 4 exhibit a distinct leveling off during the late spring/early summer pe-riod, possibly due to the onset of the Bermuda-Azores high. Region 2 (Bermuda) shows the strongest spring increase and then followed by a sharp drop-off from June to July, also coinciding with the Bermuda-Azores high. Region 1 shows continued high TOR during most of the summer which is consistent with the strong production processes in the
east-1 1 1 1 1 1 1 1 1 1 1 1 2 2 2 2 2 2 2 2 2 2 2 2 3 3 3 3 3 3 3 3 3 3 3 3 4 4 4 4 4 4 4 4 4 4 4 4 5 5 5 5 5 5 5 5 5 5 5 5 25 30 35 40 45 50 J F M A M J J A S O N D TO R ( D U ) 1 2 3 4 5
Fig 4. Monthly climatological distribution of tropospheric ozone for the five regions
shown in Figure 3. The numbers in the legend and on the profiles correspond to the numbered regions in Figure 3 and are from west to east. All TOR values are in Dobson Units (DU).
Study Regions
Fig. 4. Monthly climatological distribution of tropospheric ozone
for the five regions shown in Fig. 3. The numbers in the legend and on the profiles correspond to the numbered regions in Fig. 3 and are from west to east. All TOR values are in Dobson Units (DU).
ern U.S. during the summer. Region 5 shows a later peak and then gradual decrease towards the winter, which could be consistent with either a climatologically later in situ pho-tochemical production period or with changes in transport patterns.
1 1 1 1 1 1 1 1 1 1 1 1 5 5 5 5 5 5 5 5 5 5 5 5 W W W W W W W W W W W W H H H H H H H H H H H H 0 10 20 30 40 50 60 J F M A M J J A S O N D Tropospheric O zone (D U ) 1 5 W H
Fig 5. Monthly climatological tropospheric ozone for Regions 1 and 5 and monthly
climatological ozonesonde profiles for Wallops Island USA (W) and Hohenpeissenberg, Germany (H). All tropospheric ozone values are in Dobson Units (DU).
Fig. 5. Monthly climatological tropospheric ozone for Regions 1
and 5 and monthly climatological ozonesonde profiles for Wallops Island USA (W) and Hohenpeissenberg, Germany (H). All tropo-spheric ozone values are in Dobson Units (DU).
Figure 4 also highlights the progression of the TOR through the spring. It shows that the TOR over Region 1 moves from approximately 31 DU to 38 DU to 45 DU, an in-crease of 45% (14 DU) across this three month period. While the TOR over Region 5 moves from approximately 32 DU to 34 DU to 37 DU, a 16% (5 DU) increase for this same period. The eastern U.S. has been shown to be an area where tropo-spheric ozone is photochemically-produced and thus should likely experience an increase in the amount of tropospheric ozone due to increased photochemistry, once precursors are present (usually following the winter season) and an increase in insolation (evident during springtime) occurs.
3.4 Latitudinal Variability of Seasonality over the North Atlantic
Figure 7 shows the monthly zonal TOR climatology from approximately 80◦W to 20◦E. Five zones are shown in 5-degree bands from south to north between 20◦N and 45◦N. The legend symbols for each profile represent the midpoint of the 5-degree latitude bands (22 for 20–25◦N; 27 for 25– 30◦N; etc). Analysis of this figure shows some interesting features. All five bands display strong increases through the early to mid springtime period (March–April) with the lower latitude bands (22 and 27) leveling off or actually decreasing in May (band 22). The remaining three bands continue to increase into early summer with latitude band 42 having the latest peak (July). Interestingly, latitude band 37 shows the greatest TOR values (∼44 DU in June). The rapid increase through the spring and into early summer is consistent with the northward progression of the springtime sun and the sub-sequent increased photochemical activity. A drop-off in the TOR at band 32 after June is consistent with the climato-logical onset of the Bermuda high and the ozone destruction
25 30 35 40 45 50 55 25 30 35 40 45 50 55
Region 1 TOR (DU)
Wallops Ozonesonde (D U ) 25 27 29 31 33 35 37 39 41 43 45 25 30 35 40 45
Region 5 TOR (DU)
H ohenpeissenber g Ozonesonde (D U ) -5 0 5 10 15 20 -5 0 5 10 15 20
Region 1-Region 5 TOR (DU)
Wallo p s -H o h en p e issen b e rg O zo n e (D U ) 6a 6b 6c
Fig 6. Monthly averaged scatter plots (1979-2000) between 6a) Region 1 TOR and ozonesonde profiles from
Wallops Island; 6b) Region 5 TOR and ozonesonde profiles from Hohenpeissenberg; and 6c) Relationship between the difference in TOR between Region 1 and 5 and the difference in ozonesonde profiles between Wallops Island and Hohenpeissenberg. All values are in Dobson Units (DU).
R=+0.98
R=+0.96
R=+0.87
Fig. 6. Monthly averaged scatter plots (1979–2000) between 6a)
Region 1 TOR and ozonesonde profiles from Wallops Island; 6b) Region 5 TOR and ozonesonde profiles from Hohenpeissenberg; and 6c) Relationship between the difference in TOR between Re-gion 1 and 5 and the difference in ozonesonde profiles between Wallops Island and Hohenpeissenberg. All values are in Dobson Units (DU).
22 22 22 22 22 22 22 22 22 22 22 22 27 27 27 27 27 27 27 27 27 27 27 27 32 32 32 32 32 32 32 32 32 32 32 32 37 37 37 37 37 37 37 37 37 37 37 37 42 42 42 42 42 42 42 42 42 42 42 42 25 30 35 40 45 50 J F M A M J J A S O N D TO R ( D U ) 22 27 32 37 42
Fig 7. Monthly climatological distribution of tropospheric ozone for five adjacent
latitude bands: 20-25°N, 25-30°N, 30-35°N, 35-40°N, and 40-45°N. The longitudinal range for these bands is from 80°W to 20°E. The number shown on each line represents which band it is; with the number being the approximate midpoint of each of the bands. All TOR values are in Dobson Units (DU).
Fig. 7. Monthly climatological distribution of tropospheric ozone
for five adjacent latitude bands: 20–25◦N, 25–30◦N, 30–35◦N, 35–40◦N, and 40–45◦N. The longitudinal range for these bands is from 80◦W to 20◦E. The number shown on each line represents which band it is; with the number being the approximate midpoint of each of the bands. All TOR values are in Dobson Units (DU).
processes in the planetary boundary layer that accompany it (Oltmans, 1981; Oltmans and Levy, 1992, 1994). The rela-tive maximum in the TOR seen at the lower latitudes (bands 22, 27, and to a lesser extent in band 32) in the October and November timeframe is the subject of an on-going study. The amounts and rate of increase of TOR are consistent with the regional profiles seen in Fig. 4 and with the ozonesonde pro-files used in the analysis shown in Figs. 5 and 6.
4 Relationship between Region 5 Springtime Tropo-spheric Ozone and the NAO
Several researchers have shown seasonal linkages between transport of atmospheric constituents (i.e., ozone, dust) and the phase of the NAO (Moulin et al., 1997; Li et al., 2002a; Eckhardt et al., 2003). These analyses have focused on the phase of the NAO in determining relative strengths and possi-ble transport pathways. In addition to the seasonal TOR val-ues derived for each region by season (see Table 1), contem-poraneous correlations between the phase of the NAO and the amount of tropospheric ozone in each region were calculated for each season and are also shown in this table. From Table 1, the strongest TOR-NAO relationship (level of significance exceeding .01) shown is between the TOR over Western Eu-rope (Region 5) in the spring and the positive phase of the NAO in the same season. Since this relationship is clearly the strongest and other researchers have seen similarly strong relationships (Li et al., 2002a), we focus on the interdepen-dence between the TOR and the NAO in this section.
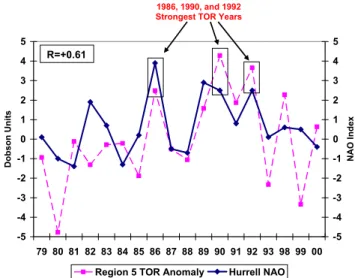
Figure 8 depicts the interannual variability of the spring-time TOR anomaly in Region 5 versus the Hurrell NAO in-dex in the spring from 1979–2000. NAO inin-dex data is
pro--5 -4 -3 -2 -1 0 1 2 3 4 5 79 80 81 82 83 84 85 86 87 88 89 90 91 92 93 98 99 00 Do b so n Un it s -5 -4 -3 -2 -1 0 1 2 3 4 5 NAO I n d ex
Region 5 TOR Anomaly Hurrell NAO
Fig 8. Springtime depiction showing the interannual variability and positive relationship
between springtime tropospheric ozone residual anomaly for Region 5 and the springtime Hurrell NAO index (R=+0.61) from 1979-2000. The data gap from 1994-1997 is due to a combination of either TOMS or SBUV observations not being available (Fishman et al., 2003).
R=+0.61
1986, 1990, and 1992 Strongest TOR Years
Fig. 8. Springtime depiction showing the interannual variability and
positive relationship between springtime tropospheric ozone resid-ual anomaly for Region 5 and the springtime Hurrell NAO index (R=+0.61) from 1979–2000. The data gap from 1994–1997 is due to a combination of either TOMS SBUV observations not being available (Fishman et al., 2003).
vided by the Climate Analysis Section, NCAR, Boulder, CO, USA, Hurrell (1995) and is available at www.cgd.ucar.edu/ ∼jhurrell/nao.html. For the majority of the years from 1979– 2000, the largest positive anomalies of tropospheric ozone (1986, 1990, 1992) correspond to years with a highly posi-tive NAO index. The magnitude of the variability in the TOR appears to be greater than in the NAO index however the sign and extent of the variability of the TOR and NAO appear to be very similar.
An example of the Region 5 springtime TOR variability in Fig. 8 can be seen by comparing a highly positive NAO year (1990) with a highly negative NAO year (1980). The years 1990 and 1980 were chosen because they contained the greatest and least average springtime amounts of tropo-spheric ozone respectively. Figures 9a and b highlight the magnitude of the TOR over Region 5 for the springs of 1990 and 1980 respectively. Examination of the spring 1990 and 1980 depictions show that there is a greater amount of tro-pospheric ozone over this region during the positive NAO year than during the negative NAO year; the 1990 average is 38.5 DU whereas the 1980 average is 30.3, a 27% differ-ence. Our analysis also shows that the relationship breaks down over the JJA and SON time periods, consistent with the weak correlations seen in Table 1. This breakdown also coincides with the times of the year when the westerlies are not as strong and would have less of an influence than in win-ter and spring.
To examine this springtime relationship in greater detail, we divided the common MAM definition of spring into two month periods (March–April, March–May, April–May) and
2062 J. K. Creilson et al.: Intercontinental transport of tropospheric ozone
1990 (Positive NAO)
1980 (Negative NAO)
Fig 9. Interannual depiction contrasting the magnitude of tropospheric ozone (TOR)
during spring (MAM) of a positive NAO year (1990) (9a) and spring of a negative
NAO year (1980) (9b), including the corresponding sea level pressure (SLP) and
850mb wind (u and v) streamlines for April of 1990 (9c) and 1980 (9d) (data from
NCEP/NCAR Reanalysis). The units for 9a and 9b are Dobson Units (DU), while
the units for 9c and 9d are millibars (mb).
9a
9b
1990 (Positive NAO)
1980 (Negative NAO)
Fig 9. Interannual depiction contrasting the magnitude of tropospheric ozone (TOR)
during spring (MAM) of a positive NAO year (1990) (9a) and spring of a negative
NAO year (1980) (9b), including the corresponding sea level pressure (SLP) and
850mb wind (u and v) streamlines for April of 1990 (9c) and 1980 (9d) (data from
NCEP/NCAR Reanalysis). The units for 9a and 9b are Dobson Units (DU), while
the units for 9c and 9d are millibars (mb).
9c
9d
Fig. 9. Interannual depiction contrasting the magnitude of tropospheric ozone (TOR) during spring (MAM) of a positive NAO year (1990)
(9a) and spring of a negative NAO year (1980) (9b), including the corresponding sea level pressure (SLP) and 850mb wind (u and v) streamlines for April of 1990 (9c) and 1980 (9d) (data from NCEP/NCAR Reanalysis). The units for 9a and 9b are Dobson Units (DU), while the units for 9c and 9d are millibars (mb).
then correlated it with a two-month average NAO index. This analysis shows that the April-May time period (R=+0.62) drives the high overall correlation shown in Table 1 for Re-gion 5. The stronger relationship during this two-month pe-riod is consistent with both a greater increase of TOR over this period in this region and a greater amount of ozone avail-able in regions that are further west that could be transported into this region.
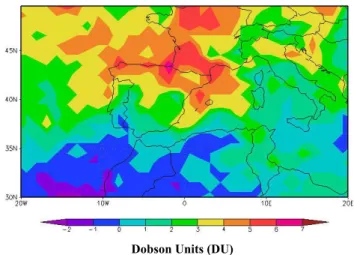
A composite TOR analysis of the springs with the top four most positive and top four most negative NAO indices is shown in Fig. 10; where the “positive” NAO depiction in-cludes 1986, 1989, 1990, and 1992 and the “negative” NAO years include 1980, 1981, 1984, and 1988. Figure 10 shows the result when taking the difference (positive NAO-negative NAO) of this compositing effort over Region 5. As evidenced by the positive TOR anomaly, the amount of TOR is stronger during the positive phase than during the negative phase by approximately 6 DU (19% increase), consistent with what is seen in Figs. 9a and b.
5 Factors to Consider for Strong Springtime Relation-ship
5.1 Prevailing Meteorology
Several factors could be responsible for the positive relation-ship between the amount of tropospheric ozone seen in Re-gion 5 and the phase of the NAO during the spring. The first factor deals with the potential transport of tropospheric ozone and/or its precursors across the North Atlantic. Dur-ing a positive NAO year, the Azores high and the Icelandic low are relatively strong. Figures 9c and d show the average sea level pressure pattern and the 850 mb winds during April of both 1990 (Fig. 9c) and 1980 (Fig. 9d) over the North Atlantic respectively. The sea level pressure and 850 mb wind data are from the NCEP/NCAR Reanalysis (Kalnay et al., 1996) and are available at http://www.cdc.noaa.gov/. What is evident in Fig. 9c is the very strong Bermuda-Azores high (>1027 mb) that persists throughout the month of April
1990. The circulation that sets up between this high pres-sure system and the low prespres-sure to the north (Icelandic low) creates a strong zonal flow across the North Atlantic with the axis of strongest winds centered along the 45◦N latitude belt. This pathway would enable air parcels that are moving west to east to get channeled through this area on its way towards Europe. The other variable that is seen on this figure is the 850 mb winds. An analysis of these winds shows that the tra-jectory coming off the North American continent has a west-erly component essentially all the way down to the top of the boundary layer. Similar analyses of the winds and pressure regimes up through the free troposphere also show a similar westerly component to the flow. This pressure regime is ev-ident during positive phases of the NAO (Fig. 1a), allowing for a more direct movement of air across the North Atlantic. Such a setup would provide an efficient pathway for pollu-tion to be transported from North America to Europe. During negative phases of the NAO (Fig. 1b), the Azores high and/or the Icelandic low are weaker and may set up in a less favor-able location for transport to the west; such a situation is seen in Fig. 9d. The flow becomes more meridional (north-south) causing the strong zonal flow to be altered and thus the path-way across the North Atlantic is altered. This pathpath-way is less conducive to direct westerly transport.
A 15-year (1979–1993) tracer simulation (Eckhardt et al., 2003) found that more North American springtime air pollu-tion is transported across the North Atlantic during the posi-tive phase of the NAO, ultimately increasing pollution levels in the Arctic. The current study can be viewed as an ex-tension of Eckhardt et al. (2003) as a means to quantify the amount of pollution transported as a function of the strength of the NAO.
5.2 Stratosphere-Troposphere Exchange (STE)
Another factor to be considered when discussing the origin of enhanced tropospheric ozone, especially during the spring, is how much ozone of the observed enhanced ozone is com-ing from the stratosphere. Although the relationship between the NAO and ozone over this region can help to explain the transport of ozone or its precursors, spring is a season when the polar front and jet are further south and can experience fluctuations, frequently being found in the central midlati-tudes (Vaughan and Price, 1991). We have conducted an analysis of the distribution of potential vorticity (PV) dur-ing a sprdur-ing with a high NAO index to examine the possi-bility of a relationship between the intensity of stratosphere-troposphere exchange (STE) and the positive phase of the NAO. PV data were obtained from an archive at NASA Lan-gley Research Center (B. Pierce, NASA LanLan-gley Research Center, personal communication, 2003). Using the 2 PV con-tour at the tropopause as a determination of whether the air is of stratospheric versus tropospheric origin, and looking at the spring of 1992, a spring when we have both enhanced tropospheric ozone and available PV data, higher PV is seen
Fig 10. Depiction showing the composite difference in Region 5 TOR between four most
positive NAO springs (1986, 1989, 1990, 1992) and four most negative NAO springs (1980, 1981, 1984, 1988).
Dobson Units (DU)
Fig. 10. Depiction showing the composite difference in Region 5
TOR between four most positive NAO springs (1986, 1989, 1990, 1992) and four most negative NAO springs (1980, 1981, 1984, 1988).
in the North Atlantic midlatitudes during March (2–3 PVU) and much less in April (1.5 to 2.5 PVU) and May (1–2 PVU). Also during this period there is a strong ridge seen over the central and eastern North Atlantic, due to the positive NAO, which helps to keep the higher PV in the high latitudes, less-ening the chance for STE. The lower PV in the mid-latitudes during April and May also coincides with the stronger in-crease of TOR and its stronger relationship with the NAO (as discussed earlier). Conversely, a cursory analysis of a spring with low ozone and a negative NAO (1980) shows a chance for more active exchange. Thus, given the relatively lower PV at the tropopause during April and May and the fact that this is the period when the TOR-NAO relationship is the strongest, it appears that the greatest contribution of the increased tropospheric ozone over this region and the strong relationship between the TOR over western Europe and the phase of the NAO is tropospheric in nature.
Recent research has attempted to climatologically characterize the seasonal and interannual variability of stratospheric-tropospheric exchange events (James et al, 2003; Sprenger and Wernli, 2003). Sprenger and Wernli (2003) have constructed a 15-year northern hemisphere cli-matology of cross-tropopause exchange for the 1979–1993 time period. This period happens to cover the majority of our studies’ time period (1979–2000). The bulk of the study focuses on the winter and summer time periods, however some generalizations can be drawn between this study and our study. A composite of cyclone frequency during the winter across the North Atlantic (most active cyclone period) shows that there is a strong relationship between the negative phase of the NAO and cyclone frequency; while the composite of the positive phase of the NAO shows fewer events overall across the North Atlantic study area. Similarly strong relationships are seen between the negative NAO and
positive exchange of mass flux due to STE. The study also shows that anticyclones are more closely associated with the positive phase of the NAO. These relationships would strengthen our notion that the increase in tropospheric ozone we are seeing in Region 5 during a positive NAO spring is not a result of relatively more stratospheric ozone invading the troposphere. We understand that these composites of the NAO are constructed during the winter months and our strongest relationship is observed during the spring. However, the cause and effect relationship between the NAO and these two variables (cyclone frequency and mass flux) should be similar whether it’s the winter or spring.
A methodology for identifying STE from TOMS and other satellite measurements was recently described by Wimmers et al. (2003). A natural extension of this work would be to see if the Wimmers et al. (2003) analytical technique could be applied to our region of study to provide some insight into the interannual variability of STE in the North Atlantic.
Our initial findings suggest that a positive NAO Index is not a situation in which STE should be enhanced (in fact, there appears to be an anti-correlation). We believe that this kind of analysis needs to be pursued in considerably more detail but that such a study is beyond the present scope of this paper.
6 Conclusions
Long range transport of anthropogenic pollution has been observed in recent aircraft campaigns, model simulations, and satellite retrievals. The results have shown that pollu-tion coming off the North American continent has the abil-ity, based on the prevailing meteorology, to progress east-ward and impact Europe and points easteast-ward. Utilizing the Tropospheric Ozone Residual (TOR) technique of extracting tropospheric ozone from satellites, the seasonal and regional distribution of tropospheric ozone across the North Atlantic has been investigated. This distribution was then correlated with the North Atlantic Oscillation (NAO) to determine if a relationship exists.
The distribution across the North Atlantic showed strong seasonality, with the spring and summer seasons exhibiting the greatest amounts of tropospheric ozone. The greatest in-crease of tropospheric ozone is seen during the April and May timeframe across this region. A zonal analysis of tro-pospheric ozone across this region showed that the latitude band of greatest tropospheric ozone was in the central midlat-itudes (35–40◦N) and not the upper midlatitudes (40–45◦N), consistent with a strong continental U.S. influence. Analy-ses of the amount of tropospheric ozone determined utilizing this technique and the amount and variability of tropospheric ozone from ozonesonde measurements over the same regions (eastern North America (Region 1) and western Europe (Re-gion 5)) show remarkable consistency and are highly corre-lated.
A strong relationship was discovered between the amount of tropospheric ozone over western Europe and the phase of the NAO. During the spring (March–April–May) from 1979– 2000 over this region, increases in tropospheric ozone over this region were strongly correlated with a positive phase of the NAO with the April–May relationship showing the largest contribution. The positive NAO leads to an increase in the westerly winds across the North Atlantic, thereby aid-ing transport of anthropogenic pollution from North America to Europe.
The impact of North American tropospheric ozone being transported across the North Atlantic could be significant. European ozone standards are stricter than standards set in the United States and this increased ozone could be inhibit-ing the receivinhibit-ing regions from meetinhibit-ing their standards. As countries continue to grow, the significance of the impact on downwind countries from high pollution sources will con-tinue to be a major issue. The ability to forecast the tendency for pollution episodes based on the phase of the NAO would be an important planning tool. Also, future satellite missions with finer resolution coupled with chemical transport models are also going to be important tools in helping to determine the amounts and impact of long-range transport on pollution. Acknowledgements. We thank B. Pierce of NASA Langley
Re-search Center and L. Harvey of the University of Colorado (for-merly of NASA Langley) for their assistance in the potential vor-ticity analysis. We also thank and appreciate the referee comments and recommendations during the Interactive Discussion phase of the ACPD portion of this paper. Collectively, these suggestions re-sulted in an improved article. This work has been supported through NASAs Atmospheric Chemistry, Modeling, and Analysis Program.
References
Aguado, E. and Burt, J. E.: Understanding weather and climate, Prentice Hall, New Jersey, 1999.
Air Quality Research Subcommittee of the Committee on Environ-ment and Natural Resources (CENR), Intercontinental transport of air pollution: Relationship to North American air quality, A review of Federal research and future needs, Washington DC, 2001.
Appenzeller, C., Weiss, A. K., and Staehelin, J.: North Atlantic Oscillation modulates total ozone winter trends, Geophys. Res. Lett., 27, 1131–1134, 2000.
Atherton, C. S., Sillman, S., and Walton, J.: Three-dimensional global modeling of the transport and photochemistry over the North Atlantic Ocean, J. Geophys. Res., 101, 29 289–29 304, 1996.
Berkowtiz, C. M., Daum, P. H., Spicer, C. W., and Busness, K. M.: Synoptic patterns associated with the flux of excess ozone to the western North Atlantic, J. Geophys. Res., 101, 28 923–28 933, 1996.
Braesicke, P., Hadjinicolaou, P., Jrrar, A., and Pyle, J.: Variability of total ozone due to the NAO as represented in two different model simulations, Presented at Chapman Conference, 2000.
Chin, M., Jacob, D. J., Munger, J. W., Parrish, D. D., and Dod-dridge, B. G.: Relationship of ozone and carbon monoxide over North America, J. Geophys. Res., 99, 14 565–14 573, 1994. Cooper, O. R., Moody, J. L., Parrish, D. D., Trainer, M., Holloway,
J. S., H¨ubler, G., Fehsenfeld, F. C., and Stohl, A.: Trace gas com-position of midlatitude cyclones over the western North Atlantic Ocean: A seasonal comparison of O3and CO, J. Geophys. Res.,
107, 10.1029/2001JD000902, 2002.
Eckhardt, S., Stohl, A., Beirle, S., Spichtinger, N., James, P., Forster, C., Junker, C., Wagner, T., Platt, U., and Jennings, S. G.: The North Atlantic Oscillation controls air pollution transport to the Arctic, Atmos. Chem. Phys., 3, 1769–1778, 2003.
Fehsenfeld, F. C., Daum, P., Leaitch, W. R., Trainer, M., Parrish, D. D., and H¨ubler, G.: Transport and processing of O3and O3
precursors over the North Atlantic: An overview of the 1993 North Atlantic Regional Experiment (NARE) summer Intensive, J. Geophys. Res., 101, 28 877–28 891, 1996.
Fishman, J., Ramanathan, V., Crutzen, P. J., and Liu, S. C.: Tropo-spheric ozone and climate, Nature, 282, 818–820, 1979a. Fishman, J., Solomon, S., and Crutzen, P. J.: Observational and
Theoretical Evidence in Support of a Significant In-Situ Photo-chemical Source of Tropospheric Ozone, Tellus, 31, 432–446, 1979b.
Fishman, J., Watson, C. E., Larsen, J. C., and Logan, J. A.: Dis-tribution of tropospheric ozone determined from satellite data, J. Geophys. Res, 95, 3599–3617, 1990.
Fishman, J., Fakhruzzaman, K., Cros, B., and Nganga, D.: Identi-fication of widespread pollution in the southern hemisphere de-duced from satellite analyses, Science, 252, 1693–1696, 1991. Fishman, J., Hoell Jr., J. M., Bendura, R. D., McNeal., R. J.,
and Kirchhoff, V. W. J. H.: NASA GTE TRACE-A experiment (September–October 1992): Overview, J. Geophys. Res., 101, 23 865–23 879, 1996.
Fishman, J. and Balok, A. E.: Calculation of daily tropospheric ozone residuals using TOMS and empirically improved SBUV measurements: Application to an ozone pollution episode over the eastern United States, J. Geophys. Res., 104, 30 319–30 340, 1999.
Fishman, J., Wozniak, A. E., and Creilson, J. K.: Global distribution of tropospheric ozone from satellite measurements using the em-pirically corrected tropospheric ozone residual technique: Iden-tification of the regional aspects of air pollution, Atmos. Chem. Phys., 3, 893–907, 2003.
Gauss, M., Myhre, G., Pitari, G., et al.: Radiative forcing in the 21st century due to ozone changes in the troposphere and lower stratosphere, J. Geophys. Res., 108, D9, 4292, doi:10.1029/2002JD002624, 2003.
Hudson, R. D. and Thompson, A. M.: Tropical tropospheric ozone from total ozone mapping spectrometer by a modified residual method, J. Geophys. Res., 103, 22 129–22 145, 1998.
Hurrell, J. W.: Decadal trends in the North Atlantic Oscillation: Regional temperatures and precipitation, Science, 269, 676–679, 1995.
Hurrell, J. W., Kushnir, Y., Ottersen, G., and Visbeck, M.: The North Atlantic Oscillation climate significance and environmen-tal impact, American Geophysical Union, 2003.
Jaffe, D., Anderson, T. A., Covert, D., Kotchenrutther, R., Trost, B., Danielson, J., Simpson, W., Bernsten, T., Karlsd?ttir, S., Blake, D., Harris, J., Carmichael, G., and Uno, I.: Transport of Asian
air pollution to North America, Geophys. Res. Lett., 26, 711– 714, 1999.
James, P., Stohl, A., Forster, C., Eckhardt, S., Seibert, P., and Frank, A.: A 15-year climatology of stratosphere-troposphere exchange with a Lagrangian particle dispersion model, 2. Mean climate and seasonal variability, J. Geophys. Res., 108(D12), 8522, doi:10.1029/2002JD002639, 2003.
Jonson, J. E., Sundet, J. K., and Tarras´on, L.: Model calculations of present and future levels of ozone and ozone precursors with a global and a regional model, Atmos. Environ., 35, 525–537, 2001.
Kalnay, E., Kanamitsu, M., Kistler, R., et al.: The NCEP/NCAR 40-year reanalysis project, Bull. Amer. Met. Soc., 77, 437–472, 1996.
Kim, J. H. and Newchurch, M. J.: Climatology and trends of tro-pospheric ozone over the eastern Pacific Ocean: The influences of biomass burning and tropospheric dynamics, Geophys. Res. Lett., 23, 3723–3726, 1996.
Kim, J. H. and Newchurch, M. J.: Biomass-burning influence on tropospheric ozone over New Guinea and South America, J. Geo-phys. Res., 103, 1455–1461, 1998.
Li, Q., Jacob, D. J., Bey, I., Palmer, P. I., Duncan, B. N., Field, B. D., Martin, R. V., Fiore, A. M., Yantosca, R. M., Parrish, D. D., Sim-monds, P. G., and Oltmans, S. J.: Transatlantic transport of pollu-tion and its effects on surface ozone in Europe and North Amer-ica, J. Geophys. Res., 107, 4166, doi: 10.129/2001JD001422, 2002a.
Li, Q., Jacob, D. J., Fairlie, T. D., Liu, H., Yantosca, R. M., and Martin, R. V.: Stratospheric versus pollution influences on ozone at Bermuda: Reconciling past analyses, J. Geophys. Res., 107, 4611, doi: 10.1029/2002JD002138, 2002b.
Liang, J., Horowitz, L. W., Jacob, D. J., Wang, Y., Fiore, A. M., Lo-gan, J. A., Gardner, G. M., and Munger, J. W.: Seasonal budgets of reactive nitrogen species and ozone over the United States, and export fluxes to the global atmosphere, J. Geophys. Res., 103, 13 435–13 450, 1998.
Liu, S. C., Trainer, M., Fehsenfeld, F. C., Parrish, D. D., Williams, E. J., Fahey, D. W., H¨ubler, G., and Murphy, P. C.: Ozone pro-duction in the rural troposphere and the implications for regional and global ozone distributions, J. Geophys. Res., 92, 4191–4207, 1987.
Moody, J. L., Oltmans, S. J., Levy II, H., and Merill, J. T.: Trans-port climatology of tropospheric ozone: Bermuda, 1988–1991, J. Geophys. Res., 100, 7179–7194, 1995.
Moulin, C., Lambert, C. E., Dulac, F., and Dayan, U.: Control of atmospheric export of dust from North Africa by the North At-lantic Oscillation, Nature, 387, 691–694, 1997.
Oltmans, S. J.: Surface ozone measurements in clean air, J. Geo-phys. Res., 86, 1174–1180, 1981.
Oltmans, S. J. and Levy II, H.: Seasonal cycle of surface ozone over the western North Atlantic, Nature, 358, 392–394, 1992. Oltmans, S. J. and Levy II, H.: Surface ozone measurements from
a global network, Atmos. Environ., 28, 9–24, 1994.
Oxford Atlas of the World (8th Edition), Oxford University Press, New York, 2000.
Parrish, D. D., Holloway, J. S., Trainer, M., Murphy, P. C., Forbes, G. L., and Fehsenfeld, F. C.: Export of North American ozone pollution to the North Atlantic Ocean, Science, 259, 1436–1439, 1993.
Parrish, D. D., Trainer, M., Holloway, J. S., Yee, J. E., Warshawsky, M. S., Fehsenfeld, F. C., Forbes, G. L., and Moody, J. L.: Rela-tionships between ozone and carbon monoxide at surface sites in the North Atlantic region, J. Geophys. Res., 103, 13 357–13 376, 1998.
Prather, M., Gauss, M., Berntsen, T., et al.: Fresh air in
the 21st century?, Geophys. Res. Lett., 30, 1100, doi: 10.1029/2002GL016285, 2003.
Reeves, C. E., Penkett, S. A., Bauguitte, S., et al.: Potential for pho-tochemical ozone formation in the troposphere over the North Atlantic as derived from aircraft observations during ACSOE, J. Geophys. Res., 107(D23), 4707, doi:10.1029/2002JD002415, 2002.
Rogers, J. C.: North Atlantic storm track variability and its associ-ation to the North Atlantic Oscillassoci-ation and climate variability of northern Europe, J. Clim., 10, 1635–1647, 1997.
Sprenger, M. and Wernli, H.: A northern hemisphere
clima-tology of cross-tropopause exchange for the ERA15 time period (1979–1993), J. Geophys. Res., 108(D12), 8521, doi:10.1029/2002JD002636, 2003.
Stohl, A. and Trickl, T.: A textbook example of long-range trans-port: Simultaneous observation of ozone maxima of strato-spheric and North American origin in the free troposphere over Europe, J. Geophys. Res., 104, 30 445–30 462, 1999.
Stohl, A., Eckhardt, S., Forster, C., James, P., and Spichtinger,
N.: On the pathways and timescales of intercontinental
air pollution transport, J. Geophys. Res., 107(D23), 4684, doi:10.1029/2001JD001396, 2002.
Stohl A., Huntrieser, H., Richter, A., Beirle, S., Cooper, O., Eck-hardt, S., Forster, C., James, P., Spichtinger, N., Wenig, M., Wag-ner, T., Burrows, J., and Platt, U.: Rapid intercontinental air pol-lution transport associated with a meteorological bomb, Atmos. Chem. Phys., 3, 969–985, 2003.
Thompson, A. M., Oltmans, S. J., Schmidlin, F. J., Logan, J. A., Fujiwara, M., Kirchoff, V. W. J. H., Posny, F., Coetzee, G. J. R., Hoegger, B., Kawakami, S., Ogawa, T., Johnson, B. J., V¨omel, H., and Labow, G.: The 1998–2000 SHADOZ (Southern Hemi-sphere Additional Ozonesondes) tropical ozone climatology. 1. Comparison with TOMS and ground-based measurements, J. Geophys. Res., 108, 8238, doi: 10.1029/2001JD000967, 2003. Vaughan, G. and Price, J. D.: On the relation between total ozone
and meteorology, Q. J. R. Meteorol. Soc., 117, 1281–1298, 1991. Visbeck, M. H., Hurrell, J. W., Polvani, L., and Cullen, H. M.: The North Atlantic Oscillation: Past, present, and future, PNAS, 98, 12 876–12 877, 2001.
von Kuhlmann, R., Lawrence, M. C., and Crutzen, P. J.: A model for studies of tropospheric ozone and nonmethane hydrocarbons: Model description and ozone results, J. Geophys. Res., 108, D9, 4294, doi:10.1029/2002JD002893, 2003.
Wang, Y., Jacob, D. J., and Logan, J. A.: Global simulation of tropospheric O3-NOx-hydrocarbon chemistry 3. Origin of
tropo-spheric ozone and effects of nonmethane hydrocarbons, J. Geo-phys. Res., 103, 10 757–10 767, 1998.
Wimmers, A. J., Moody, J. L., Browell, E. V., Hair, J. W., Grant, W. B., Butler, C. F., Fenn, M. A., Schmidt, C. C., Li, J., and Rid-ley, B. A.: Signatures of tropopause folding in satellite imagery, J. Geophys. Res., 108(D4), 8360, doi:10.1029/2001JD001358, 2003.
Ziemke, J. R., Chandra, S., and Bhartia, P. K.: Two new methods for deriving tropospheric column ozone from TOMS measurements: Assimilated UARS MLS/HALOE and convective-cloud differ-ential methods, J. Geophys. Res., 103, 22 115–22 127, 1998. Ziemke, J. R., Chandra, S., and Bhartia, P. K.: A new NASA data
product: Tropospheric and stratospheric column ozone in the tropics derived from TOMS measurements, Bull. Amer. Mete-orol. Soc., 81, 580–583, 2000.