HAL Id: hal-00298214
https://hal.archives-ouvertes.fr/hal-00298214
Submitted on 19 Mar 2008HAL is a multi-disciplinary open access
archive for the deposit and dissemination of sci-entific research documents, whether they are pub-lished or not. The documents may come from teaching and research institutions in France or abroad, or from public or private research centers.
L’archive ouverte pluridisciplinaire HAL, est destinée au dépôt et à la diffusion de documents scientifiques de niveau recherche, publiés ou non, émanant des établissements d’enseignement et de recherche français ou étrangers, des laboratoires publics ou privés.
Provenance changes of eolian dust at Lingtai section in
the Chinese Loess Plateau since 7 Ma and its
implication for desert development in East Asia
Y. Isozaki, R. Tada, Y. Sun, K. Nagashima, H. Zheng, S. Toyoda, A. Tani
To cite this version:
Y. Isozaki, R. Tada, Y. Sun, K. Nagashima, H. Zheng, et al.. Provenance changes of eolian dust at Lingtai section in the Chinese Loess Plateau since 7 Ma and its implication for desert development in East Asia. Climate of the Past Discussions, European Geosciences Union (EGU), 2008, 4 (2), pp.335-374. �hal-00298214�
CPD
4, 335–374, 2008 Provenance changes of eolian dust at Lingtai since 7 Ma Y. Isozaki et al. Title Page Abstract Introduction Conclusions References Tables Figures ◭ ◮ ◭ ◮ Back CloseFull Screen / Esc
Printer-friendly Version Interactive Discussion
Clim. Past Discuss., 4, 335–374, 2008 www.clim-past-discuss.net/4/335/2008/
© Author(s) 2008. This work is distributed under the Creative Commons Attribution 3.0 License.
Climate of the Past Discussions
Climate of the Past Discussions is the access reviewed discussion forum of Climate of the Past
Provenance changes of eolian dust at
Lingtai section in the Chinese Loess
Plateau since 7 Ma and its implication for
desert development in East Asia
Y. Isozaki1, R. Tada1, Y. Sun2, K. Nagashima3, H. Zheng4, S. Toyoda5, and A. Tani6
1
Department of Earth and Planetary Science, University of Tokyo, Tokyo, Japan
2
Institute of Earth Environment, Chinese Academy of Sciences, Xi’an, China
3
Japan Agency for Marine-Earth Science and Technology, Yokosuka, Japan
4
School of Ocean and Earth Science, Tongji University, Shanghai, China
5
Department of Applied Physics, Okayama University of Science, Okayama, Japan
6
Department of Earth and Space Science, Osaka University, Osaka, Japan
Received: 3 January 2008 – Accepted: 11 January 2008 – Published: 19 March 2008 Correspondence to: Y. Isozaki ([email protected])
CPD
4, 335–374, 2008 Provenance changes of eolian dust at Lingtai since 7 Ma Y. Isozaki et al. Title Page Abstract Introduction Conclusions References Tables Figures ◭ ◮ ◭ ◮ Back CloseFull Screen / Esc
Printer-friendly Version Interactive Discussion
Abstract
It is suggested that the uplift of Himalaya-Tibetan Plateau enhanced interior aridity in East Asia and resulted in development of middle latitude gobi and sandy deserts and accumulation of the eolian sediments in the Chinese Loess Plateau. Therefore, estimation of the provenance for eolian sediments in the Chinese Loess Plateau is
5
critical to reconstruct the environmental changes in East Asia and their relation to the Himalaya-Tibetan Plateau uplift.
We recently developed a new provenance tracing method by using a combination of Electron Spin Resonance (ESR) signal intensity and Crystallinity Index (CI) of quartz, and demonstrated that fine fraction of the surface sediments from nine major deserts
10
in East Asia could be distinguished one another on the ESR signal intensity versus CI diagram. Here, we measured ESR signal intensity and CI of quartz in fine fractions of samples covering the last 7 Ma obtained from Lingtai section in the central Chinese Loess Plateau, and compared the results with those of the surface samples from nine major deserts in East Asia.
15
The results suggest that the provenance of fine fraction of the eolian sediment in Lingtai section changed at 4.3, 2.1, 1.4, 1.1, 0.8 and 0.4 Ma. During 7 to 4.3 Ma, the dust might be have been supplied from Precambrian to Paleozoic metamorphic and granitic rocks and granite exposed in the present central to eastern part of the Tian Shan Mountains. The contribution from the Taklimakan desert appeared at 4.3 Ma,
20
increased drastically at 1.1 Ma, and persisted till 0.8 Ma, whereas the main source of detrital material to the Taklimakan desert might have changed from eastern part of the Kunlun and the Altyn Mountains to western part of the Kunlun and the Tian Shan Mountains. During 0.8 to 0.4 Ma, contribution from the Badain Juran desert gradually increased. Finally, contribution from the Tengger desert appeared from 0.4 to 0 Ma.
25
Together with tectonic evidences from literatures, the provenance changes from 4.3 to 0.8 Ma seem to reflect uplift of the Tian Shan and the Kunlun Mountains and conse-quent formation of the Taklimakan desert, whereas the change at 0.4 Ma may reflect
CPD
4, 335–374, 2008 Provenance changes of eolian dust at Lingtai since 7 Ma Y. Isozaki et al. Title Page Abstract Introduction Conclusions References Tables Figures ◭ ◮ ◭ ◮ Back CloseFull Screen / Esc
Printer-friendly Version Interactive Discussion
uplift of the Qilian Mountains although formation of mountain glaciers could be an al-ternative possibility. These provenance changes will provide important constraints not only on the development of arid areas and evolution of monsoon but also on the uplift and erosion of mountains in East Asia.
1 Introduction 5
Arid areas are generally distributed in the low latitude subtropical zone where the down-ward wind motion predominates. However, the arid areas in North China are located in higher latitude, which are considered as due to the physical effect (e.g., cooling and heating of high-elevation surface, diversion of wind, and alteration of precipitation pattern) of the Himalaya-Tibetan Plateau (hereafter HTP) on the climate system
(Rud-10
diman, 1997; An, 2000). Roles of the large-scale mountains such as the HTP, on the regional/global climate have been investigated since 1970’s, and many climate model simulations have been conducted in this regard (e.g., Manabe and Terpstra, 1974; Broccoli and Manabe, 1992; Kutzbach et al., 1993; Abe et al., 2003; Kitoh, 2004). For example, Kitoh (2004) investigated changes in Koeppen-type climate zonation in
re-15
sponse to the changes in heights of mountains of the world, with which he discussed the role of the HTP uplift on the evolution of East Asian climate. He demonstrated that the summer precipitation increases in the southeast China and low-precipitation areas retreat toward the northwest in East Asia with the uplift of the mountains, which results in middle latitude arid areas to the north of the Tibetan Plateau, while low latitude arid
20
areas in East Asia disappear. In these simulations, however, mountains heights are changed uniformly over the entire globe although uplift of the HTP is known not to be uniform (Tapponnier et al., 2001).
An et al. (2001) incorporated more realistic uplift process of the HTP in their model and examined the influence of the uplift on the climate. However, high resolution
topo-25
graphic features of the mountains within and around the HTP (such as the Tian Shan and the Kunlun Mountains) are not resolved in these models because of their coarse
CPD
4, 335–374, 2008 Provenance changes of eolian dust at Lingtai since 7 Ma Y. Isozaki et al. Title Page Abstract Introduction Conclusions References Tables Figures ◭ ◮ ◭ ◮ Back CloseFull Screen / Esc
Printer-friendly Version Interactive Discussion
spatial resolution.
Uplift of the HTP is considered as started around Paleocene or Eocene as a result of Indian and Eurasian plates collision (McKenzie and Sclater, 1971; Patzelt et al., 1996). Influence of the collision was not limited to the HTP but reached to northern Mongolia and Siberia (Tapponnier and Molnar, 1979). It is suggested that uplift was
5
initiated from the southern part of the HTP, and then propagated northward according to the ages of the fault activities based on fission track dating and ages of magmatic activities (Tapponnier et al., 2001; Vassallo et al., 2007). Uplift in central Asia between the Kunlun Mountains and Lake Baikal (e.g. Kunlun, Tian Shan, Qilian, Altyn, Altai, and Hangayn Mountains) is estimated to have initiated during Eocene-Oligocene (Jolivet et
10
al., 2001; Wang et al., 2004) with the first main uplift phase occurred during Middle Miocene at least in the Tian Shan Mountains (Avouac et al., 1993; Bullen et al., 2001; Charreau et al., 2005). It is also considered that the uplift lasted until Pleistocene in the northern Tibetan Plateau (Tapponnier et al., 2001; Arjannikova et al., 2004). However, timing and nature of the uplift of each mountain chain along the northern edge of the
15
Tibetan Plateau and further north are not well constrained.
Many attempts have been made to reconstruct the aridification process in inland Asia using the proxies such as linear accumulation rate (Sun et al., 1998; Ding et al., 1998) and mass accumulation rate of the eolian sediments at the Chinese Loess Plateau (hereafter CLP) (Kohfeld and Harrison, 2003; Sun and An, 2005), and mass
20
accumulation rate of detrital component of the pelagic sediment at ODP sites 885/886 in Northern Pacific (Rea et al., 1998). These proxies are thought to represent aridity and/or extent of windward arid areas. However, there is a possibility that these proxies are also influenced by the transport wind path and wind speed. On the other hand, sev-eral attempts have been made to examine the process of aridification for individual arid
25
areas in East Asia. For example, formation of the Taklimakan desert was discussed based on the onset timing of “Yellow Silt” deposition on the northern foot of the Kunlun Mountains (Zheng et al., 2000, 2003, 2006; Sun and Liu, 2006). Zheng et al. (2003) and Sun and Liu (2006) suggested that “Yellow Silt” is eolian origin supposedly
de-CPD
4, 335–374, 2008 Provenance changes of eolian dust at Lingtai since 7 Ma Y. Isozaki et al. Title Page Abstract Introduction Conclusions References Tables Figures ◭ ◮ ◭ ◮ Back CloseFull Screen / Esc
Printer-friendly Version Interactive Discussion
rived from the Taklimakan desert based on its field occurrence, appearance, as well as similarities in grain size distribution and rare earth element composition with those of loess in the CLP. Based on this interpretation, they argued that the onset of “Yellow Silt” deposition at 5.3 to 4.6 Ma marks the onset of formation of the Taklimakan desert. However, provenance of “Yellow Silt” has never been examined. As to arid areas other
5
than the Taklimakan desert, only a few studies exist (e.g., Xu et al., 2007, for the Teng-ger desert; Sun, 2000, for the Mu Us desert), but their results are not conclusive and the timing and process of formation of other deserts are not well understood.
Thus, uncertainties in the timings and processes of uplift of the mountains as well as aridification and desert formation in East Asia prevents us from examining the possible
10
linkage between uplift of the HTP and aridification and desert formation in East Asia. Eolian dust deposited in the CLP is derived mainly from the arid and semi-arid areas of its windward direction, and its accumulation started approximately at 8 to 7 Ma in the central CLP (Ding et al., 1998a; Sun et al., 1998; Qiang et al., 2001) and around 22 Ma in the western CLP (Guo et al., 2002). Since accumulation of eolian sediment
15
is influenced by the extent of arid areas and the dust-transport wind system, the eolian deposit in the CLP provides an excellent archive to document past variations in the dust-transport wind systems and the aridification history of Asian inland (An, 2000; An et al., 2001; Guo et al., 2002). In order to extract information on the wind systems and aridification history, it is essential to estimate the provenance of eolian dust deposited in
20
the CLP. Based on grain size distribution (Ding et al., 1998b; Sun et al., 2004), strontium and neodymium isotopes (Liu et al., 1994; Gallet et al., 1996; Jahn et al., 2001; Sun, 2005), and the content of rare minerals such as dolomite (Li et al., 2007), previous studies have made a preliminary discussion on the provenance of eolian sediments in the CLP. However, these attempts were of limited success because there are limitations
25
in these proxies. Namely, the grain size of eolian deposit reflects not only the proximity to the source but also the wind speed and path. On the other hand, Sr and Nd isotopes can be influenced by grain size sorting and chemical alternation during weathering and diagenesis, and their measurements are time consuming and expensive (Dasch,
CPD
4, 335–374, 2008 Provenance changes of eolian dust at Lingtai since 7 Ma Y. Isozaki et al. Title Page Abstract Introduction Conclusions References Tables Figures ◭ ◮ ◭ ◮ Back CloseFull Screen / Esc
Printer-friendly Version Interactive Discussion
1969; Asahara et al., 1995; Yang et al., 2001), and the use of rare minerals are limited to specific cases and not always applicable. Thus, provenance of eolian deposit at the CLP is still poorly constrained due to the lack of appropriate proxy. Therefore, it is desirable to develop proxies which are based on the common component of eolian dust, less susceptible to grain size effect, and resistant to chemical alteration during
5
weathering and diagenesis.
In this study, we used two parameters derived from quartz. One is the electron spin resonance signal intensity of theE′
1 center, an unpaired electron at an oxygen
vacancy, of quartz (hereafter ESR signal intensity), which is measured after gamma ray irradiation and heating at 300◦C for 15 min. The ESR signal intensity represents
10
the number of oxygen vacancies in quartz (Toyoda and Ikeya, 1991), which shows a clear positive correlation with the age of the host rock (Toyoda and Hattori., 2000). The other is Crystallinity Index of quartz (hereafter CI), which reflects the condition of its formation such as temperature and speed of crystallization (Murata and Norman, 1976). We focused on quartz because quartz is major component of the eolian dust
15
and its provenance likely represent provenance of the bulk eolian dust. Besides, quartz is resistant to chemical weathering and diagenesis. We also focused on fine fraction of <30 µm, because grain size distribution of quartz in loess and paleosol samples generally show bimodal distributions that are divided approximately at 16 to 30µm (Sun et al., 2006a). The fine fraction is considered as transported for long distance by
20
suspension, while coarse fraction (>30 µm) is considered to be transported for a short distance by saltation and bottom traction (Pye, 1987) and thus represents local source. Recently, Sun et al. (2007) measured the ESR signal intensity and CI of quartz in fine fraction (<16 µm) of surface samples from nine major deserts in East Asia, and demonstrated that these deserts can be clearly distinguished one another on the ESR
25
signal intensity versus CI diagram. Sun et al. (2007) used<16 µm fraction to avoid po-tential contamination of coarser distribution whose distribution tail sometimes extends below 30µm. We compared the ESR signal intensity and CI of <16 µm fraction with <30 µm fraction for 30 selected samples. The result shows that there is no systematic
CPD
4, 335–374, 2008 Provenance changes of eolian dust at Lingtai since 7 Ma Y. Isozaki et al. Title Page Abstract Introduction Conclusions References Tables Figures ◭ ◮ ◭ ◮ Back CloseFull Screen / Esc
Printer-friendly Version Interactive Discussion
difference between <30 micron and <16 micron fractions with respect to ESR signal intensity and CI of quartz. The difference is less than 2.4 with the average of 1.2 for ESR signal intensity and less than 0.4 with average of 0.2 for CI, respectively.
In this paper, we examine the provenance changes of the fine fraction of the eolian deposit at Lingtai section in the CLP using the ESR signal intensity and CI of quartz,
5
and then discuss the implication of the observed provenance changes especially with respect to aridification and tectonic histories in East Asia.
2 Climatological and geological back ground
Arid areas are widely distributed in the windward direction of the CLP. Xuan and Sokolik (2002) compiled a 30 yr (1951–1980) climatological data of 301 meteorological stations
10
in Northern China, and identified three types of dust sources based on the frequency of dust storm occurrence, wind speed, aridity and precipitation, morphology and com-position of surface soil, and dust emission rates. Type 1 are deserts in arid-agricultural areas such as the Mu Us and Hobq deserts, Type 2 are gobi-deserts and deserts located on the plateaus such as the central gobi-desert, gobi-deserts in the Hexi
Cor-15
ridor, the Tengger and the Badain Jaran deserts, and Type 3 are deserts located in topographical lows such as the Taklimakan and Gurbantunggut deserts. Deserts of Type 1 are located in Northeast China, deserts of Type 3 are located in Northwest China, and those of Type 2 are located in north central China between Type 1 and Type 3 deserts. Dust emission rate increases from east to west, and the relative
con-20
tributions of Type 1, 2 and 3 to annual mean dust emission is estimated as 1%, 35%, and 64%, respectively. Moreover, they suggested that the Taklimakan desert (Type 3) is the main eolian dust source with central gobi-desert as the next.
Sun et al. (2001) analyzed meteorological conditions of dust storm events during March to May based on past 40 years (1960–1999) data of 174 meteorological
sta-25
tions. They found that dust storm in China is most frequent in April, and suggested that all of the dust storms in China are associated with cold air outbreaks, which
re-CPD
4, 335–374, 2008 Provenance changes of eolian dust at Lingtai since 7 Ma Y. Isozaki et al. Title Page Abstract Introduction Conclusions References Tables Figures ◭ ◮ ◭ ◮ Back CloseFull Screen / Esc
Printer-friendly Version Interactive Discussion
sult in the occurrence of frontal systems and the Mongolian cyclonic depression. Such dust storms occurred mostly in gobi deserts of Mongolia and North central China, and the Taklimakan desert. However dust entrained from the two sources takes different transport pathways. The dusts generated in gobi desert of Mongolia and North cen-tral China travel across Korea, Japan, and to the Northwestern Pacific Ocean, while
5
most of the dusts generated in the Taklimakan desert cannot move directly eastward across China but first entrained to higher level and then transported to the North Pa-cific through the westerly jet. Moreover, they demonstrated that the CLP is the most common dust fall region. According to Sun et al. (2003), annual mineral flux over the CLP is approximately 170 g/m2at Huanxian in the northern margin of the CLP, 80 g/m2
10
at Xifen in the central part of the CLP, and about 100 g/m2at Liquan and Binxian in the southwest margin of the CLP. In addition, both dust fluxes at Lanzhou in the western CLP and Yuchong in the eastern CLP show the maximum in April and the minimum in October, and the seasonal variations are clearer in the western CLP. The spatial and seasonal variations of the dust flux reflect the distance from source area and seasonal
15
variability of wind intensity (Sun et al., 2003). Namely, the dust flux in spring is influ-enced by the atmospheric condition characterized by the activity of circumpolar vortex disturbances in northern China that create low pressure cells such as Mongolian cy-clone with high frequency (Qian et al., 2002), while the minimum dust flux in autumn is associated with the precipitation and consequent development of ground vegetation
20
that effectively prevent dust emission (Sun et al., 2003).
The eolian sediments in the CLP are composed of the loess-paleosol sequence and the red clay formation (Hipparion Red earth). The loess-paleosol sequence is widely distributed in the CLP and is composed of more than thirty pairs of alternating loess and paleosol beds, which are accumulated under cold-dry and warm-wet climate
con-25
ditions, respectively (Liu, 1985). The red clay formation is composed of reddish clay to silt-sized sediments that lie underneath the loess-paleosol sequence (Ding et al., 1993), and is considered to have been formed under the rather warm and wet condi-tions (Ding et al., 1999). Deposition of loess-paleosol sequence started simultaneously
CPD
4, 335–374, 2008 Provenance changes of eolian dust at Lingtai since 7 Ma Y. Isozaki et al. Title Page Abstract Introduction Conclusions References Tables Figures ◭ ◮ ◭ ◮ Back CloseFull Screen / Esc
Printer-friendly Version Interactive Discussion
at 2.6 Ma (Liu et al., 1985). On the other hand, the onset timing of eolian sediments be-low the loess-paleosol sequence is different from place to place within the CLP. Namely, deposition of the red clay formation in the eastern and central part of the CLP started between 7.0 and 8.3 Ma (Liu et al., 1988; Ding et al., 1998; Sun et al., 1998; Qiang et al., 2001), whereas deposition of the eolian sediments started as early as 22 Ma in the
5
western part of the CLP (Guo et al., 2002).
3 Locality, samples, and age model
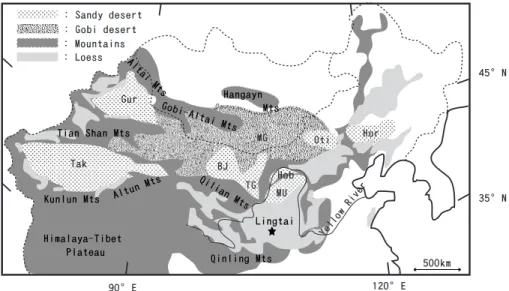
Lingtai section (35◦04′N, 107◦39′E, 1350 m a.s.l.) is located in the central CLP (Fig. 1). Today, the annual mean temperature at Lingtai is 8.8◦C and annual mean precipita-tion is 650 mm, and the locality belongs to temperate steppe forest zone (Sun and
10
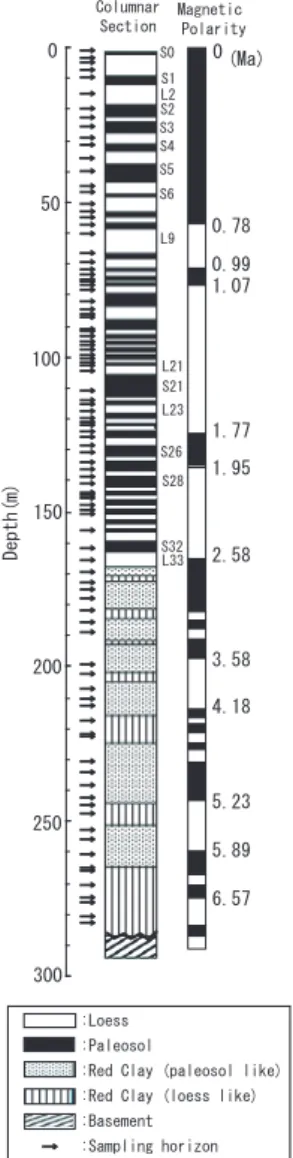
Wang, 2005). Eolian sequences at this site consist of a 166 m thick loess-paleosol sequence and an overlying 120 m thick red clay formation, which were accumulated almost continuously over the last 7.2 Ma (Sun et al., 1998). Detailed descriptions of pedostratigraphy (Sun et al., 1998a; Ding et al., 1999), grain size distribution and mag-netic susceptibility (Ding et al., 1998; Sun et al., 1998), and mean grain size and flux of
15
quartz (Sun and An 2005; Sun et al., 2006a) were already documented for the Lingtai section.
We analyzed 101 eolian sediment samples, including 35 loess, 33 paleosol, and 33 red clay samples, of which sampling positions are shown in Fig. 2. These samples are the same samples as those used by Sun et al. (2005, 2006a, b), whose detailed
20
sampling method is described in Sun et al. (2006b). The samples were selected from every loess and paleosol units except for the uppermostL1 layer, from which we
se-lected three samples fromL1SS1, L1LL1 and L1LL2. We selected red clay samples
with every 4 m intervals that correspond to approximately 120 kilo year intervals. The age model between 7.0 and 3.6 Ma was developed by linear interpolation
be-25
tween 15 datum levels which were derived from the ages of paleomagnetic polarity boundaries (Sun et al., 1998). Age model after 3.6 Ma was adopted from an
astronom-CPD
4, 335–374, 2008 Provenance changes of eolian dust at Lingtai since 7 Ma Y. Isozaki et al. Title Page Abstract Introduction Conclusions References Tables Figures ◭ ◮ ◭ ◮ Back CloseFull Screen / Esc
Printer-friendly Version Interactive Discussion
ical timescale that was generated by tuning median grain size of quartz (proxy of winter monsoon intensity) to the orbital obliquity and precession cycles (Sun et al., 2006b).
4 Analytical methods
4.1 Sample preparation
Prior to the analysis of ESR signal intensity ofE′
1center in quartz, samples were
pre-5
treated to remove organic matter, carbonate, and Fe and Mn oxides using the following method modified from Rea and Jackson (1981). First, 50 ml of 20% CH3COOH was
added to 150 mg of samples to remove carbonate, and it was kept 8 h at room tem-perature with mixing. Next, the sample was heated at 80◦C with 40 ml Na3C6H5O7 (0.3 mol/l), 5 ml NaHCO3(1 mol/l), and 3 g of Na2S2O4 for about 8 h to remove Fe and
10
Mg oxides. Finally, the sample was heated at 60◦C with 50 ml of 20% H2O2for 4 to 8 h,
until bubbling stopped so as to remove organic matter. After every step, sample was washed with distilled water and centrifuged twice. After these chemical pretreatment, the coarse fraction (>30 µm) was removed from the sample by the pipette method based on Stokes’ law (Krumbein and Pettijohn, 1938), and the residue was dried at
15
50◦C in an oven.
4.2 ESR signal intensity of quartz
We used ESR signal intensity of quartz as one of the provenance proxies of eolian dust (Ono et al., 1998; Toyoda and Naruse, 2002). Prior to the ESR signal intensity analysis, samples were irradiated with gamma-ray, to a total dose of 2.5 kGy using a
20
60
Co source at Industrial Research, Osaka University. Samples were then heated at 300◦C for 15 min to convert the oxygen vacancies to theE′
1centers (Toyoda and Ikeya,
1991). ESR signal intensity measurements were conducted at room temperature with an X-band ESR spectrometer (JEOL, PX-2300) at the Okayama University of Science
CPD
4, 335–374, 2008 Provenance changes of eolian dust at Lingtai since 7 Ma Y. Isozaki et al. Title Page Abstract Introduction Conclusions References Tables Figures ◭ ◮ ◭ ◮ Back CloseFull Screen / Esc
Printer-friendly Version Interactive Discussion
with 0.01 mW of microwave power, 0.1 mT magnetic field modulation (100 kHz), 5 mT scan range, 2 min scan time, and 0.03 s time constant (Nagashima, 2007; Sun et al., 2007). The ESR signal intensity of the sample was normalized by quartz content to calculate the ESR signal intensity of pure quartz. ESR signal intensity was expressed in spin units, where one spin unit is equivalent to 1.3×10¹⁵spins/g (Toyoda and Naruse,
5
2002). Reproducibility of ESR signal intensity measurement was better than ±0.9 spin units.
4.3 Estimation of quartz content
It is necessary to estimate the quartz content of samples in order to obtain ESR signal intensity of pure quartz. Thus, the samples were subject to quartz content analysis
10
based on internal standard method (Klug and Alexander, 1974) using the MAC Sci-ence MXP-3 X-ray diffractometer under the tube voltage of 40 kV and the tube current of 20 mA. The scanned interval was 20 to 40◦2θ, the scanning speed was 1◦2θ/min,
and the sampling step was 0.02◦2θ (Nagashima et al., 2007; Sun et al., 2007). Sili-con powder was used as an internal standard, which was added to the sample, mixed
15
and ground. Then, the sample was stuffed in a glass holder and subject to the mea-surement. The measurement was repeated three times for each sample. The second highest peak, d (100) peak of quartz at 20.8◦2θ was used to quantify quartz content
because the main peakd (101) of quartz at 26.6◦2θ overlaps with the peak of illite at
26.7◦2θ. The effect of quartz crystallinity on the peak height of quartz was also taken 20
into account when estimating the quartz content by assuming linear decrease in peak height with the decrease in CI (Nagashima et al., 2007).
4.4 Crystallinity Index of quartz
We used CI of quartz as the other provenance proxy. CI of quartz was measured with a MAC Science MXP-3 X-ray diffractometer with scanned interval of 66 to 69◦2θ,
25
CPD
4, 335–374, 2008 Provenance changes of eolian dust at Lingtai since 7 Ma Y. Isozaki et al. Title Page Abstract Introduction Conclusions References Tables Figures ◭ ◮ ◭ ◮ Back CloseFull Screen / Esc
Printer-friendly Version Interactive Discussion
Sun et al., 2007). The measurement was repeated three times for each sample. In this study, we calculated CI from the degree of resolution of thed (212) reflection of quartz at 1.382 A◦on the XRD profile based on the definition by Murata and Norman (1976); CI = 10aF/b,
wherea is a depth of trough between 67.74◦ and 68.14◦2θ, b is the peak height at
5
67.74◦2θ from base line at 67◦2θ, and F is a scaling factor introduced to adjust the CI
of automorphic quartz to 10 and was set at 1.32 in this study, using clear automorphic quartz of an industrial standard sample (20–28 mesh granular quartz; Wako Co., Ltd.) as the reference sample. Reproducibility of the CI for five repeated XRD measurements was better than ±0.06.
10
5 Analytical results
5.1 ESR signal intensity of quartz
The ESR signal intensity of quartz in the fine fraction (<30 µm) of the samples from the CLP ranges between 3.5 and 19.3 with the average of 12.3 and standard deviation of 3.5, and shows million year (hereafter m.y.) scale variations (Fig. 3a). The ESR
15
signal intensity of quartz gradually decreased from 19 at 7.0 Ma to 13 at 5.0 Ma, then rapidly increased to 17 toward 4.7 Ma, decreased again from 17 to 11 with m.y.-scale fluctuations toward 2.3 Ma, gradually increased from 11 to 15 with high-frequency vari-ations during 2.3 to 1.4 Ma, and decreased rapidly to 11 toward 0.8 Ma. Then the value rapidly increased from 3 to 11 at 0.8 Ma, decreased to 6 toward 0.4 Ma, and increased
20
again to 11 after 0.4 Ma.
In addition, 100 kilo year (hereafter k.y.) scale variations of the ESR signal intensity are obvious during the last 2.6 m.y. when sample resolution is high. The ESR signal intensity shows larger values in the loess layers compared to the adjacent paleosol layers during 2.3 to 2.1 Ma and 1.7 to 1.4 Ma, larger values in paleosol layers compared
CPD
4, 335–374, 2008 Provenance changes of eolian dust at Lingtai since 7 Ma Y. Isozaki et al. Title Page Abstract Introduction Conclusions References Tables Figures ◭ ◮ ◭ ◮ Back CloseFull Screen / Esc
Printer-friendly Version Interactive Discussion
to the adjacent loess layers during 2.1 to 1.7 Ma, and no significant difference during 1.4 to 0 Ma. The differences in ESR signal intensity of quartz between the adjacent loess and paleosol layers are large (around 5) during 2.3 to 1.4 Ma, while the differences are small (around 1) during 2.6 to 2.3 Ma and after 1.4 Ma.
5.2 Crystallinity index of quartz
5
The CI of quartz in fine fraction (<30 µm) of samples from the CLP ranges between 8.1 and 10.1 with the average of 9.0 and standard deviation of 0.96 (Fig. 3b), and shows m.y.-scale variations. During 7.0 to 4.3 Ma, the CI of quartz shows relatively stable values between 9 and 9.5, with one exception of sample at 7.0 Ma showing a large value of 10. During 4.3 to 2.1 Ma, the CI shows relatively high average of 9.3
10
with larger 100 k.y.-scale fluctuations between 8.4 and 9.9, whereas it shows moderate average value of 9 with smaller variations between 8.6 and 9.2 during 2.1 to 1.4 Ma. During 1.4 to 0.8 Ma, the CI shows larger fluctuation again with moderate average value of 9, then decreased rapidly from 9.2 at 0.8 Ma to 8.1 at 0.7 Ma, then the value increased to 11.0 toward present.
15
As to 100 k.y.-scale variation, the differences in CI of quartz between the adjacent loess and paleosol layers are large but not systematic during 2.6 to 2.1 Ma and 1.4 to 0.7 Ma, while the differences are small during the other periods.
5.3 ESR signal intensity versus CI diagram
In order to estimate the provenance of quartz in fine fraction of the samples from the
20
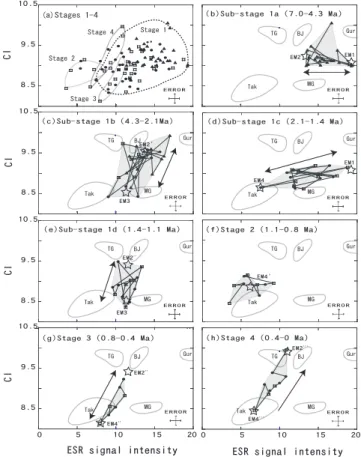
CLP and examine its temporal changes, we plotted our data on the ESR signal inten-sity versus CI diagram. Data plotted in different areas on this diagram suggest the difference in their provenance. We identified the time boundaries when the shifts in the plotted area occur on the diagram, which was defined as the stage boundaries.
Fine fractions of the samples analyzed in this study are plotted in four discrete areas
25
CPD
4, 335–374, 2008 Provenance changes of eolian dust at Lingtai since 7 Ma Y. Isozaki et al. Title Page Abstract Introduction Conclusions References Tables Figures ◭ ◮ ◭ ◮ Back CloseFull Screen / Esc
Printer-friendly Version Interactive Discussion
intervals named stages 1 to 4 (Fig. 4a). 5.3.1 Stage 1
The period from 7.0 to 1.1 Ma is defined as stage 1. The ESR signal intensity of the samples in stage 1 ranges between 7.5 and 19.3 with the average of 13.6 and standard deviation of 2.4, and the CI ranges between 10.1 and 8.1 with the average of 9.1 and
5
standard deviation of 0.3. The data plots of stage 1 show large scatter on the diagram, but they show overall decreasing trend both for the ESR signal intensity and the CI from 7.0 to 1.1 Ma. We divided stage 1 into four sub-stages from 1a to 1d based on the m.y.-scale changes and 100 k.y.-scale variation trends on of the ESR signal intensity versus CI diagram.
10
(1) Sub-stage 1a: The period from 7.0 to 4.3 Ma is defined as sub-stage 1a that is characterized by the high ESR signal intensity between 13.4 and 19.3 with the average of 15.8 and standard deviation of 1.8 and the moderate to high CI between 9.0 and 10.1 with the average of 9.2 and standard deviation of 0.2. Samples show higher frequency variation with negatively-correlated trend between the ESR signal intensity and the
15
CI with larger amplitude variation in the ESR signal intensity. Samples of sub-stage 1a can be regarded as plotted between 2 “end member” points on the ESR signal intensity versus CI diagram except for one sample at 7.0 Ma. Those points are approximately at (ESR signal intensity, CI) = (19, 9.1) and (13, 9.4), which we tentatively named end member 1 (hereafter EM 1) and end member 2 (hereafter EM 2), respectively (Fig. 4b).
20
(2) Sub-stage 1b: The period from 4.3 to 2.1 Ma is defined as sub-stage 1b that is characterized by relatively wide range of the ESR signal intensity between 9.0 and 16.9 with the average of 13.2 and standard deviation of 1.9 and wide range of the CI between 8.4 and 9.9 with the average of 9.2 and standard deviation of 0.4. Samples shows positively-correlated trend between the ESR signal intensity and the CI with
25
larger amplitude variation in the CI. Samples of sub-stage 1b are regarded as plotted between 2 “end member” points on the ESR signal intensity versus CI diagram. One is approximately at (14, 9.8) that is close from EM 2, therefore we tentatively named
CPD
4, 335–374, 2008 Provenance changes of eolian dust at Lingtai since 7 Ma Y. Isozaki et al. Title Page Abstract Introduction Conclusions References Tables Figures ◭ ◮ ◭ ◮ Back CloseFull Screen / Esc
Printer-friendly Version Interactive Discussion
end member 2′ (hereafter EM 2′). The other is approximately at (11, 8.6), which we tentatively named end member 3 (hereafter EM 3) (Fig. 4c).
(3) Sub-stage 1c: The period from 2.1 to 1.4 Ma is defined as sub-stage 1c that is characterized by wide range of ESR signal intensity between 7.5 and 18.8 with the average of 13.5 and standard deviation of 2.7 and narrow and low range of CI between
5
8.6 and 9.2 with the average of 8.9 and standard deviation of 0.2. Samples shows positively-correlated trend between the ESR signal intensity and the CI with larger vari-ation in the ESR signal intensity. Samples of sub-stage 1c are regarded as plotted between 2 “end member” points on the ESR signal intensity versus CI diagram. One is corresponding to EM 1 described above and the other is approximately at (7, 8.6),
10
which we tentatively named end member 4 (hereafter EM 4) (Fig. 4d).
(4) Sub-stage 1d: The period from 1.4 to 1.1 Ma is defined as sub-stage 1d that is characterized by moderate ESR signal intensity between 9.6 and 13.4 with the aver-age of 11.4 and standard deviation of 1.2 and low to moderate CI between 8.4 and 9.5 with the average of 8.9 and standard deviation of 0.3. Samples shows
positively-15
correlated trend between the ESR signal intensity and the CI with larger variation in the CI. Samples of sub-stage 1d are regarded as plotted between 2 “end member” points on the ESR signal intensity versus CI diagram. One is corresponding to EM 3 described above and the other is approximately at (12, 9.5), which is close from EM 2. Therefore we tentatively named it end member 2′′(hereafter EM 2′′) (Fig. 4e).
20
5.3.2 Stage 2
The period from 1.1 to 0.8 Ma is defined as stage 2 because samples of stage 2 are plotted in the area completely different from the area of stage 1 on the ESR signal intensity versus CI diagram. The ESR signal intensity of samples ranges between 3.5 and 9.2 with the average of 6.2 and standard deviation of 1.9, and the CI ranges
25
between 8.4 and 9.1 with the average of 8.9 and standard deviation of 0.2. Samples of stage 2 are plotted in a relatively small area around (6, 8.8) compared to those of sub-stages 1a–d, which is close from EM 4. Therefore we tentatively named it end
CPD
4, 335–374, 2008 Provenance changes of eolian dust at Lingtai since 7 Ma Y. Isozaki et al. Title Page Abstract Introduction Conclusions References Tables Figures ◭ ◮ ◭ ◮ Back CloseFull Screen / Esc
Printer-friendly Version Interactive Discussion
member 4′(hereafter EM 4′) (Fig. 4f). 5.3.3 Stage 3
The period from 0.8 to 0.4 Ma is defined as Stage 3 because samples of stage 3 are plotted in the area completely different from that of stage 2 on the ESR signal intensity versus CI diagram. The ESR signal intensity of samples ranges between 8.0 and 11.2
5
with the average of 9.9 and standard deviation of 1.2, and the CI ranges between 8.1 and 9.2 with the average of 8.7 and standard deviation of 0.4. Samples of stage 3 are plotted along a linear trend between 2 “end member” points on the ESR signal intensity versus CI diagram. Those points are approximately at (11, 9.3) and (8, 8.1), which we tentatively named end member 2′′′ (hereafter EM 2′′′) and end member 4′′(hereafter
10
EM 4′′) because they are close from EM 2 and EM 4, respectively. These plots show larger variation in the CI and smaller variation in the ESR signal intensity compared to stage 2 (Fig. 4g).
5.3.4 Stage 4
The period from 0.4 to 0 Ma is defined as stage 4, because samples of stage 4 are
15
plotted in the area completely different from that of stage 3 on the ESR signal intensity versus CI diagram. The ESR signal intensity of samples ranges between 6.8 and 10.9 with the average of 9.2 and standard deviation of 1.3, and the CI ranges between 8.5 and 10 with the average of 9.1 and standard deviation of 0.4. Samples of stage 4 are plotted along a linear trend between (11, 10) and (7, 8.5), which we named end
20
member 2′′′′(hereafter EM 2′′′′) and end member 4′′′(hereafter EM 4′′′), because they are close from EM 2 and EM 4, respectively. These plots show larger variation in the CI and smaller variation in the ESR signal intensity similar to stage 3 (Fig. 4h).
CPD
4, 335–374, 2008 Provenance changes of eolian dust at Lingtai since 7 Ma Y. Isozaki et al. Title Page Abstract Introduction Conclusions References Tables Figures ◭ ◮ ◭ ◮ Back CloseFull Screen / Esc
Printer-friendly Version Interactive Discussion
6 Discussion
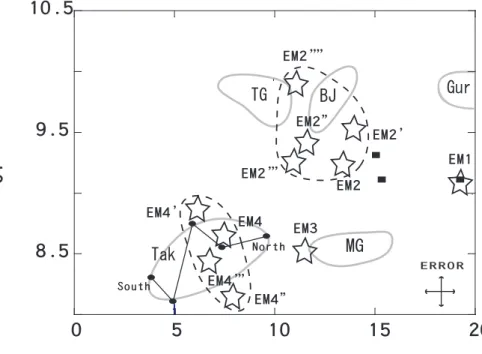
According to the seven stage plus sub-stage divisions defined above, we first examined potential sources represented by the four “end members” (Fig. 5), then discussed the provenance changes of quartz in fine fractions of eolian sediments at Lingtai section during the last 7 Ma.
5
6.1 Potential sources of end menbers 6.1.1 EM 1
EM 1 is characterized by high ESR signal intensity of apporoximately 19 and moderate CI of apporoximately 9.1, which suggests that potential source of EM 1 is Precambrian to early Paleozoic volcanic or metamorphic rocks which are expected to have high
10
ESR signal intensity and moderate CI, or younger sedimentary rocks derived from these source rocks. Comparisons of the ESR signal intensity and the CI of EM 1 with those of the surface samples from East Asian deserts (Sun et al., 2007) revealed that EM 1 is plotted between the areas corresponding to the Gurbantunggut desert and the Mongolia-Gobi desert on the ESR signal intensity versus CI diagram.
15
The Gurbantunggut desert is a sand desert located in the Jungger Basin. The de-trital material of the Gurbantunggut desert is considered to have been supplied from the surrounding the Altai and the Tian Shan Mountains based on the comparison of the mineral composition of detrital materials from sand dune and underlying paleo-terrace deposit, alluvial deposit, paleo lake deposit, and river sand in the Jungger
20
Basin (Qian et al., 2003). Early Paleozoic volcanic rocks and late Paleozoic granitic rocks are dominantly exposed on the southern slope of the Altai Mountains, whereas Precambrian metamorphic rocks and late Paleozoic granitic, pyroclastic, and sedimen-tary rocks are exposed on the northern slope of the Tian Shan Mountains (China Ge-ological Academy, 1980). These lithologies and ages are in general agreement with
25
CPD
4, 335–374, 2008 Provenance changes of eolian dust at Lingtai since 7 Ma Y. Isozaki et al. Title Page Abstract Introduction Conclusions References Tables Figures ◭ ◮ ◭ ◮ Back CloseFull Screen / Esc
Printer-friendly Version Interactive Discussion
the samples from the Gurbantunggut desert.
Detrital materials of the Mongolia-Gobi desert are considered to have been supplied by erosion of the Cretaceous terrestrial sedimentary rocks (Teraoka and Okumura, 2003) that are exposed on the hills within the desert. Potential sources of these Cre-taceous terrestrial sedimentary rocks are Precambrian marine sedimentary rocks in
5
the Gobi-Altai and Hangayn Mountains (Teraoka and Okumura, 2003) which would have high ESR signal intensity and low CI similar to those characterizing the Mongolia-Gobi desert. Late Paleozoic granitic, volcanic, and sedimentary rocks that form the basement of the Mongolian-Gobi desert (China Geological Academy, 1980; Teraoka and Okumura, 2003) is another potential source of Cretaceous terrestrial
sedimen-10
tary rocks. However, these lithologies and ages are not necessary conformable with the relatively high ESR signal intensity and low CI characterizing the Mongolia-Gobi desert.
It is worth to note that the ESR signal intensity and CI of fine fraction of the river sed-iment discharged to Taklimakan desert from the central part of the Tian Shan
Moun-15
tains, where Precambrian to early Paleozoic metamorphic rocks are widely exposed, coincide with those of EM 1 (Isozaki et al., unpublished data) (Fig. 5). Distribution of Precambrian metamorphic and sedimentary rocks in the central part of the Tian Shan Mountains extends eastward to the southern slope of the Altai and the Gobi-Altai Mountains.
20
These observations strongly suggest that EM 1 represent detrital materials derived from the Precambrian sedimentary and metamorphic rocks, and early Paleozoic vol-canic rocks exposed in the area extending from the central part of the Tian Shan Moun-tains to the southern slope of the Altai, and the Gobi-Altai MounMoun-tains.
6.1.2 EM 2 to 2′′′
25
EM 2, 2′, 2′′, 2′′′ and 2′′′′ (hereafter EM 2 group) are close one another on the ESR signal intensity versus CI diagram and characterized by moderate ESR signal intensity of 11 to 15 and high CI of 9.4 to 9.6, which suggests that potential sources of EM 2
CPD
4, 335–374, 2008 Provenance changes of eolian dust at Lingtai since 7 Ma Y. Isozaki et al. Title Page Abstract Introduction Conclusions References Tables Figures ◭ ◮ ◭ ◮ Back CloseFull Screen / Esc
Printer-friendly Version Interactive Discussion
group are Paleozoic plutonic rocks that have moderate ESR signal intensity and high CI or younger sedimentary rocks derived from these source rocks. Comparisons of the ESR signal intensity and the CI of EM 2 group with those of the surface samples from East Asian deserts (Sun et al., 2007) revealed that the EM 2 group are plotted around the areas corresponding to the Badain Juran and the Tengger deserts. So, we consider
5
EM 2 group reflect basically the same source that supplied detrital materials to these two deserts.
The Badain Juran and the Tengger deserts are sand deserts separated by the boundary mountains. They are bounded by the Qilian Mountains to the south. It is sug-gested that alluvial fans developed along the Hexi Corridor and the Qilian Mountains
10
supplied detrital materials to the Badain Juran and the Tengger deserts (Derbyshire et al., 1998). Eastern part of the Qilian Mountains is composed of early Paleozoic volcanic and sedimentary rocks and Mesozoic terrestrial sedimentary rocks, whereas western part of the Qilian Mountains is composed of early Paleozoic volcanic and sed-imentary rocks and Precambrian metamorphic rocks and late Paleozoic granitic rocks
15
(China Geological Academy, 1980). Moreover, late Paleozoic granitic rocks are ex-posed in the southern margin of the Badain Juran desert on the foot of the western part of the Qilian Mountains and the boundary mountains between the Badain Juran and the Tengger deserts (China Geological Academy, 1980). Dominance of late Paleo-zoic granitic rocks on the southern margin of the Badain Juran desert, in the boundary
20
mountain, and in the western part of the Qilian Mountains with additional contribution from early Paleozoic volcanic rocks in the Qilian Mountains is conformable with the idea that EM 2 group represents detrital materials derived from these sources.
6.1.3 EM 3
EM 3 is characterized by moderate ESR signal intensity of 11 and low CI of 8.6, which
25
suggests that potential sources of EM 3 is Paleozoic low-grade metamorphic rocks that have moderate ESR signal intensity and low CI, or younger sedimentary rocks derived from these source rocks. Comparisons of the ESR signal intensity and the CI of EM 3
CPD
4, 335–374, 2008 Provenance changes of eolian dust at Lingtai since 7 Ma Y. Isozaki et al. Title Page Abstract Introduction Conclusions References Tables Figures ◭ ◮ ◭ ◮ Back CloseFull Screen / Esc
Printer-friendly Version Interactive Discussion
with those of the surface samples from East Asian deserts (Sun et al., 2007) revealed that EM 3 is plotted between the areas corresponding to the Mongolia-Gobi desert and the Taklimakan desert.
The Taklimakan desert is a sand desert formed in the Tarim Basin and is surrounded by the Tian Shan, the Kunlun, and the Altyn Mountains that deliver detrital materials to
5
this basin (Sun et al., 2007). Moreover, according to Sun et al. (2007), the ESR sig-nal intensities of the present Taklimakan desert samples gradually increase northward from 3.8 to 9.6, and the CIs also tend to be higher in northern samples. The central to eastern part of the Tian Shan Mountains consists mainly of late Paleozoic granitic and volcanic rocks and Precambrian metamorphic rocks (China Geological Academy,
10
1980). These lithologies and ages are conformable with the moderate ESR signal in-tensity and the moderate CI characterizing the present northern Taklimakan desert. Whereas the central to eastern part of the Kunlun and the Altyn Mountains consist of Precambrian to early Paleozoic metamorphic rocks and late Paleozoic granitic, meta-morphic, volcanic, and sedimentary rocks (China Geological Academy, 1980), which
15
are not necessarily conformable with the low ESR intensity and the low CI character-izing the present southern Taklimakan desert. However, it is worth to note that the ESR signal intensity and CI of the fine fractions of the river sediments discharged from the Tashkorgan Valley in the westernmost part of the Kunlun Mountains (Isozaki et al., unpublished data) show the extremely low ESR signal intensity of around 5 to 1 and
20
the moderate CI of around 9 to 9.5. Cenozoic granitic rocks and Paleozoic metasedi-mentary rocks are exposed in the Tashkorgan Valley (Robinson et al., 2007) and these lithologies and ages are conformable with the relatively low ESR signal intensity and the high CI that characterizes the river sediments of the Tashkorgan Valley. Those ev-idences suggest that the northern area of the present Taklimakan desert is influenced
25
by detrital materials from the southern slope of the Tian Shan Mountains and southern area is influenced by detrital materials from the western part of the Kunlun Mountains. These evidence also suggest that detrital materials from the Tian Shan Mountains and western part of the Kunlun Mountains do not seem to correspond to EM 3. It is possible
CPD
4, 335–374, 2008 Provenance changes of eolian dust at Lingtai since 7 Ma Y. Isozaki et al. Title Page Abstract Introduction Conclusions References Tables Figures ◭ ◮ ◭ ◮ Back CloseFull Screen / Esc
Printer-friendly Version Interactive Discussion
that EM 3 represents detrital materials from the central to eastern part of the Kunlun and the Altyn Mountains considering that Precambrian to early Paleozoic metamorphic rocks are widely exposed in these area. However, we do not have supporting evidence of this interpretation yet.
On the other hand, it is also possible that EM 3 is influenced by the Mongolia-Gobi
5
desert, because EM 3 is plotted near the area corresponding to the Mongolia-Gobi desert. However, Paleozoic metamorphic and/or sedimentary rocks, which are pected to be characterized by moderate ESR signal intensity and low CI, are not ex-posed in the Mongolia-Gobi desert. Moreover, this possibility is less likely because short time scale trends neither during sub-stage 1c nor 1d shows the mixing trend
10
between the Taklimakan desert and the Mongolia-Gobi desert.
Therefore, it is likely that EM 3 represents the Taklimakan desert with possible large contribution from the central to eastern part of the Kunlun and the Altyn Mountains al-though we currently does not have direct supporting data such as ESR signal intensity and CI of river sediments of these areas.
15
6.1.4 EM 4 to EM 4′′′
EM 4, 4′, 4′′, and 4′′′ (hereafter EM 4 group) are close to one another on the ESR signal intensity versus CI diagram, and characterized by low ESR signal intensity of 6 to 10 and low CI of 8.1 to 8.8, which suggests that potential sources of EM 4 group are late Paleozoic to Mesozoic low-grade metamorphic rocks which have low ESR signal
20
intensity and low CI, or younger sedimentary rocks derived from these source rocks. Comparisons of the ESR signal intensity and the CI of EM 4 group with those of the surface samples from East Asian deserts (Sun et al., 2007) revealed that EM 4 group are plotted in and around the area corresponding to the Taklimakan desert. So, we consider EM 4 group basically represents the Taklimakan desert. Compared to EM 3,
25
which we consider as representing detrital materials from the central to eastern part of the Kunlun and the Altyn Mountains, EM 4 group show lower ESR signal intensity that probably reflect stronger influence of the detrital materials from the westernmost part of
CPD
4, 335–374, 2008 Provenance changes of eolian dust at Lingtai since 7 Ma Y. Isozaki et al. Title Page Abstract Introduction Conclusions References Tables Figures ◭ ◮ ◭ ◮ Back CloseFull Screen / Esc
Printer-friendly Version Interactive Discussion
the Kunlun Mountains where Cenozoic granitic rocks and Paleozoic metasedimentary rocks are exposed and could also are influenced by the westernmost part of the Tian Shan Mountains where late Paleozoic volcanic and sedimentary rocks, Mesozoic sedi-mentary rocks, and early Paleozoic metamorphic rocks are exposed (China Geological Academy, 1980). Thus, it is suggested that EM 4 group represents detrital materials
5
from the western side of the Taklimakan desert. 6.2 Possible causes of provenance changes 6.2.1 Sub-stage 1a
During 7 to 4.3 Ma, the main sources of eolian dusts to the CLP are EM 1 and EM 2, the former is considered as representing detrital materials derived from the area
rang-10
ing from the eastern part of the Tian Shan Mountains to the southern slope of the Altai, and the Gobi-Altai Mountains, whereas the latter is considered as representing detrital materials from the Qilian Mountains and the Hexi Corridor. According to previous stud-ies, cooling of the basement rocks in the Altai Mountains occured since approximately 5 Ma based on apatite fission track analysis and thermal history modeling (Grave et al.,
15
2007), and also there was tectonic activity in the Gobi-Altai Mountains approximately at 5±3 Ma based on apatite fission track analysis (Vassallo et al., 2007). Whereas, the northeast Tibetan Plateau including the Qilian Mountains experienced accelerated deformation and uplift during this period based on apatite fission-track data (Zheng et al., 2006). Above evidences imply eolian dust to the CLP during this period could
20
have been derived from the area covering the central to eastern part of the Tian Shan, southern slope of the Altai, and the Gobi-Altai Mountains and the northeastern part of the Qilian Mountains where tectonic activity was active during the same period.
CPD
4, 335–374, 2008 Provenance changes of eolian dust at Lingtai since 7 Ma Y. Isozaki et al. Title Page Abstract Introduction Conclusions References Tables Figures ◭ ◮ ◭ ◮ Back CloseFull Screen / Esc
Printer-friendly Version Interactive Discussion
6.2.2 Sub-stage 1b
Appearance of EM 3, which is considered as representing detrital materials from the central to eastern part of the Kunlun and the Altyn Mountains to the southeastern Taklimakan desert, and disappearance of EM 1, which is considered as representing the central part of the Tian Shan Mountains to the southern slope of the Altai, and the
5
Gobi-Altai Mountains, occurred approximately at the boundary between sub-stages 1a and 1b. This suggests that contribution of the Taklimakan desert started whereas contribution from the central part of the Tian Shan Mountains to the southern slope of the Altai, and the Gobi-Altai Mountains stopped at 4.3 Ma.
According to previous studies, there was tectonic activity in the Kunlun Mountains
10
approximately from 5 to 3.6 Ma (Tapponnier et al., 2001), which might have enhanced erosion and supply of detrital materials to the Taklimakan desert. In fact, deposition of conglomerate started at 4.6 Ma and became significant since 3.5 Ma in the south-ern margin of the Tarim Basin, which is interpreted as representing uplift of the Kun-lun Mountains and the development of alluvial fans (Zheng et al., 2000, 2003, 2006).
15
These evidences suggest that supply of the detrital materials from the Kunlun Moun-tains to the Tarim Basin increased at the beginning of sub-stage 1b. In addition, wind-blown yellow silt accumulation started in the southern margin of the Tarim Basin around 5.3 to 4.5 Ma (Zheng et al., 2003; Sun and Liu, 2006), which suggests frequent occur-rence of dust storms in the Tarim Basin and is conformable with the idea of increasing
20
supply of eolian dust from the Taklimakan desert to the CLP during sub-stage 1b. On the other hand, the Altyn Tagh fault reached close to its present position by approx-imately 4 Ma and this activity influenced tectonics on the southeastern edge of the Tarim Basin (Wang et al., 2006). These evidences suggest that detrital materials from the eastern part of the Kunlun and the Altyn Mountains increased during sub-stage
25
1b. In summary, in addition to the supply of eolian dust from the Qilian Mountains and Hexi Corridor, supply of eolian dust from the Tarim Basin to the CLP seems to have started approximately at 4.3 Ma due to the uplift and enhanced erosion of the central
CPD
4, 335–374, 2008 Provenance changes of eolian dust at Lingtai since 7 Ma Y. Isozaki et al. Title Page Abstract Introduction Conclusions References Tables Figures ◭ ◮ ◭ ◮ Back CloseFull Screen / Esc
Printer-friendly Version Interactive Discussion
to eastern part of the Kunlun and the Altyn Mountains and consequent formation of the Taklimakan desert during sub-stage 1b.
6.2.3 Sub-stage 1c
Appearance of EM 4, reappearance of EM 1, and disappearance EM 2′ and EM 3 occurred around 2.1 Ma at the boundary between sub-stages 1b and 1c. Since EM
5
4 is considered as representing eolian dust from the western Taklimakan desert while EM 3 is considered as representing eolian dust from the central to eastern Taklimakan desert, it is possible that the switch of the major detrital source to the Taklimakan desert from the central-eastern side to the western side caused a shift from EM 3 to EM 4. These suggest that contribution of the dusts from the western part of the Tian
10
Shan Mountains and the western part of the Kunlun Mountains increased during this period. According to previous studies, the linear sedimentation rate of conglomerate in the southwestern margin of the Tarim Basin gradually increased from 4.6 to 1.6 Ma, which indicates that supply of detrital materials from the western part of the Kunlun Mountains increased (Zheng et al., 2000, 2003, 2006). Same conglomerate layers are
15
also distributed in the western part of the Tian Shan Mountains (Scharer et al., 2004). This is conformable with the shift in dust source from EM 3 to EM 4.
Reappearance of EM 1 and disappearance of EM 2′ are considered as reflecting a
shift of the other dust source from the Badain Juran and the Tengger deserts to the area ranging from the central to eastern part of the Tian Shan, the southern slope of
20
the Altai, and the Gobi Altai Mountains. However, we cannot find any tectonic evidence to explain this change around 2.1 Ma.
6.2.4 Sub-stage 1d
Disappearance of EM 1 and EM 4 and reappearance of EM 2′′ and EM 3 occurred around 1.4 Ma at the boundary between sub-stages 1c and 1d. Disappearance of EM
25
CPD
4, 335–374, 2008 Provenance changes of eolian dust at Lingtai since 7 Ma Y. Isozaki et al. Title Page Abstract Introduction Conclusions References Tables Figures ◭ ◮ ◭ ◮ Back CloseFull Screen / Esc
Printer-friendly Version Interactive Discussion
Taklimakan desert from the western side to the central to eastern side.
On the other hand, disappearance of EM 1 and reappearance of EM 2′′ suggests
that contribution of eolian dust from the central to eastern part of the Tian Shan, the southern slope of the Altai and the Gobi-Altai Mountains stopped and dust emission from the Badain Jurain and the Tengger desert started again. This could be explained
5
by the southward shift in the westerly jet path from above the Tian Shan, the Altai, and the Gobi-Altai Mountains to the Taklimakan, the Badain Juran, and the Tengger deserts due to the cooling and expansion of the ice sheet of the Northern Hemisphere (Lisiecki and Raymo, 2005) although supporting evidence of the southward shift in westerly jet path at 1.4 Ma is lacking.
10
6.2.5 Stage 2
Maximum contribution of eolian dust from the Taklimakan desert to the CLP occurred during stage 2 (1.1 to 0.8 Ma) when EM 2′′ and EM 3 disappeared and EM 4 reap-peared. According to Sun (2001), deposition of the mountain loess on the northern slope of the Kunlun Mountains started approximately at 1.2 Ma (Sun, 2001). Sun and
15
Liu (2000) also suggested that the sedimentation rate of lacustrine deposits in the Qaidam Basin, which is derived from the piedmont margin of the Kunlun, the Altyn, and the Qilian Mountains, show the maximum between 1.1 and 0.9 Ma, which can be evidence of the uplift of the Kunlun, the Altyn, and the Qilian Mountains in that area. On the other hand, age of volcanic rocks in the western part of the Kunlun Mountains is
20
approximately 0.8 Ma (Sun and Liu, 2000), which implies the uplift of the western part of the Kunlun Mountains during this period. These observations suggest that the rela-tive increase in contribution of the eolian dust from the Taklimakan desert to the CLP is caused by the uplift and enhanced erosion of the Kunlun Mountains and consequent production of detrital particles. It is also possible that uplift of the Kunlun Mountains
25
produced a geomorphological condition that allowed dust to be lifted up to higher alti-tude.
CPD
4, 335–374, 2008 Provenance changes of eolian dust at Lingtai since 7 Ma Y. Isozaki et al. Title Page Abstract Introduction Conclusions References Tables Figures ◭ ◮ ◭ ◮ Back CloseFull Screen / Esc
Printer-friendly Version Interactive Discussion
6.2.6 Stage 3 and 4
Reappearance of EM 2′′′and 2′′′′after stage 3 suggests that dust contribution from the Badain Juran and the Tengger deserts re-started approximately at 0.8 Ma. Contribu-tion from the Tengger desert further increased during stage 4 (0.4 Ma to present). It is considered that provenance changes at the beginning of stage 3 and stage 4 reflect
for-5
mation of sand desert and beginning of dust emission from the Badain Juran desert at 0.8 Ma, and the start of dust emission from the Tengger desert at 0.4 Ma, respectively, both caused by the increases in delivery of detrital materials from the Qilian Mountains. Actually, Pan et al. (2007) suggested increased erosion of the Qilian Mountains at 0.8, 0.4, 0.2, and 0.1 Ma which were caused either by the uplift of or glaciation on the Qilian
10
Mountains based on dating of the river terraces using10Be and ESR techniques (Pan et al., 2007).
7 Conclusions
We conducted a provenance study of fine fraction of the eolian sediments at Lingtai section, the central CLP using ESR signal intensity and CI of quartz. The result
sug-15
gests that provenance of fine fraction of the samples from Lingtai section changed ap-proximately at 1.1, 0.8 and 0.4 Ma, with which the last 7 Ma was divided into 4 stages from stage 1 to 4. Stage 1 was further divided into 4 sub-stages 1a, 1b, 1c and 1d approximately at 4.3, 2.1 and 1.4 Ma. Four different sources of detrital materials are inferred, which are named EM 1 to EM 4.
20
EM 1 is an located at around (ESR signal intensity, CI) = (19, 9.1) on the ESR signal intensity versus CI diagram, which is considered as representing the Precam-brian metamorphic and sedimentary rocks, and Paleozoic granitic and volcanic rocks exposed in the area extending from the central to eastern part of the Tian Shan Moun-tains to the southern slope of the Altai MounMoun-tains, and the Gobi-Altai MounMoun-tains. EM
25
represent-CPD
4, 335–374, 2008 Provenance changes of eolian dust at Lingtai since 7 Ma Y. Isozaki et al. Title Page Abstract Introduction Conclusions References Tables Figures ◭ ◮ ◭ ◮ Back CloseFull Screen / Esc
Printer-friendly Version Interactive Discussion
ing late Paleozoic granitic rocks and Precambrian metamorphic rocks exposed in the western part of the Qilian Mountains and the boundary mountain between the Badain Juran and the Tengger deserts with additional contribution from the early Paleozoic volcanic and sedimentary rocks and Mesozoic terrestrial sedimentary rocks exposed in the eastern part of Qilian Mountains. EM 3 is located at around (11, 8.6), which
5
is considered as representing the Taklimakan desert with possible large contribution from the central to eastern part of the Kunlun and the Altyn Mountains. EM 4 group is located at around (6 to 10, 8.8 to 8.1), which is considered as representing the Takli-makan desert with dominant contribution from the western part of the Kunlun and the Tian Shan Mountains.
10
During sub-stage 1a (7 to 4.3 Ma), the source of eolian dusts to the CLP is estimated as the area ranging from the central to eastern part of the Tian Shan Mountains to the southern slope of the Altai, and the Gobi-Altai Mountains. During sub-stage 1b (4.3 to 2.1 Ma), contribution from the Taklimakan desert with possible dominant contribution from the central to eastern part of the Kunlun and the Altyn Mountains appeared.
Dur-15
ing sub-stage 1c (2.1 to 1.4 Ma), contribution from the western Taklimakan desert with dominant contribution from the western part of the Kunlun and the Tian Shan Moun-tains increases. During sub-stage 1d (1.4 to 1.1 Ma), contribution from the Taklimakan desert with the dominant contribution from the central to eastern part of the Kunlun and the Altyn Mountains reappeared with possible additional contribution from the
Qil-20
ian Mountains, whereas contribution from the central to eastern part of the Tian Shan Mountains to the southern slope of the Altai, and the Gobi-Altai Mountains stopped. During stage 2 (1.1 to 0.8 Ma), maximum contribution of the Taklimakan desert with ad-ditional contribution from the western part of the Kunlun and the Tian Shan Mountains occurred with negligible contribution from other sources. During stage 3 (0.8 to 0.4 Ma),
25
contribution from the Taklimakan desert still continued but contribution from the Badain Juran desert started, and the additional contribution from the Tengger desert started during stage 4 (0.4 to 0 Ma) (Fig. 6).
CPD
4, 335–374, 2008 Provenance changes of eolian dust at Lingtai since 7 Ma Y. Isozaki et al. Title Page Abstract Introduction Conclusions References Tables Figures ◭ ◮ ◭ ◮ Back CloseFull Screen / Esc
Printer-friendly Version Interactive Discussion
7 Ma seem to have reflected the uplift of the Tian Shan, the Kunlun, the Altai and the Gobi-Altai Mountains, consequent formation of the Taklimakan desert, and possibly intensification of winter monsoon. In addition, the changes from 0.8 to 0 Ma may reflect uplift of and/or mountain glacier formation on the Qilian Mountains and consequent formation of and dust emission from the Badain Juran and the Tengger deserts.
5
The results of this study strongly suggest significant influence of local tectonics on the provenance changes of eolian dust in East Asia during the last 7 Ma. It is also possible that strong linkage exists among mountain uplift, desertification, and dust emission. Further studies in this respect are necessary for full understanding of the origin and evolution of deserts in East Asia.
10
Acknowledgements. This research was supported by Fujiwara Natural History Foundation
pro-vided to Y. Isozaki, JSPS fellowship and supporting funds propro-vided to Y. Sun, and the Mitsubishi Foundation provided to R. Tada.
References
Abe, M., Kitoh, A., and Yasunari, T.: An Evolution of the Asian Summer Monsoon Associated
15
with Mountains Uplift – Simulation with the MRI Atmosphere-Ocean Coupled GCM –, J. Meteorol. Soc. Jpn., 81, 909–933, 2003.
Allen, M. B., Sengor, A. M. C., and Natal’in, B. A.: Jungger, Turfan and Alakol basins as Late Permian to Early Triassic extensional structures in a sinistral shear zone in the Altaid orogenic collage, Central Asia, J. Geol. Soc. London, 125, 327–338, 1995.
20
An, Z. S.: The history and variability of the East Asian paleomonsoon climate, Quaternary Sci. Rev., 19, 171–187, 2000.
An, Z. S., John, E. K., Warren, L. P., and Stephen, C. P.: Evolution of Asian monsoons and phased uplift of the Himalaya-Tibetan plateau since Late Miocene times, Nature, 411, 62– 66, 2001.
25
Arjannikova, N., Larroque, C., Ritz, J.-F., D ´everch `ere, J., St ´ephan, J.-F., Arjannikov, S., and San’kov, V.: Geometry and kinematics of recent deformation in the Mondy-Tunka area (south-westernmost Baikal rift zone, Mongolia-Siberia), Terra Nova, 16, 265–272, doi:10.1111/j.1365-3121.2004.00565.x, 2004.
CPD
4, 335–374, 2008 Provenance changes of eolian dust at Lingtai since 7 Ma Y. Isozaki et al. Title Page Abstract Introduction Conclusions References Tables Figures ◭ ◮ ◭ ◮ Back CloseFull Screen / Esc
Printer-friendly Version Interactive Discussion
Asahara, Y., Tanaka, T., Kamioka, H., and Nishimula, A.: Asian continental nature of 87Sr/86Sr ratios in north central Pacific sediments, Earth Planet. Sc. Lett., 133, 105–116, 1995 Avouac, J.-P., Tapponnier, P., Bai, P., You, M., and Wang, G.: Active Thrusting and folding along
the northern Tien Shan and late Cenozoic rotation of the Tarim relative to Dzungaria and Kazakhstan, J. Geophys. Res., 98, 6755–6804, 1993.
5
Broccoli, A. J. and Manabe, S.: The Effects of Orography on Midlatitude Northern Hemisphere Dry Climates, J. Climate, 5, 1181–1201, 1992.
Bullen, M. E., Burbank, D. W., Garver, J. I., and Abdrakhmatov, K. Y.: Late Cenozoic tectonic evolution of the northwestern Tien Shan, new age estimates for the initiation of Mountains building, Bulletin of the Geological Society of America, 113, 1544–1559, 2001.
10
China Geological Academy : geological map of China, Beijing, 32 pp., 1971 (in Chinese). Cande, S. C. and Kent, D. V.: Revised calibration of the geomagnetic polarity timescale for the
Late Cretaceous and Cenozoic, J. Geophys. Res., 100, 6093–6095, 1995.
Dasch, E. J.: Strontium isotopes in weathering profiles, deep-sea sediments, and sedimentary rocks, Geochim. Cosmochim. Ac., 33, 1521–1552, 1969.
15
Charreau, J., Chen, Y., Gilder, S., Dominguez, S., Avouac, J.-P., Sen, S., Sun, D., Li, Y., and Wang, W. M.: Magnetostratigraphy and rock magnetism of the Neogene Kuitun He section (northwest China): implications for Late Cenozoic uplift of the Tianshan Mountains, Earth Planet. Sc. Lett., 230, 177–192, 2005.
Derbyshire, E., Meng, X. M., and Kemp, R. A.: Provenance, transport and characteristic of
20
modern eolian dust in western Gansu Province, China, and interpretation of the Quaternary loess record, J. Arid Environ., 39, 497–516, 1998.
Ding, Z., Rutter, N., and Liu, T.: Pedostratigraphy of Chinese Loess Deposits and Climatic Cycles in the Last 2.5 Myr, Catena, 20, 73–91, 1993.
Ding, Z. L., Sun, J. M., Yang, S. L., and Liu, T. S.: Preliminary magnetostratigraphy of a thicj
25
eolian red clay-loss sequence at Lingtai, the Chinese Loess Plaetau, Geophys. Res. Lett., 25, 8, 1225–1228, 1998a.
Ding, Z. L., Sun, J. M., Liu, T. S., Zhu, R. X., Yang, S. L., and Guo, B.: Wind-blown origin of the Pliocene red-clay formation in the central Loess Plateau, China, Earth Planet. Sc. Lett., 161, 135–143, 1998b.
30
Ding, Z. L., Xiong, S. F., Sun, J. M., Yang, S. L., Gu, Z. Y., and Liu, T. S.: Pedostratigraphy and paleomagnetism of a 7.0 Ma eolian loess–red clay sequence at Lingtai, Loess Plateau, north-central China and the implications for paleomonsoon evolution, Palaeogeogr. Palaeocl., 152,