HAL Id: hal-02352305
https://hal.archives-ouvertes.fr/hal-02352305
Submitted on 6 Nov 2019HAL is a multi-disciplinary open access archive for the deposit and dissemination of sci-entific research documents, whether they are pub-lished or not. The documents may come from teaching and research institutions in France or abroad, or from public or private research centers.
L’archive ouverte pluridisciplinaire HAL, est destinée au dépôt et à la diffusion de documents scientifiques de niveau recherche, publiés ou non, émanant des établissements d’enseignement et de recherche français ou étrangers, des laboratoires publics ou privés.
Mordenite etching in pyridine: textural and chemical
properties rationalized by toluene disproportionation
and n-hexane cracking
Hussein Issa, Joumana Toufaily, Tayssir Hamieh, J. D. Comparot, Alexander
Sachse, Ludovic Pinard
To cite this version:
Hussein Issa, Joumana Toufaily, Tayssir Hamieh, J. D. Comparot, Alexander Sachse, et al.. Mordenite etching in pyridine: textural and chemical properties rationalized by toluene disproportionation and n-hexane cracking. Journal of Catalysis, Elsevier, 2019, 374, pp.409-421. �10.1016/j.jcat.2019.05.004�. �hal-02352305�
1
Mordenite etching in pyridine: textural and chemical properties rationalized by toluene disproportionation and n-hexane cracking
Hussein Issa,1 Joumana Toufaily,2 Tayssir Hamieh,2 J. D. Comparot1, Alexander Sachse1*,Ludovic Pinard1*
1
Institut de Chimie des Milieux et Matériaux de Poitiers (IC2MP) - UMR 7285 CNRS, UFR SFA, Bât. B27, 4 rue Michel Brunet, TSA 51106, 86073 Poitiers Cedex 9 (France)
2
Université Libanaise, Laboratoire des matériaux, catalyse, environnement et méthodes analytiques (MCEMA), Hadath, Libanon
Corresponding authors: [email protected], [email protected]
Abstract
Chemical etching with hydrofluoric acid in pyridine medium has been developed as efficient strategy for the crystal engineering of mordenite zeolites. Contrary to the HF etching in aqueous medium, the etching in pyridine allows to preserves the global composition and acidity of parent mordenites. Zeolites etched in pyridine have a similar distribution of Brønsted acid sites (BAS) as the parent, i.e. 16% in 8-MR channels, 19% at the intersection between side pockets and 12MR channels and 65% in the 12-MR channels. Etching in aqueous HF failed to preserve BAS distribution due to strong dealumination, which further leads to enlargement of side pockets. Mordenites etched with HF in pyridine allow for superior catalytic performance in both n-hexane cracking and toluene disproportionation. It has been evidenced that only the BAS located in the 8-MR side pockets prove active for the toluene disproportionation at 450 °C, while for n-hexane cracking at 541°C BAS in both 12-MR channels and 8-12-MRs pockets catalyze the reaction, yet BAS in side pockets are more active (1.5 times). Moreover, Lewis acid sites generated during the post-synthetic treatments exalt the strength of the active sites, which multiplies TOFs of the active sites by two.
Keywords: Cracking, disproportionation, etching, mordenite, Brønsted acid sites,
2
1. Introduction
The quest for the development of hierarchical zeolites is essentially motivated by maximizing the effectiveness factor in zeolites catalysis through shortening diffusion path lengths.[1-2] The by far most simple and cost efficient hierarchization strategy is based on demetallation, which allows for the development of secondary, intracrystalline porosity.[3] These approaches rely on the removal of silicon and aluminium species from the zeolite framework, resulting in the formation of cavities. An extensive set of data has been published on the development and the fine tuning of such dealumination and desilication methods.[4] For zeolites featuring low Si/Al ratios (i.e. Si/Al < 5), dealumination through hydrothermal treatments or aqueous acids solutions allows for increasing specific surface areas essentially.[5] For high silica zeolites (Si/Al > 30), the removal of Si species through alkaline leaching, results in the formation of defined mesopores.[6]
Mordenite is one of the “big five” zeolite and extensively employed in the petrochemical industry in a variety of processes including alkylations, isomerizations, dehydrations and aminations.[7] Mordenite features one-dimensional 12-membered rings (MR) (6.7x7.0 Å) that are connected to one MR channel (2.6 x 5.7 Å) in the crystallographic c direction and one 8-MR (3.4 x 4.8 Å) side pocket in the b direction.[8] It is generally admitted that merely the acid sites within the 12-MR participate in catalytic events, as most reactants are sterically hindered to access BAS in 8-MR. Hence, mordenite can be described as featuring a pseudo one-dimensional structure. This facile conclusion is yet misleading, as several studies reported the contrary. Protons located in the 8-MR side pockets of MOR have proven as the active sites in the monomolecular propane cracking and dehydrogenation [9] and dimethyl ether carbonylation.[10]
The dealumination of mordenite through treatments with nitric acid solutions has revealed that the microporosity of materials increase, probably through an enlargement of the 8-MR
3
side pockets.[11] Semagina and co-workers furthermore evidenced that despite of loss of crystallinity microporosity increases, due to selective removal of Al form T3 and T4 sites through acid treatment.[12] The development of microporosity upon dealumination has further been evidenced through computational simulations.[13] Among the various dealumination strategies the etching of zeolites through aqueous HF solutions has firstly been described by Ghosh and Kydd.[14] Though not particularly devoted to the textural properties, the authors observed a substantial decrease in the BET surface area with increasing HF concentration, which can be related to the reduction of microporosity and crystallinity. Treatments of zeolites with aqueous HF solutions led to a preferential extraction of aluminium from the zeolite framework and hence to a substantial decrease in Brønsted acidity with important consequences on the catalytic performance.[15] Valtchev and co-workers pointed out that the HF etching process in aqueous solution can be tailored towards the biased removal of Si and Al from the zeolite framework, by altering the HF ionization equilibrium in water through the addition of NH4F.[16]
Zeolite post-treatments result in both modifications of acid and textural properties. In the present study we aimed at quantifying the actual gain provided through textural modification on the catalytic performances. Therefore hierarchical catalysts were compared to a series of sodium exchanged catalyst, for which only the concentration of acidic sites varies. A new mordenite etching procedure has further been developed, which relies on the use of a pyridinic HF solution. The idea behind the use of pyridine as medium was motivated by the possibility to directing the post-synthetic treatment through impacting the HF dissociation equilibria. Additionally, HF in pyridine is a safer form to handle hydrogen fluoride as it is much less volatile. Materials obtained through this innovative strategy were compared to samples achieved by the classically strategy (i.e. etching with aqueous HF) in terms of
4
textural and chemical properties. It was further observed that the HF etching in pyridine allows for the development of mordenite catalysts with superior catalytic properties.
2. Experimental Section 2.1 Materials and Methods
Four different series of mordenite were compared in the present work:
1. M10: a parent protonic mordenite (Si/Al = 9) supplied by Süd Chemie;
2. Nax: mordenite with a degree of Na exchange of 23%, 56%, 68% and 83% (x
represents the percentage of exchanged protons);
3. Fx and PyFx: chemical etching of M10 by HF in aqueous and pyridine solutions,
respectively (x indicates the molar concentration of HF).
The Nax series was obtained by cationic exchange of M10 in NaNO3 aqueous solutions of
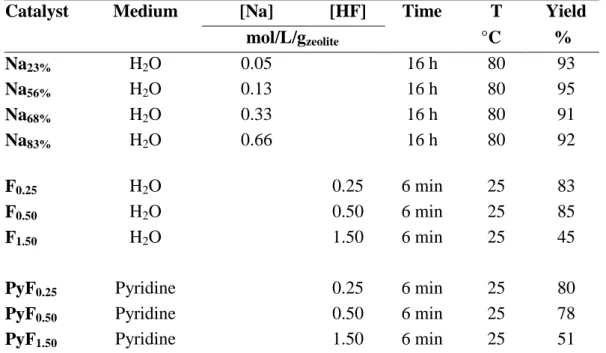
different concentrations at 80 °C for 16 h under mechanical stirring (400 rpm), followed by static drying for 12 h at 110 °C. Mordenite etching was carried out through the use of an aqueous HF solution and a solution of HF in pyridine. In a 100 mL Teflon vessel were placed 1 g of the parent mordenite (M10). 20 mL of the HF solution of different concentrations (0.25, 0.50 and 1.50 M) was added at 25 °C for 6 min under mechanical stirring (500 rpm). Thereafter the zeolite suspensions were centrifuged at 6000 rpm for 10 min. The residue was washed with 40 mL demineralized water. Washing cycles were performed until neutral pH. Solids were dried at 100 °C for 12 h and calcined under air flow (100 ml min-1 per 1 g of zeolite) at 550 °C for 8 h. The synthesis conditions and the obtained yields of each treatment are summarized in supporting information (Table S1).
5
2.2 Characterization techniques
XRD patterns were obtained on a D5005 BRUKER AXS diffractometer using a CuKα
radiation (λ = 1.541874 Å) as incident beam, obtained by submitting a copper anode to a tension of 40 kV and an intensity of 30 mA. Relative crystallinities were calculated by estimation from the diffraction peaks intensities, considering the crystallinity of the parent mordenite to be 100% crystalline.[17] All XRD measurements were performed with 15 mg of sample. The Willamson-Hall (E1) relation was used to calculate coherent crystallite size (CCS) and the lattice strain:[18]
where is the full width of half maximum (FWHM), K stands for the shape factor (0.9), λ represents the wavelength of CuKα radiation (1.541874 Å), D is the coherent crystalline size
and ɛ gives the crystal strain. The morphology of the samples was determined by transmission electronic microscopy (TEM) using a Philips CM 120 microscope equipped with a LaB6
filament. A Micromeritics 3FLEX was used for nitrogen sorption measurements. Around 50– 60 mg of each calcined zeolite sample was out-gassed prior to each experiment during 12 h at 350 °C. Nitrogen sorption measurements were performed at -196 °C. The total pore volume was determined from the nitrogen adsorbed volume at p/p0= 0.99. The t-plot method was used
to calculate the microporous volume. The thickness of the nitrogen layer was calculated as given in the literature.[19] A Micromeritics Auto pore IV Mercury porosimeter was used for the determination of the macroporous volume. Around 150–350 mg of a sample was pretreated at ambient temperature with a maximum head pressure 0.031MPa. Analysis was carried out in the low pressure range from 0.01 to 0.1 bar with a retention time 10 seconds. The global Si/Al ratio was determined through Induced Coupled Plasma-Atomic Emission Spectroscopy (ICP -AES), on a Perkin Elmer Optima 2000 DV apparatus. The amount of Brønsted and Lewis acid sites were determined by pyridine chemisorption followed by FTIR.
6
Experiments were carried out in a quartz IR cell equipped with CaF2 windows, connected to
vacuum and atmospheric systems, as well as temperature-controlled oven. Prior to analysis, each catalyst was pressed into a self-supported wafer 2 cm2 (0.5 ton) that weighed between 10 and 30 mg. The acidity was determined by pyridine adsorption at 150 °C. After establishing a pressure of 1 Torr at equilibrium, the cell was evacuated at 150 °C to remove all physisorbed species. The IR spectra were recorded at room temperature after the activation period and after pyridine thermodesorption in vacuum (10-3 Pa) at various temperatures: 150, 250, 350 and 450 °C. The amount of pyridine adsorbed on Brønsted [PyH+] and Lewis [PyL] sites was determined from the integration of bands at 1545 and 1454 cm-1, using extinction coefficients previously determined.[20] All spectra were taken in the range of 1000 to 4000 cm-1 on a Nicolet 5700 apparatus (resolution: 2 cm-1, 64 analyses per spectrum). The transmission measurements of different solutions of pyridine HF were carried out in a liquid cell (Omni-Cell) with CaF2 plates. The method involves dropping several drops of the sample on the
plate and sandwiching it with another plate in such a way that no gas bubbles are trapped.
2.3 Catalytic tests
n-Hexane cracking and toluene disproportionation were carried out in a tubular glass fixed-bed microreactor under plug flow conditions. Prior to the cracking reaction, samples (0.2 - 0.4 mm particles size) were pretreated for 8 h at 540 °C under a flow of dry nitrogen. For the disproportionation reaction at 450 °C. The operating conditions were applied as listed below: 4. n-Hexane cracking: 540 °C, 0.1 MPa, N2/n-C6 = 9 and a contact time fixed at 0.02 s.
5. Toluene disproportionation: 420 °C, 0.1 MPa, presence of H2, H2/n-C6 = 4 and a
contact time of 0.12 s.
The reaction products were sampled during 1 h in a 10 port-valve, then analyzed by a gas chromatographs (GC) equipped with a Flame Ionization Detector (FID). A 50 m
Cp-7
Al2O3/Na2SO4 capillary column of 0.32 mm internal diameter and a 60 m BR wax column of
0.25 internal diameter were used for the n-hexane cracking and the toluene disproportionation, respectively.
3. Results and discussion
Table 1 and 2 summarize the textural and acidic properties of the parent mordenite (M10)
and of the three catalyst series resulting from the different post-treatments, i.e. Na exchange (Na) , HF etching in aqueous (F) and pyridine (PyF) medium.
3.1 Textural and acidic properties of the parent zeolite (M10)
M10 is composed out of smaller crystals (approximately 100 nm in length inferred from TEM images) with an important degree of agglomeration (Figure 1a-c). By applying Willamson-Hall analysis to its XRD pattern (Figure S1) the coherent crystallite size (CCS) and the lattice strain were quantified (Table 1) and are 62.8 nm and 8.8, respectively. M10 can be considered as an aggregate of highly agglomerated nanocrystals. The intracrystalline space between nanocrystals yields to an inter-granular macroporous volume of 0.35 cm3 g-1 (Table
1). The nitrogen adsorption isotherm at -196 °C is of type I as expected for a microporous
material and a microporous volume of 0.19 cm3 g-1 was calculated.
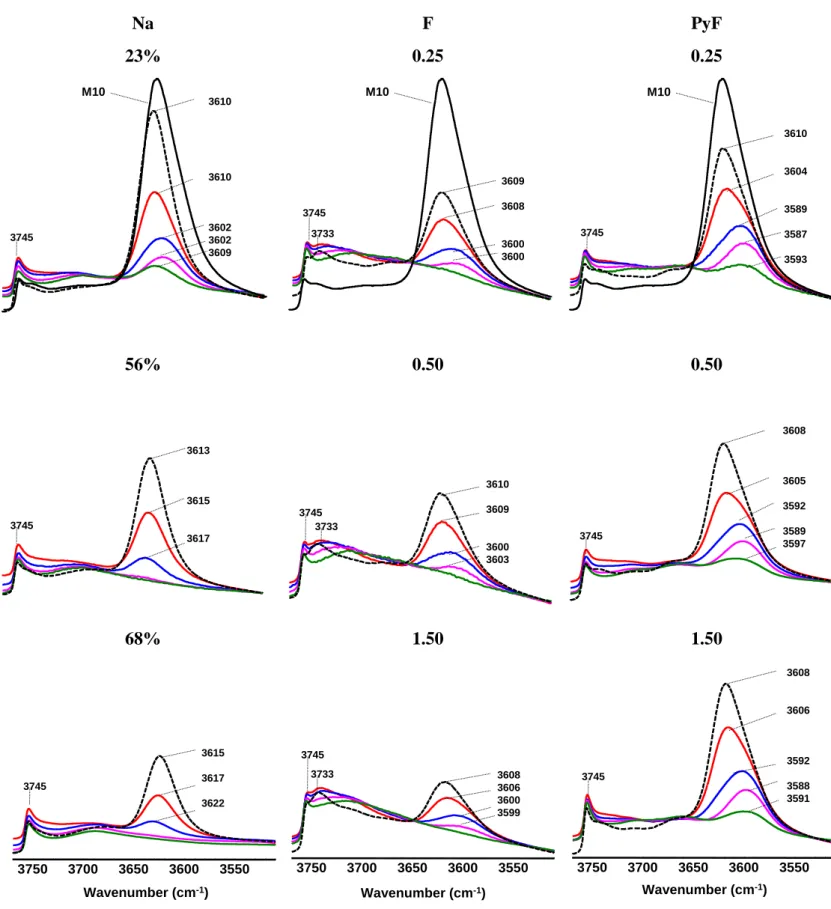
The hydroxyl stretching vibration region of IR spectra before (dotted line) and after (green line) adsorption of pyridine at 150 °C is given in Figure 2. MOR exhibits an intense band, slightly asymmetric, at 3608 cm-1, which can be assigned to the bridging hydroxyl groups (i.e. acidic hydroxyl groups) and less intensive bands at 3745, 3733 and 3655 cm-1 due to stretching vibrations of external and internal silanols Si-OH, and OH linked to extraframework aluminium species (EFAL), respectively.
8
The adsorption of pyridine at 150 °C leads to a partial decrease of the intensity of the 3608 cm-1 band associated with a 20 cm-1 shift towards lower wavenumber. The thermodesorption of pyridine from 150 °C to 450 °C permits to observe the opposite effect, i.e. a shift of the position of the band maximum toward higher wavenumbers (3588 to 3605 cm-1). The incomplete neutralization of bridged OH groups by pyridine is due to a set of inaccessible OH groups located within the 8-MR side pockets. Indeed, the number of Brønsted acid sites (BAS) probed by pyridine is 1014 µmol g-1, while the theoretical value calculated from the elemental analysis amounts to 1370 µmol g-1 (Table 2). Hence, 24% of the BAS are located in side pockets, this value is slightly higher than that drawn from the ratio between the areas of OH band before and after pyridine adsorption, i.e. 19%.
3.2 Influence of the Na exchange on the physical properties of mordernite (Nax series) The shape of the isotherm is equal for the Na-exchanged samples as to the parent M10, yet the microporous volume decreases with increasing amount of Na-exchange and reaches 0.15 cm3 g-1 for the Na83% sample (Figure S2).
For sodium exchanged samples a decrease in the intensity of the stretching band of bridged OH groups as well as a shift to higher frequencies up to +10 cm-1 (for Na83%) was observed.
As expected, the OH bands associated with internal and external silanol defects are not affected by sodium exchange. For Na83% the adsorption of pyridine at 150 °C neutralizes all
the acidic OH and its thermal desorption leads to the development of a peak, which maximum is centered at 3622 cm-1 (Figure 2). Indeed, the theoretical acidity drawn from the elemental analysis and the number of BAS probed by pyridine becomes identical starting from a degree of exchange of 23%. Hence, starting from this exchange degree the great majority of acid sites are located within the 12-MR channels (Figure S3). On the most exchanged mordenite zeolites: Na68% and Na83%, the sum of Na content measured by ICP and that of H+ by pyridine
9 corresponds almost accurately to the Al content, which means that the amount of extraframework species is very low. Indeed, Lewis acidity amounts to less than 15 µmol g-1 (Table 2).
The shifting of the position of the maxima of the adsorption bands reveal the existence of at least three components (3588, 3608 and 3622 cm-1), contributing to the asymmetry of the band of bridged OH groups. Differentiation between BAS in mordenites has been proposed in a number of spectroscopy studies with defined amounts of BAS varying from 2, [21-28] 3, [29] and 6.[30] According to Lukyanov et al.,[30] six distinct bands can be visualized by six single bands in Fourier self-deconvolution traces of the IR spectra. The assignment of the OH bands is linked to seven distinct crystallographic oxygen atoms (Scheme 1):
- 3581 and 3590 cm-1: O1-H and O9-H hydroxyls in the small 8-MR channels;
- 3599 cm-1: O5-H hydroxyl in the intersection between side pockets and 12-MR channels;
- 3609 cm-1: O2-H and/or O10-H hydroxyls in the 12-MR channels;
- 3617 and 3625 cm-1: O3-H and O7-H located in the 12-MR channels and linked to Na- exchange position VI.
Likewise, Schlenker et al.[31] described three crystallographic positions of Na+ cations in MOR; i.e. I (8-MR channel), IV (intersection between side pockets and 12-MR channels, and VI in the 12-MR channels.
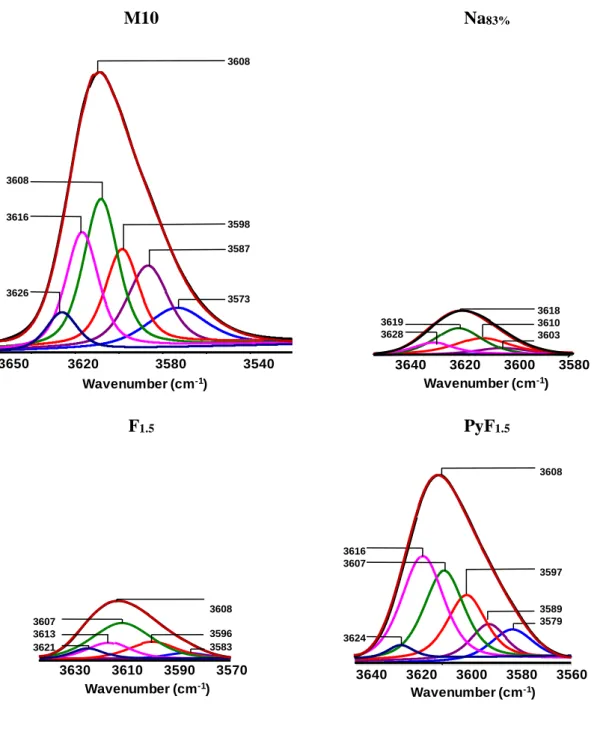
The deconvolution of the hydroxyl region of M10 allows to obtain six band centered at 3626, 3616, 3608, 3598, 3587 and 3573 cm-1 (Figure 3). From the height of each bands and using their relative extinction coefficient drawn from ref.[30] (Table S2), the distribution of BAS on the parent zeolite was calculate to be: ~18% in the 8MR channels (a value that is slightly lower than that obtained from pyridine adsorption, 23%), ~18% at the intersection between side pockets and 12-MR channels, and ~64% are located within the 12-MR channels.
10
Furthermore, the position of these bands allows to deduce the strength of individual BAS as indicated by Niwa et al.[32] As such, bands at higher wavenumbers correspond to “weak” BAS (i.e. unconstrained OH), whilst bands centered at lower wavenumbers to "stronger" BAS (i.e. constrained OH). Yet, the shift in the relative band position could further be related to a bathochromic effect, which originates from high electrostatic perturbation induced by the small size of the 8-MR channels.[33] Although the BAS on the small 8MR channel are rapidly exchanged by sodium cations, their exchange is completed only after a 60% exchange degree (Table S2). According to Gounder and Iglesia,[9] the preferential exchange of H+ site in the site pockets by Na+ is due to their higher stabilization by the stronger dispersive forces in such confined environments. After full exchange in the 8-MR (i.e. sample Na56), only four
bands are observable (3603, 3610, 3619 and 3628 cm-1), which. can be attributed to BAS located at the intersections (8%) and in the 12MR channels (remaining BAS). This means that during Na exchange, even at low exchange rates all the hydroxyl bands are more and less impacted. On the Na catalyst series, the concentration of OH bands located in the 12-MR channel and at the intersection is calculated using the extinction coefficient reported in ref., [30], their concentration is close to that measured by pyridine chemisorption, which validates the values of the extinction coefficient (Figure S4).
3.3 Influence of the HF etching on the physicochemical properties of mordenite: Fx and
PyFx samples
Both, the HF etching of mordenite in aqueous (F) and pyridinic (PyF) solutions results in a slight decrease in the overall crystallinity of the samples (Figure S1, Table 2). The reduction of the diffraction efficiency indicates the disruption of crystalline planes during the treatment through the development of secondary porosity or defects.[34] For F samples the crystallinity decreases more importantly with increasing HF concentration compared to PyF samples.
11
Moreover, the XRD patterns of the treated F samples allow to infer an increase of the full width at half maximum (FWHM). The lattice strain of the F samples is significantly higher compared to the parent mordenite and increases with increasing HF concentration (Table 1). This finding indicates that the fluorine etching induces an important strain on the lattice, most likely due to the enhanced formation of silanol defects. Interestingly, the lattice strain is comparable to that of the parent zeolite for PyF samples, indicating that in these samples the induced stress field is reduced (absence of silanol nests). A similar tendency can be deduced for the coherent crystal size (CCS) which decreases up to almost the half for the Fsamples. The reduced CCS for F samples suggest that zeolite dissolution is favored on specific sites of the crystals; generating hence smaller crystalline domains. In previous studies it has indeed been reasoned that treatments of zeolites with aqueous HF solutions results in the preferential elimination of specific parts of the crystal which are rich in defects and are hence more prone to dissolution.[17,35] It is interesting to note that for PyF samples the CCS only slightly reduces compared to the parent mordenite, indicating that the action on HF in pyridine affects the zeolite in a different manner.
HF etching in aqueous solution acts within the crystal and allows to observe electron clear regions related to the presence of macropores in TEM images (Figure 1e). As for the HF etching in pyridine solution, the observed TEM images are very similar to the parent mordenite (Figure 1). It is worth to mention that mordenites treated with HF in aqueous conditions, the development of a more important macroporous volume (0.44 cm3 g-1) can be inferred (Table 1, Figure S5).
In order to achieve further insights on the textural properties of the samples they were characterized through nitrogen and argon physisorption at -196 °C. The shape of the isotherms achieved for the etched F and PyF samples is very similar to those of the parent sample and is of type I (Figure S2). Form the low relative pressure region of the argon
12
adsorption isotherms a variation in the argon uptake for the modified samples can be inferred, which indicates a modification in the size of the micropores (Figure 4). Indeed, for F samples a smaller microporosity develops (argon uptake at 10-6 and 10-5 P/P0), which might be related
to the enlargement of some 8-MR side pockets. It is to note that the filling of the 8-MR is not observed in argon or nitrogen physisorption at -196 °C. Pastvova et al.[36] observed that the extraction of T4 atoms in mordenite as a result of the hydrolysis of Al-O and Si-O causes the merging of two 8-MRs leading to the development of a larger void space, which is hence accessible to bulkier molecules such as toluene. The authors further describe that the extraction of T2 sites might lead to the formation a larger deformed ring. Indeed, the modification of micropore size distribution of mordenite upon acid leaching has been observed by several groups.[11-12] It is to note that for PyF samples analog micropore filling is observed as for the parent M10, indicating that the pyridine treatment does not enlarge 8-MRs, due to a low demetallation of the zeolite framework.
The nature of the employed solvent in the HF etching has a major effect on the framework composition (Table 2). Preferential elimination of Al species has been observed for F samples. For the sample treated with the highest concentration of HF in aqueous conditions the Si/Al ratio almost doubled. Yet, contrariwise to what was observed by Ghosh et al.,[14] the use of concentrated HF solutions (1.5 mol L-1) did not lead to the incorporation of fluorine in the zeolite framework. This difference can be ascribed to the preparation mode. Whilst in this study, after etching of the sample, the slurry is centrifuged and washed with water, in the protocol described by Ghosh et al. the liquid is evaporated to dryness, promoting hence the fluorine incorporation.[14] Thus, the short duration of etching treatment coupled with various washing cycles with demineralized water inhibits the incorporation of fluorine as confirmed through fluorescence spectroscopy (Table 2).
13
For samples treated with aqueous HF the intensity of the 3608 cm-1 band decreases through increasing the HF concentration during the treatment, whilst the 3734 cm-1 band slightly
increases in intensity (Figure 2 and S6). This finding indicates a decrease in the concentration of the Brønsted acid sites (Table 2) and further that the preferential elimination of Al species leads to a substantial increase in internal silanol defects (nests). This confirms to what has previously been inferred from the Willamson-Hall analysis of the X-ray diffractograms. The increase of the silanol band, in particularly external one, appears very limited in comparison with that observed during desilication with NaOH,[37] which confirms that HF etching leads to a biased extraction of Al and Si. In addition, the formation of internal defects suggests that the dealumination occurs on the core of the crystal.
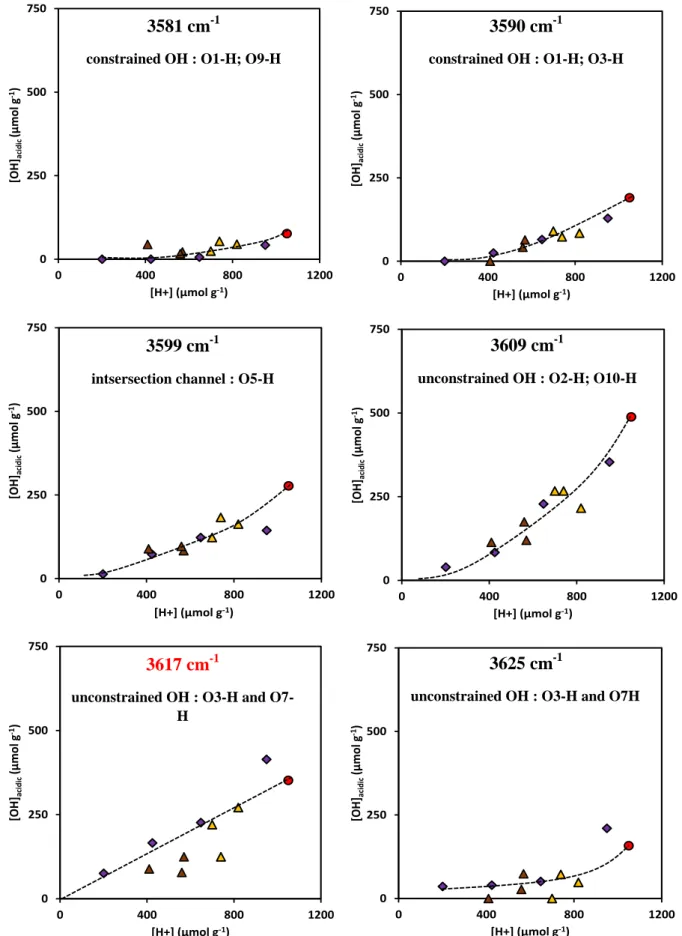
Further the intensities of the deconvulated bands for the main band at 3622 cm-1 for all of the samples was realized. Here for the concentration of the six OH groups was plotted as function of the Brønsted acidity (Figure 5). For all samples the acidic OH groups are probed in the same manner, except for the two cases. Indeed, for the same number of acidic sites probed by pyridine, the number of constrained OH (in particular O1-H and O3-H) is slightly greater for the etched samples compared to the Na-exchanged mordenites. In other words, Na+ preferentially exchanges H+ sites in 8-MRs, while HF etching is non-selective.
3.4 Role of pyridine in HF etching
It is worth to mention that the samples prepared through the treatment with HF in pyridine feature Si/Al ratios, which are comparable of those of the parent zeolite even for treatments that involve more concentrated solutions. The FT-IR spectra of samples treated with HFin pyridine feature a slight decrease of the intensity of the 3608 cm-1 band. The distribution of distinct BAS calculated using the six-bands deconvolution (Figure 3) is close to that of parent mordenite, which is ~16 % in the 8-MR channels, ~19% at the intersection between side
14
pockets and 12-MR channels, and ~65% in the 12-MR channels (Table S2). During the HF etching in pyridine solution, the creation of Lewis acid sites indicates a slight dealumination of the zeolite framework. Assuming that the Lewis species are constituted of two aluminum atoms (e.g. Al2O3), the global acidity probed by pyridine ([PyH+] +2[PyL]) is close to the
amount measured on the parent zeolite (i.e. 1014 µmol g-1) (Table 2). As the global Si/Al composition, the acidity, and the accessibility of BAS remain constant, strongly indicates an unbiased extraction of Si and Al form the zeolite framework. Hence, some of the silicon and aluminium extra framework species are probably trapped within the zeolite micropores. This further explains the slight reduction of microporous volume upon HF treatment (Table 1).
The total number of H+ sites after etching increase with increasing concentrations of HF in pyridine (Table2 ), which indicates that BAS are more preserved through increasing HF concentration in pyridine.
The treatment of zeolites by hydrofluoric acid yields to the formation of solubilised silicon and aluminium fluorinated complexes, such as , and :
(1)
(2)
(3)
We hence observe that the nature of the solvent in which the HF is solubilized has a major impact on the zeolite composition and thus on its acidity. As described by Kolasinski a variety of specie exist in diluted aqueous HF solutions, i.e. , , and undissociated HF molecules and following equilibria exist in solution:[38]
(4)
(5)
The consumption of fluorine ion through the formation of fluorinated complexes should shift the equilibrium toward both a higher dissociation of hydrofluoric acid and probably a
15 reduction of the bifluoride ion concentration. It has experimentally been determined that in diluted aqueous HF solutions (0.1 – 2 M) the ionic activity is highest for , whilst the activity for and undissociated HF are smaller by factor of 5. The ionic activity of H+ is even smaller (by a factor of 20 compared to ). This explains why in aqueous HF solution the dealumination is favored. It has furthermore been described that the etching of silica is linearly dependent on the respective concentrations of undissociated HF and in aqueous solution.[39] Increasing the concentration (through adding fluoride) allows to increase importantly the concentration of in solution (equilibrium 5). For a 1 M HF solution (containing 0.5 M NaF) the ionic activity of F- and are almost equal.[38] Vatchev and co-workers observed that the etching of ZSM-5 with an aqueous HF-NH4F solution allows for an unselective removal of Si and Al species from the
parent zeolites.[16] This finding has been rationalized by the increased concentration of species in solution, which hence leads to a higher rate of desilication.
The HF species present in pyridine have up to date only been rationalized for concentrated HF solutions.[39] In such systems pyridine-HF complexes are formed of the composition which are in equilibrium with (HF)x. Yet, in the present case diluted HF
solutions are used in which pyridine largely exceeds the HF concentration. Taking into consideration that an increased concentration of has been identified for leading to a more pronounced desilication one could assume that the dissolution of HF in pyridine leads to a favored formation of this species. In a first step pyridine is protonated by HF leading to free (equilibrium 5); these could then further shifts equilibrium 2 to the right and lead to an increased amount of .
(6)
Pyridine forms remarkably stable solution with anhydrous fluoride. Olah and co-workers[40] have shown by 1H NMR and 19F NMR that a solution containing 9 equivalents of HF to 1
16 equivalent of pyridine, the pyridinium ring is protoned and the development of polyhydrogen fluoride species, in which each fluorine atom is surrounded by four hydrogen atoms. The development of protonated pyridinic species has been investigated through recording liquid FT-IR spectra for on 0.25, 0.5, 1.5 and 5 M HF in pyridine solutions (Figure 6a). We observed the development of two new bands for the HF/pyridine spectra compared to that of pure pyridine. These are centered at 1450 and 1840 cm-1. It is to note that the intensity of these bands increases with increasing amount of HF in the system (Figure 6b), and correlates with the increase in the total number of H+ after etching (Table 2). It is further to observe that the intensity of the 1581 cm-1 stretching band of pyridine decreases through increasing HF concentration, indicating that pyridine is protonated in the same manner despite the HF concentration. We further observed that the intensity of the band centered at 1602 cm-1 increases with rising amount of HF and can hence be assigned to a vibration of the pyridinium ion.
3.5 Active sites in toluene disproportionation and n-hexane cracking 3.5.1 Toluene disproportionation
The disproportionation of toluene, a bimolecular reaction, involves diphenylmethane intermediates (Scheme S1),[41] and yields a mixture of benzene and xylene (Figure S7b), in proportion close to the thermodynamic equilibrium (20%, 60%, and 20% of o-, m-, and p-xylenes at 420 °C). The initial molar ratio of xylenes to benzene is significantly lower than unity (i.e. 0.2, Table 3). Benzene, which is smaller, diffuses faster and its desorption is favored, while a large part of the xylenes remain trapped in the micropores and then convert into coke (Table 3), which causes the deactivation of the catalyst. The deactivation is much more important compared to n-hexane cracking (section 3.5.2, Figure S8), despite of chemical inhibiting effect of H2 on coke formation.[41,42] The ratio of the residual (after 1
17
hour) to the initial activity (A60/A0) is lower than 0.2 on M10 and on etched zeolites. Indeed,
for the aromatic disproportionation, reactant and products can already be considered as coke precursors. The HF etching in pyridine and water leads to an increase in the turnover frequencies per BAS, while the exchange of H+ by Na+ cation inhibits almost totally the disproportionation reaction. The effect of Na-exchange on aromatic disproportionation has previously been described Marie et al.,[43] through an operando infrared spectroscopy study at 350 °C. They proved by studying the evolution of the consumed hydroxyls in the xylene transformations that constrained BAS do not directly take part to the catalytic event; yet their impact is crucial on catalytic activity. Their discussion is based on the decomposition of the
OH band, which is corrected (by shifting and broadening of bands according to)[43] to take
account of the influence of the reaction temperature. The authors suggested that the beneficial effect of the Na+ exchange by H+ in the 8-MR side pockets on the disproportionation reaction would be related to a modification in the void space within the micropores. Yet, the “strong” increasing in the micropore volume is rather limited and even negligible (+ 0.017 cm-3 g-1). Ratnasamy et al.[44] and Bankὀs et al.[45] observed the same effect of the Na+ exchange on the selectivity in the transformation of o-xylene. The appearance of the disproportionation products is concomitant with strong Brønsted acid sites, which appear at a high degree of Na+ exchange. The authors postulated that the exaltation of the acidity resulted from the interaction between the BAS and the extraframework species which are created during the calcination of the ammonium form of the MOR zeolite. In both of these explanation attempts, the increase of the void volume or the exaltation of the force of the acidic sites, the common assumption is based on the progression of the disproportionation reaction exclusively catalyzed by H+ in the 12-MR channels, rationalized on the basis of the bulkiness of the reaction intermediate (diphenylmethane), (Scheme S1). This conclusion appears to be in disagreement with our observation, from which we infer that BAS located in the 8-MRs are
18 active for toluene disproportionation. Indeed, Figure 7 presents the toluene disproportionation rate (per g) as a function of the number of OH (per g) located within the 8-MR side pockets, the 12-MR channels and at their intersection. Disproportionation rates increase with the number of H+ within the 8-MR channel or at their pore mouth (Figure 7a-b). The involvement of constrained OH was previously observed. Bhan et al.[10] evidenced that the active sites for carbonylation of dimethyl ether to methyl acetate are only the protonic sites located within the 8-MRs. Further, Veefkind et al.[28] proposed that for the reaction of ethanol with NH3 to produce ethylamine that the monoethyl amine intermediate was
selectively stabilized within 8-MR channels. Finally, Gounder et al.[9] demonstrated that monomolecular alkane cracking and dehydrogenation turnovers occur quasi selectively in the 8-MR side pockets.
In the case of the toluene disproportionation, the catalytic involvement of constrained H+ (in the 8-MR side pockets) is possibly provided if the reaction intermediate is partially confined. The kinetic diameter of toluene (5.85 Å) is just slightly larger than that of the 8-MRs (5.7 Å). At high temperatures the zeolite framework distorts[46] and fits the size requirements of toluene. Hence, the toluene adsorption in the 8-MR could mimic an enzymatic mechanism. Partially confined, the aromatic molecule would yield a stabilized benzylium ion (Scheme 1), which could react with a toluene molecule in the 12-MR channel and disproportionate into a desorbed benzene and methylbenzylium ion.
The TOF per constrained H+ is the same independent of the degree of sodium exchange (excepted for Na56%), whilst the TOF calculated per total H+ decrease with the Na content. We
can hence conclude that the H+ located in the 12-MR channels are inactive for the toluene disproportionation. After etching, regardless of the media used, TOF per H+ in 8-MR side pockets is more than 2.5 times higher than of the Na series. The higher value of TOF for the
19 F series could be related to the enlargement of 8-MR pocket as previously inferred from Ar physisorption (Figure 4).
3.5.2 n-Hexane cracking
The acidic properties of the achieved materials were further characterized by n-hexane cracking at 541 °C.[41] In a previous study[47] we observed on a series of MFI, *BEA and FAU zeolites, under identical operating conditions, that the monomolecular cracking mechanism is favored and that the autocatalytic bimolecular route is limited despite a relative high partial pressure of n-hexane. The n-hexane cracking yields C1, C2, C3, C4, C5
hydrocarbons. On M10, Na and F catalyst series, reaction products are formed in strictly parallel reactions (Figure S7a) indicating a monomolecular cracking mechanism. It is worth to mention that a slight deviation is observed for the PyF series at high conversions, probably due the competition of the bimolecular mechanism (high conversions yield high olefin pressure). The initial molar ratios for C5/C1 and C4/C2 (Figure S9) are mainly between 0.8
and 1, independent of the nature of the compounds (olefins or paraffins). This confers well to what has been reported by Babitz et al.[48] and Lercher et al.[49] On M10, Nax and F samples,
the C5/C1 ratios (Figure S9) are lower than unity, (ca. 0.5), indicating the occurrence of
secondary cracking, whilst on PyF samples, the ratios are higher (i.e. about 1.1) confirming a dimerization cracking mechanism. It is to note that reducing the contact time allows to minimize the occurrence of the bimolecular mechanism and the C5/C1 ratios agree to the ones
of the other samples (Figure S9). On the parent zeolite and the etched samples with aqueous HF, the initial molar ratio of olefins to paraffins (O/P) is close to unity (Table 3), which is in agreement with a monomolecular mechanism. On the PyF samples, the O/P ratio is lower than unity, indicating the consumption of olefins, which is consistent with the occurrence of a
20
bimolecular mechanism. It is worth to mention that the presence of Na cations seems to promote the dehydrogenation of paraffin as O/P ratios higher than unity have been observed. On M10 zeolite and Nax and Fx samples, the deactivation due to coke formation (Table 3), is
rather slow (Figure S8). The observation of such deactivation paths is consistent with a monomolecular mechanism. Contrariwise, on the PyFx samples, the deactivation rate is fast
and increases with the initial conversion due to a high partial pressure of olefins (PO), which is
hence consistent with a bimolecular mechanism. The relatively fast deactivation on mordenite is due to the “one-dimensional” nature of accessible diffusion channels, and strong coke toxicity is thus observed for all samples. The coking mode occurs by pore blocking, which means that one coke molecule is enough to block the accessibility of reactants to all acid sites located within a given 12-MR channel.[50]
In contrast to the disproportionation reaction, sodium exchange does not cause a drastic loss of activity, but a continuous decrease (Figure 8). This means that both BAS in 12-MR channels and in the 8-MR side pockets are active sites and catalyze n-hexane cracking. Yet, as the confining environment of these sites is different, an independent TOF for each site is observed. The participation of unconstrained H+ is due to high temperature used for the reaction (541 °C). It is possible to calculate the TOF frequency of each site. On the Na83%
sample, the only BAS are within the 12-MR channels and consequently their TOF can be drawn directly from the initial activity. The TOF value of unconstrained OH is hence ca 130 h-1. The activity can be expressed as:
From this equation, it is possible to calculate the TOF value of constrained OH. For example using the activity of Na23%, the TOF of constrained OH it is ca. 4 times higher than
of the TOF of unconstrained OH, i.e. 510 h-1. It should be noted that the TOF of n-hexane cracking in the 12-MR channels is about 2.5 times less than that of the MFI and * BEA zeolites,[47] while that of the 8-MR side pockets is 1.5 times higher. By using TOF values of
21 constraint and unconstraint OH, and knowing the concentration of each active site, a theoretical activity can be calculated, which corresponds to that measured one excepted for PyFx samples (Table 3, Figure 9); the very good correlation validates the two
calculated TOF values.
The high activity observed for PyFx samples could be due to improved mass transfer of
n-hexane within the 12MR channels. Indeed, Tromp et al.[51] calculated an effectiveness factor of 0.3 for the n-hexane hydroisomerization at 250 °C over Pt/HMOR catalyst. The authors observed that diffusion limitations significantly reduced after acid leaching with hydrochloric acid (1 M) on the parent zeolite. They hence attributed improved activities to the generation of a 3-D microporous structure as well as to the development of mesopores that reduce diffusion path length and allow to increase mass transfer. Yet, for n-hexane the kinetic diameter is 4.3 Å, which is significantly lower than the size of the 12-MRs (6.7 x 7.0 Å). Moreover, we have demonstrated that no mass transfer limitation occur during n-hexane cracking, even in medium pore zeolites (MFI: 5.4 x 5.6 Å) as well as on large MFI crystals (8 μm).[47] The textural modifications of the zeolite structure as a result of the HF etching are rather limited in aqueous solution (enlargement of site pocket aperture) and even less in pyridine solution. Hence, the improvement of the mass transfer should not account for the improved activity of the PyFx samples. The higher performances observed for these samples
could be ascribed to an auto-catalytic behavior. Despite the decrease in contact time in order to prevent the bimolecular mechanism, the catalytic activity of PyFx is higher compared to the
other samples, which makes it possible to exclude this explanation. Finally, the high activity of this series could be ascribed to a difference in the intrinsic BAS strength due to their exaltation by the extraframework aluminum (EFAL) species generated during the etching treatment. The exaltation of acidity can be quantified by the ratio , which is
22
Conclusion
Mordenite features a fascinating zeolite structure. Structural and chemical modification of this particular zeolite allow for impressive impacts on catalytic activity and selectivity. The etching of mordenite with HF in pyridine allowed to achieve catalysts with higher accessibility to BAS located within the 8-MRs. Yet, it is not the increased accessibility that was found to be responsible for the improved catalytic activities. It was found that in toluene disproportionation the active sites are exclusivelylocated within the 8-MR. For n-hexane cracking the activities of BAS in 8-MR side pockets and 12-MRs could be quantified and it was found that BAS in side pockets have higher activity than those in the large channels. The results indicate that TOF is increased through stringer confinement of BAS. Furthermore, the acid strength can further be exalted through extra framework species.
Acknowledgments
Hussein Issa thanks Islamic Center Association for guidance and higher education for the financial support of his doctoral studies. The authors acknowledge financial support from the European Union (ERDF) and "Région Nouvelle Aquitaine".
References
[1] J. Pérez-Ramírez, C. H. Christensen, K. Egeblad, C. H. Christensen, J. C. Groen, Chem. Soc. Rev., 37 (2008) 2530-2542.
[2] M. Hartmann, A. G. Machoke, W. Schwieger, Chem. Soc. Rev., 45 (2016) 3313-3330. [3] R. Chal, C. Gérardin, M. Bulut, S. van Donk, Chem.Cat.Chem., 3 (2011) 67-81.
[4] M.-C. Silaghi, C. Chizallet, P. Raybaud, Microporous Mesoporous Mater., 191 (2014) 82–96.
[5] C. Coutanceau, J. M. Da Silva, M. F. Alvarez, F. R. Ribeiro, M. Guisnet, J. Chim. Phys., 94 (1997) 765–781.
[6] J. C. Groen, J. A. Moulijn, J. Pérez-Ramírez, J. Mater. Chem., 16 (2006) 2121-2131. [7] K. Tanabe, W.F. Hölderich, Appl. Catal. A, 181 (1999) 399-434.
[8] W. M. Meier, Kristallgeom. Kristallphys. Kristallchem., 115 (1961) 439-450.
[9] R. Gounder, E. Iglesia, J. Am. Chem. Soc., 131 (2009) 1958-1971.
[10] A. Bhan, A. D. Allian, G. J. Sunley, D. J. Law, A. Iglesia, J. Am. Chem. Soc., 129 (2007) 4919-4924.
[11] N. Viswanadham, M. Kumar, Microporous Mesoporous Mater., 92 (2006) 31-37. [12] A. A. C. Reule, J. A. Sawada, N. Semagina, J. Catal., 349 (2017) 98-109.
23
[13] S. Ban, A. N. C. van Laak, J. Landers, A. V. Neimark, P. E. de Jongh, K. P. de Jong, T. J. H. Vlugt, J. Phys. Chem. C, 114 (2010) 2056-2065.
[14] A. K. Ghosh, R. A. Kydd, J. Catal., 103 (1986) 399-406.
[15] A. G. Panov, V. Gruver, J. J. Fripiat, J. Catal., 168 (1997) 321-327.
[16] Z. Qin, L. Lakiss, J.-P. Gilson, K. Thomas, J.-M. Goupil, C. Fernandez, V. Valtchev, Chem. Mater., 25 (2013) 2759-2766.
[17] D. Verboekend, G. Vilé, J. Pérez-Ramírez, Cryst. Growth Des., 12 (2012) 3123–3132.
[18] V. D. Mote, Y. Purushotham, B.N. Dole, J. Theor. Appl. Phys., 6 (2012) 6.
[19] A. Galarneau, F. Villemot, J. Rodriguez, F. Fajula, B. Coasne, Langmuir, 30 (2014) 13266–13274.
[20] M Guisnet, P. Ayrault, J. Datka, , Pol. J. Chem., 71(1997) 1455–1461.
[21] D. B. Lukyanov, T. Vashnoza, J. L. Casci, J.J. Birtill, Book of abstracts 1:13th international Congress on Catalysis, Paris, 2004, p. 219.
[22] A. Bhan, A. D. Allian, G. J. Sunley, D. Law, E. Iglesia, J. Am. Chem. Soc., 129 (2007) 4919-4924.
[23] V. L. Zholobenko, M. A. Makarova, J. Dwyer, J. Phys. Chem., 97 (1993) 5962-5964. [24] F. Wakabayashi, J. Kondo, A. Wada, K. Domen, C. Hirose, J. Phys. Chem., 97 (1993)
10761-10768.
[25] J. Datka, B. Gil, A. Kubacka, Zeolites, 15 (1995) 501-506.
[26] M. Maache, A. Janin, J. -C Lavalley, E. Benazzi, Zeolites, 15 (1995) 507-516. [27] M. A. Makarova, A. E. Wilson, B. J. Van Liemt, C. M. Mesters, A. W. de Winter, C.
Williams, J. Catal., 172 (1997) 170-177.
[28] V. A. Veefkind, M. L. Smidt, J. A. Lercher, Appl. Catal. A, 194-195 (2000) 319-332. [29] O. Marie, P. Massiani, F. Thibault-Starzyk, J. Phys. Chem. B, 108 (2004) 5073-5081. [30] D. B. Lukyanov, T. Vazhnova, N. Cherkasov, J. L. Casci, J. Birtill, J. Phys. Chem. C,
118 (2014) 23918- 23929.
[31] J. L. Schlenker, J. J. Pluth, J. V. Smith, Mater. Res. Bull., 14 (1979) 751-758.
[32] M. Niwa, K. Suzuki, N. Katada, T. Kanougi, T. Atoguchi, J. Phys. Chem. B, 109 (2005) 18749-18757.
[33] P. A. Jacobs, W. J. Mortier, Zeolites, 2 (1982) 226-230.
[34] A. Sachse, A. Grau-Atienza, E. O. Jardim, N. Linares, M. Thommes, J. Garcia Martinez, Cryst. Growth. Des., 17 (8) (2017) 4289–4305.
[35] Z. Qin, G. Melinte, J.-P. Gilson, M. Jaber, K. Bozhilov, P. Boullay, S. Mintova, O. Ersen, V. Valtchev, Angew. Chem. Int. Ed., 128 (2016) 15273-15276.
[36] J. Pastvova, D. Kaucky, J. Moravkova, J. Rathousky, S. Sklenak, M. Vorokhta, L. Brabec, R. Pilar, I. Jakubec, E. Tabor, P. Klein, P. Sazama, ACS Catal., 7 (2017) 5781-5795.
[37] N. Chaouati, A. Soualah, M. Chater, M. Tarighi, L. Pinard, J. Catal., 344 (2016) 354-364.
[38] K. W. Kolasinski, J. Electrochem. Soc., 152 (2005) J99-J104. [39] J. S. Judge, J. Electrochem. Soc., 118 (1971) 1772-1775.
[40] G. A. Olah, J. T. Welch, Y. D. Vankar, M. Nojima, I. Kerekes, J. A. Olah J. Org. Chem., 44 (1979) 3872-3881.
[41] M. Guisnet, L. Pinard, Catal. Rev., 60 (2018) 337-436. [42] T. -C. Tsai, Appl. Catal. A: Gen., 301 (2006) 292-298.
[43] O. Marie, F. Thibault-Starzyk, P. Massiani, J. Catal., 230 (2005) 28-37.
[44] P. Ratnasamy, S. Sivankar, A. Vishnoi, J. Catal., 69 (1981) 428-433
[45] I. Bankos, A. L. Klyachko, T. R. Brueva, G. I. Kapustin, Reat. Kinet. Catal. Lett., 30 (1986) 297-302.
24
[46] M.W. Dem, J. M. Newsam, J. A. Creighton, J. Am. Chem. Soc., 114 (1992) 7198-7207.
[47] C. Miranda, J. Urresta, H. Cruchade, A. Tran, M. Bengahlem, A. Astafan, P. Gaudin, T. J. Daou, A. Ramírez, Y. Pouilloux, A. Sachse, L. Pinard, J. Catal., 365 (2018) 249-260.
[48] S.M. Babitz, B.A. Williams, J.T. Miller, R.Q. Snurr, W. O. Haag, H.H. Kung, Appl. Catal. A: Gen., 179 (1999) 71.
[49] T.F. Narbeshuber, H. Vinek, J. A. Lercher, J. Catal., 157 (1995) 388-395. [50] N.Chaouati, A. Soualah, M. Chater, L. Pinard, J. Catal., 353 (2017) 28-36.
[51] M. Tromp, J. A. van Bokhoven, M. T. Garriga Oostenbrink, J. H. Bitter, K. P. de Jong, D. C. Koningsberger, J. Catal., 190 (2000) 209-214.
25
Table and Figure captions
Table 1. Textural properties of the three catalyst series: Nax, Fx, and PyFx.
Table 2. Elemental analysis and acid properties of three catalyst series: exchanged with Na (Nax) and etched with HF in aqueous (Fx) and pyridine (PyFx) medium.
Table 3. Initial activity (A0), turnover frequencies of BAS probed by pyridine at 150 °C
(TOF), and ratio of residual/initial activity after 1h reaction (A60/A0) for
n-hexane cracking and toluene disproportionation. O/P and X/B molar ratio correspond to olefins/paraffins and xylenes/benzene, respectively.
Scheme 1. Structure of MOR presented along the 12MR and 8MR channels. The positions
of the framework O atoms and of the Na+ are highlighted. (Red: oxygen atoms, blue: T atoms, green: Na+ cations).
Scheme 2. Proposed Involvement of 8-MR in the toluene disproportionation.
Figure 1. TEM images of M10 (a, b and c), F1.5 (d, e and f) and PyF1.5 (g, h and i).
Figure 2. Infrared spectra in OH vibration region for selected Fx, Nax and PyFx samples
before (dotted line) and after pyridine adsorption followed by desorption at 150 °C (green line), 250 °C (purple) 350 °C (blue), and 450 °C (red).
Figure 3. Deconvolution of the hydroxyl region of IR spectra of parent mordenite and selected Nax, Fx, and PyFx samples using six single bands.
Figure 4. Low relative pressure ranges of the argon adsorption isotherms for: M10 (black), F (blue and red) and PyF (green and pink) samples.
Figure 5. Concentration of acidic hydroxyl groups measured from six deconvoluted bands of catalyst series: M10 (red symbol), Nax (violet), Fx (brown) and PyFx
(yellow) as a function of the Brønsted acidity probed by pyridine at 150 °C.
Figure 6. a) Transmittance spectra of pyridine HF solution of different concentration; b) Intensity of bands centered at the1458 (black) and 1872 cm-1 (red).
Figure 7. Toluene disproportionation rates (per gram) at 450°C in H-MOR (red symbol), Na+ exchanged (violet symbol), HF etched in aqueous (brown symbol) and pyridine (yellow symbol) media plotted against the density of Brønsted acid sites per gram in a) the 8-MR pockets of MOR, c) 12-MR channels of MOR and their intersection (b).
Figure 8. Activity of n-hexane cracking of the three catalyst series: Nax, Fx and PyFx as a
function of the concentration of Brønsted acid site probed by pyridine at 150 °C.
26
Figure 9. n-Hexane cracking activity as a function of the activity calculated with the
follows formula :
, where TOF of OH 12-MR and 8-MR are equal to 129 and 510 h-1, respectively and C correspond to their concentration obtained from the deconvolution of the OH band.
Supporting information
Table S1. Operating conditions for the three post-synthesis modifications.
Table S2. Height of the six deconvoluted bands of catalyst series: M10, Nax, Fx, and PyFx
and their percentual distribution in brackets. Scheme S1. Mechanism of toluene disproportionation.
Figure S1. XRD patterns of Fx (a) and PyFx (b) samples.
Figure S2. Nitrogen adsorption (full symbol) and desorption (open symbol) isotherms at
-196 °C of Na, Fx, and PyFx samples.
Figure S3. Amounts of Brønsted acid sites estimated from chemical analysis (overall acidity) and from pyridine adsorption (sites accessible) as function of degree of Na-exchange.
Figure S4. Amount of calculated hydroxyl groups from the six band deconvolution as function of the BAS determined by pyridine adsorption at 150 °C for the Na series.
Figure S5. Pore size distribution derived from mercury intrusion of HFaq and HFPy
samples (black: M10, blue: 0.5 M, green: 1.5 M).
Figure S6. Infrared spectra in OH vibration region for selected Fx, Nax and PyFx samples before (dotted line) and after pyridine adsorption followed by desorption at 150 °C (green line), 250 °C (purple) 350°C (blue), and 450 °C (red).
Figure S7. Molar yields as a function of the initial conversion for toluene
disproportionation (a) and n-hexane cracking (b) obtained on the three catalysts series.
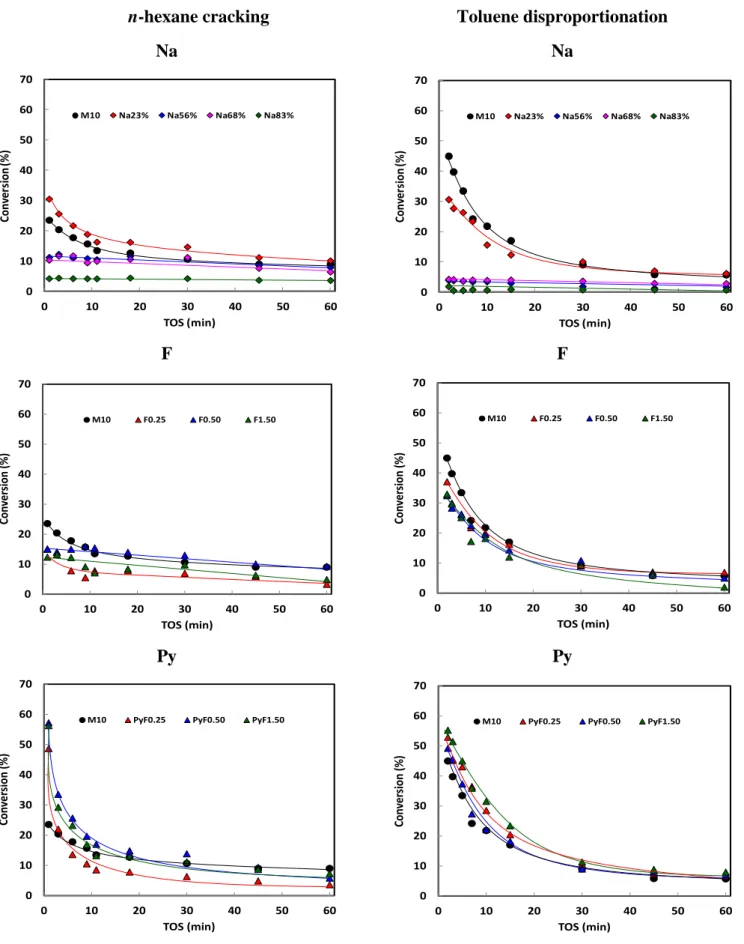
Figure S8. Conversion for toluene disproportionation and n-hexane cracking as a function of time-on-stream obtained on the three catalysts series.
Figure S9. C4/C2 (a) and C5/C1 (a) ratio as a function of the initial conversion for all
27
Table 1: Textural properties of the three catalyst series: Nax, Fx, and PyFx.
Catalyst Crystallinity CCSb Strainc Vmicrod Vmesoe Vmacrof
(%) (nm) cm3 g-1 M10 100 62.8 8.8 0.19 0.09 0.35 Na23% 0.18 0.09 Na56% 0.18 0.08 Na68% 0.16 0.10 Na83% 0.15 0.10 F0.25 70 39.0 14.7 0.17 0.08 F0.50 65 36.8 16.4 0.17 0.09 0.37 F1.50 57 32.0 19.4 0.18 0.13 0.44 PyF0.25 80 57.1 9.3 0.19 0.08 PyF0.50 84 57.3 9.3 0.16 0.12 0.41 PyF1.50 79 55.0 9.7 0.18 0.15 0.47
aMeasured by XRD analysis; b,c coherent crystal size, estimated by Williamson-Hall analysis; dEstimated by the t-plot method; eMesopore volume= V
total-Vmicro (Vtotal: determined from the adsorbed volume at P/P0= 0.96); g
28
Table 2: Elemental analysis and acid properties of three catalyst series: exchanged with Na (Nax) and etched with HF in aqueous (F) and
pyridine (PyF) medium.
Catalyst Si/Ala [Na]a [F]b [PyH+]c [PyL]c
[PyH
+] +2[PyL]
mol/mol
µmol g
-1 M10 9.0 0 1014 (1370)d 53 1120 Na23% 8.7 330 950 39 1028 Na56% 8.6 790 648 28 704 Na68% 8.8 950 425 15 455 Na83% 9.0 1130 201 14 229 F0.25 10.9 0 570 130 830 F0.50 12.1 0 560 143 846 F1.50 17.5 0 410 106 622 PyF0.25 8.6 0 740 96 932 PyF0.50 8.5 0 700 119 938 PyF1.50 9.0 0 0 820 127 107429
Table 3: Initial activity (A0), turnover frequencies of BAS probed by pyridine at 150 °C (TOF), and ratio of residual/initial activity after 1h
reaction (A60/A0) for n-hexane cracking and toluene disproportionation. O/P and X/B molar ratio correspond to olefins/paraffins and
xylenes/benzene, respectively.
n-Hexane cracking
(541 °C, 1 atm, PN2/PnC6 =9, = 0.04s )
Toluene disproportionation (420 °C, 1 atm, PH2/PTol =4, = 0.12s)
A0 O/P A60/A0 %Cokea A0 TOF X/B A60/A0 %Coke
mmol h-1 g-1 mol/mol mmol h-1 g-1 h-1 mol/mol
M10 145 1.0 0.38 7.7 100 99 (374) 0.19 0.13 4.6 Na23% 188 1.0 0.33 68 72 (398) 0.15 0.20 6.5 Na56% 69 1.7 0.72 8 6 (112) 0.05 0.42 4.6 Na68% 63 1.4 0.62 9 22 (360) 0.21 0.66 3.8 Na83% 26 1.6 0.85 4 20 / 0.35 3.5 F0.25 93 1.1 0.22 5.2 83 146 (965) 0.22 0.18 4.9 F0.50 92 1.2 0.62 5.8 72 125 (1241) 0.15 0.21 4.5 F1.50 76 1.1 0.36 3.4 73 177 (1659) 0.13 0.05 4.4 PyF0.25 299 352b 0.5 1.1b 0.07 0.15b 10.0 118 159 (929) 0.18 0.13 7.0 PyF0.50 352 0.9 0.12 11.4 110 156 (965) 0.23 0.15 6.7 PyF1.50 348 0.6 0.13 9.3 123 149 (953) 0.16 0.15 7.4
30
Schemes and Figures
Scheme 1: Structure of MOR presented along the 12-MR and 8-MR channels. The positions
of the framework O atoms and of the Na+ are highlighted. (Red: oxygen atoms, blue: T atoms, green: Na+ cations). O1 O9 O6 O5 O2 O3 O7 O10 I IV VI
31
32
Figure 1. TEM images of M10 (a, b and c), F1.5 (d, e and f) and PyF1.5 (g, h and i).
a b c
d e f
33
M10 Na83%
F1.5 PyF1.5
Figure 2. Infrared spectra in OH vibration region for selected Fx, Nax and PyFx samples
before (dotted line) and after pyridine adsorption followed by desorption at 150 °C (green line), 250 °C (purple) 350 °C (blue), and 450 °C (red). All spectra are aligned on the same scale. 3608 3605 3590 3590 3588 3745 3745 3618 3619 3622 3608 3606 3600 3599 3733 3745 3550 3600 3650 3700 3750 Wavenumber (cm-1) 3608 3606 3592 3588 3591 3745 3550 3600 3650 3700 3750 Wavenumber (cm-1)
34 M10 Na83% F1.5 PyF1.5 3608 3598 3587 3573 3608 3616 3626 3540 3580 3620 Wavenumber (cm-1) 3650 3618 3610 3603 3619 3628 3580 3600 3620 3640 Wavenumber (cm-1) 3570 3590 3610 3630 Wavenumber (cm-1) 3608 3596 3583 3607 3613 3621 3560 3580 3600 3620 3640 3608 3597 3589 3579 3616 3607 3624 Wavenumber (cm-1)
Figure 3. Deconvolution of the hydroxyl region of IR spectra of parent mordenite and
35
Figure 4. Low relative pressure ranges of the argon adsorption isotherms for: M10 (black), F
(blue and red) and PyF (green and pink) samples.
1E-6 1E-5 1E-4 1E-3
0 50 100 150 V (cm 3 g -1 STP ) P/P0 M10 F0.50 F1.50 PyF0.50 PyF1.50
36
Figure 5. Concentration of acidic hydroxyl groups measured from six deconvoluted bands of
catalyst series: M10 (red symbol), Nax (violet), Fx (brown) and PyFx (yellow) as a function of
the Brønsted acidity probed by pyridine at 150 °C.
0 250 500 750 0 400 800 1200 [OH] aci d ic (µ mol g -1) [H+] (µmol g-1) 0 250 500 750 0 400 800 1200 [OH] aci d ic (µ mol g -1) [H+] (µmol g-1) 0 250 500 750 0 400 800 1200 [OH] aci di c (µ mol g -1) [H+] (µmol g-1) 0 250 500 750 0 400 800 1200 [OH] aci d ic (µ mol g -1) [H+] (µmol g-1) 0 250 500 750 0 400 800 1200 [OH] aci d ic (µ mo l g -1) [H+] (µmol g-1) 0 250 500 750 0 400 800 1200 [OH] aci d ic (µ mo l g -1) [H+] (µmol g-1) 3581 cm-1
constrained OH : O1-H; O9-H
3590 cm-1
constrained OH : O1-H; O3-H
3599 cm-1
intsersection channel : O5-H
3609 cm-1
unconstrained OH : O2-H; O10-H
3617 cm-1
unconstrained OH : O3-H and O7-H
3625 cm-1
37
Figure 6. a) Transmittance spectra of pyridine HF solution of different concentration; b)
Intensity of bands centered at the1450 (black) and 1840 cm-1 (red).
1500 1700 1900 2100 Wavenumber (cm-1) Pyridine PyF0.25 1602 1581 1482 1450 1437 1840 PyF0.25 PyF1.50 PyF5.00 0 1 2 3 4 5 0.0 0.1 0.2 0.3 0.4 0.5 Intensity ( a.u.) [HF] (M) 1450 1840 b a
38
Figure 7. Toluene disproportionation rates (per gram) at 450 °C in H-MOR (red symbol), Na+
exchanged (violet symbol), HF etched in aqueous (brown symbol) and pyridine (yellow symbol) media plotted against the density of Brønsted acid sites per gram in a) the 8-MR pockets of MOR, c) 12-MR channels of MOR and their intersection (b).
0 30 60 90 120 150 0 50 100 150 200 250 Adisp . (mmo l h -1g -1)
[OH]acidic(µmol g-1)
0 30 60 90 120 150 0 50 100 150 200 250 Ad isp . (mmo l h -1 g -1)
[OH]acidic(µmol g-1)
Intesrsection OH 0 30 60 90 120 150 0 250 500 750 1000 Ad isp . (mmo l h -1g -1)
[OH]acidic(µmol g-1)
Unconstrained OH
a-Constrained OH
b-Intsersection OH
39
Figure 8. Activity of n-hexane cracking of the three catalyst series: Nax, Fx and PyFx as a function of the concentration of Brønsted acid site
probed by pyridine at 150 °C. 0 100 200 300 400 500 0 200 400 600 800 1000 A0 (mo l h -1 g -1) [H+] (µmol g-1) M10 Na F PyF MFI M10 M20
40
Figure 9. n-Hexane cracking activity as a function of the activity calculated with the follows formula :
, where TOF of OH 12-MR and 8-MR is equal to 129 and 510 h-1
, respectively and C correspond to their concentration obtained from the deconvolution of the OH band.
0 100 200 300 400 500 0 50 100 150 200 A(e xp .) (µ m o l g -1) A(theor.) (µmol g-1)
41
Supporting Information
Table S1. Operating conditions for the three post-synthesis modifications.
Catalyst Medium [Na] [HF] Time T Yield
mol/L/gzeolite °C % Na23% H2O 0.05 16 h 80 93 Na56% H2O 0.13 16 h 80 95 Na68% H2O 0.33 16 h 80 91 Na83% H2O 0.66 16 h 80 92 F0.25 H2O 0.25 6 min 25 83 F0.50 H2O 0.50 6 min 25 85 F1.50 H2O 1.50 6 min 25 45
PyF0.25 Pyridine 0.25 6 min 25 80
PyF0.50 Pyridine 0.50 6 min 25 78
PyF1.50 Pyridine 1.50 6 min 25 51
42
Table S2. Height of the six deconvoluted bands of catalyst series: M10, Nax, Fx, and PyFx
and their percentual distribution in brackets.
Main channel Intersection Side pocket
band (cm-1) 3625 3617 3609 3599 3590 3581 Relative extinction coeff : [27] 1 1.14 1.27 1.45 1.63 1.83 M10 0.158 (10.3) 0.40 (22.8) 0.62 (31.7) 0.40 (18.0) 0.31 (12.3) 0.14 (5.0) Na23% 0.21 (16.3) 0.47 (32.4) 0.45 (27.0) 0.21 (11.2) 0.21 (10.0) 0.08 (3.3) Na56% 0.05 (7.3) 0.26 (32.4) 0.29 (32.6) 0.18 (17.6) 0.11 (9.3) 0.011 (0.9) Na68% 0.04 (10.3) 0.19 (42.9) 0.11 (21.6) 0.11 (18.9) 0.04 (6.3) 0 (0) Na83% 0.04 (21.9) 0.09 (45.8) 0.05 (23.9) 0.02 (8.4) 0 (0) 0 (0) F0.25 0.07 (15.2) 0.14 (25.6) 0.15 (24.6) 0.12 (17.1) 0.10 (13.1) 0.04 (4.5) F0.50 0.027 (6.2) 0.09 (18.0) 0.22 (40.2) 0.14 (22.2) 0.07 (9.6) 0.03 (3.8) F1.50 0 (0) 0.10 (26.4) 0.14 (33.8) 0.13 (26.5) 0 (0) 0.08 (13.2) PyF0.25 0.07 (9.3) 0.14 (16.1) 0.34 (34.5) 0.26 (23.6) 0.12 (9.4) 0.1 (6.9) PyF0.50 0 (0) 0.25 (30.4) 0.34 (36.9) 0.18 (17.0) 0.14 (12.5) 0.04 (3.3) PyF1.50 0.05 (5.8) 0.31 (32.8) 0.27 (26.1) 0.24 (19.7) 0.14 (10.2) 0.08 (5.4)
43
44
F PyF
Figure S1. XRD patterns of Fx (a) and PyFx (b) samples.
M10 . F0.25 F0.50 F1.50 10 20 30 40 2 (degree) 10 20 30 40 2(degree) M10 PyF0.25 PyF0.50 . PyF1.50