• Aucun résultat trouvé

La limite de répartition supérieure de l'érable à sucre et du bouleau jaune sous contrôle climatique: étude dendroécologique le long d'un gradient d'élévation

N/A
N/A
Protected

Academic year: 2021

Partager "La limite de répartition supérieure de l'érable à sucre et du bouleau jaune sous contrôle climatique: étude dendroécologique le long d'un gradient d'élévation"

Copied!
79
0
0

Texte intégral

(1)
(2)

LA LIMITE DE RÉPARTITION SUPÉRIEURE DE L’ÉRABLE À SUCRE ET DU

BOULEAU JAUNE SOUS CONTRÔLE CLIMATIQUE : ÉTUDE

DENDROÉCOLOGIQUE LE LONG D’UN GRADIENT D’ÉLÉVATION

par

Benjamin Marquis

mémoire présenté au Département de biologie en vue

de l’obtention du grade de maître ès science (M.Sc.)

FACULTÉ DES SCIENCES

UNIVERSITÉ DE SHERBROOKE

(3)

Le 6 avril 2016

le jury a accepté le mémoire de Monsieur Benjamin Marquis

dans sa version finale

Membres du jury

Professeur Mark Vellend

Directeur de recherche

Département de biologie

Professeur Matthew Peros

Codirecteur de recherche

Bishop’s University

Professeur Isla Myers-Smith

Évaluateur externe

Edinburgh University

Professeur Bill Shipley

Président-rapporteur

Département de biologie

(4)

iii

SOMMAIRE

Dans un contexte de réchauffement climatique, il est prédit que les aires de répartition des

espèces autant végétales qu’animales se déplaceront plus au nord ou vers de plus hautes

élévations. Cependant, cette prédiction présume que le climat est la variable clé qui détermine

la limite de répartition des espèces. Puisque plusieurs autres facteurs environnementaux tels

que les interactions biotiques, la topographie et les caractéristiques du sol peuvent aussi

contrôler les limites de répartition des espèces ; départager l’effet de ces facteurs

environnementaux de l’effet du climat quant à contrôler les limites de répartition des espèces

permettra de mieux comprendre l’impact du réchauffement climatique sur les espèces et

d’affiner les prédictions sur le déplacement futur des aires de répartition des espèces.

Ce mémoire évalue le rôle que joue le climat quant à déterminer la croissance radiale à limite

de répartition supérieure de l’érable à sucre (Acer saccharum Marsh.) et du bouleau jaune

(Betula alleghaniensis Britt.) le long d’un gradient d’élévation au parc national du

Mont-Mégantic. Si le climat est le facteur principal contrôlant la croissance à limite de répartition

supérieure de ces deux espèces, nous prédisons qu’à haute élévation, la sensibilité de la

croissance face au climat devrait être plus forte qu’à basses élévations. Pour tester cette

prédiction, 62 érables à sucre et 72 bouleaux jaunes ont été échantillonnés le long de quatre

flancs de montagne couvrant ainsi l’aire répartition de chacune des deux espèces. Chaque site

d’échantillonnage était séparé par 50 mètres d’élévation et à chaque site, trois arbres par

espèces appartenant à trois différentes classes de diamètres soit petit (15-25 cm), moyen

(29-35 cm) et grand (> 40 cm), ont été échantillonnés lorsque présents. À l’aide de méthodes

dendroécologiques, des modèles de croissance-climat qui corrèlent chaque cerne de

croissance d’un arbre à des variables climatiques de l’année courante et de l’année d’avant sa

formation ont été développés. De cette façon, il a été possible de quantifier le niveau de

sensibilité de la croissance face au climat pour chacun des arbres. Pour l’érable à sucre, les

résultats ont montré que la sensibilité de la croissance au climat diminuait aux limites de

répartitions et était maximale à moyennes élévations. Pour le bouleau jaune, la sensibilité au

(5)

iv

climat n’a pas varié de manière significative avec aucune des variables testées (élévation,

topographie, indice de compétition). Spécifiquement, les températures maximales d’été

affectent négativement la croissance des érables à sucre de basses élévations alors qu’elles

affectent positivement la croissance des érables à sucre de moyennes et hautes élévations.

Toutefois, l’effet des températures maximales d’été n’est pas plus important pour la

croissance entre les arbres de moyennes et hautes élévations puisque les intervalles de

confiances autour des coefficients calculés à partir des modèles de croissance-climat se

chevauchent. Ces résultats sont en contradiction avec l’hypothèse générale que la sensibilité

de la croissance face aux variations annuelles du climat est plus forte à la limite de répartition

des espèces et pourrait suggérer que le climat n’est pas toujours la variable clé qui détermine

la limite de répartition des espèces. Toutefois, n’ayant pris en compte aucun paramètre

démographique il reste difficile de déterminer si la limite géographique des deux espèces à

l’étude est principalement sous contrôle climatique. Pour sûr, notre étude suggère que dans le

contexte de réchauffement climatique, la croissance des arbres de basses élévations est

susceptible de diminuer alors que la croissance des arbres de moyennes et hautes élévations

pourrait augmenter. Cependant, la capacité des deux espèces (particulièrement le bouleau

jaune) à migrer vers de plus hautes élévations afin de suivre le réchauffement climatique est

susceptible de dépendre autant des variables non climatiques que des variables climatiques.

Mots-Clés: dendroécologie, élévation, modèle croissance-climat, érable à sucre, bouleau

jaune, température.

(6)

v

REMERCIEMENTS

J’aimerais remercier mon directeur de recherche Mark Vellend ainsi que mon codirecteur

Matthew Peros pour leurs aides, conseils et supports qui ont grandement contribué à

l’acheminement de cette recherche. De plus, Isla Myers-Smith et Cédric Frenette Dussault qui

m’ont aidé pour les analyses statistiques et avec les codes de programmation du logiciel R. Je

tiens également à remercier Chelsey Paquette pour son aide à mesurer les cernes de

croissance des arbres ainsi que tous les membres des laboratoires Vellend et Peros que j’ai

côtoyés, notamment Geneviève Lajoie et Antoine Becker-Scarpitta. Je suis aussi

reconnaissant envers Camille-Antoine Ouimet et tous les membres du parc National du

Mont-Mégantic pour leur assistance. Finalement, je tiens à remercier le Conseil de recherches en

sciences naturelles et en génie du Canada (CRSNG), pour le financement de cette étude.

(7)

vi

TABLE DES MATIÈRES

SOMMAIRE ... III

REMERCIEMENTS ... V

TABLE DES MATIÈRES ... VI

LISTE DES ABBRÉVIATIONS ………IX

LISTE DES TABLEAUX ... X

LISTE DES FIGURES ... XI

CHAPITRE 1 ………1

INTRODUCTION GÉNÉRALE ... 1

1.1

L’importance des gradients d’élévation en biogéographie ... 3

1.2 Analyses dendrochronologiques ... 4

1.3 Objectif et hypothèse du projet de recherche ... 5

CHAPITRE 2 ………7

CLIMATE CONTROL ON SPECIES UPPER RANGE LIMIT: A DENDROECOLOGY

ANALYSIS OF TWO HARDWOOD TREE SPECIES IN SOUTHEASTERN CANADA,

QUÉBEC ... 7

2.1 Mise en contexte et contribution des auteurs ... 7

2.2 Abstract ... 8

2.3 Introduction ... 9

2.4 Materials and Methods ... 12

2.4.1 Study area ... 12

2.4.2 Sample collection ... 13

2.4.3 Sampling at the individual level ... 15

2.4.4 Dendroecological methods ... 15

2.4.5 Tree growth along the elevational gradient ... 16

2.4.6 Climate data ... 16

Important climatic time periods for tree growth ... 17

2.4.7 Sensitivity to climate………19

2.4.8 Analysis at the individual scale ... 19

Growth-climate relationships ... 19

(8)

vii

Importance of temperature and precipitation variables along the elevational

gradient………...20

2.4.9 Analysis at the site level (elevation zones) ... 21

Growth-climate relationships ... 21

Climate sensitivity along the elevational gradient ... 21

Importance of temperature and precipitation variables along the elevational

gradient……….………22

2.5 Results ... 22

2.5.1 Tree growth along the elevational gradient ... 22

2.5.2 Important climatic time periods for tree growth ... 24

2.5.3 Analysis at the individual tree scale ... 25

Growth-climate relationships ... 25

Climate sensitivity along the elevational gradient ... 26

Importance of temperature and precipitation variables along the elevational

gradient………27

2.5.4 Analysis at the site level (elevation zones) ... 28

Growth-climate relationships ... 28

Climate sensitivity along the elevational gradient ... 30

2.6 Discussion ... 31

2.6.1 Tree growth along the elevational gradient ... 31

2.6.2 Sensitivity of growth along the elevational gradient ... 31

2.6.3 Importance of climate variables for tree growth along the elevational gradient . 33

Individual level analysis ... 33

Site level analysis ... 33

2.7 Acknowledgements ... 36

2.8 References ... 36

CHAPITRE 3………...45

DISCUSSION ET CONCLUSION ... 45

3.1 Vers un changement dans le traitement des données dendroécologiques ... 47

3.2 Conlusion ... 48

ANNEXES ... 49

Appendix A ... 49

Appendix B ... .50

(9)

viii

Appendix D ……….…….52

Appendix E ………..……53

Appendix F ………..…54

Appendix G ……….…55

Appendix H ……….……57

Appendix I ………...……58

Appendix J ………...59

BIBLIOGRAPHIE ... 60

(10)

ix

LISTE DES ABRÉVIATIONS

Abréviation

Définition

Page

AIC

Akaike’s information criterion

18

AR1

Autoregressive model

16

DBH

Diameter at breast height

13

(11)

x

LISTE DES TABLEAUX

1. The number of trees sampled per species per elevation across the four

transects.………..…...13

2. Linear model results for predicting DBH as a function of elevation and age for both

sugar maple and yellow birch trees. Bold values are significant (p <

0.05).………...………..23

3. Summary of the climate variables that best predict radial growth of both species based

on the mixed effect models per elevation zone. For each climate variable, we also

show the percentage of trees for which their growth is impacted by that climate

variable (based on the individual analysis with the gls models and stepAIC

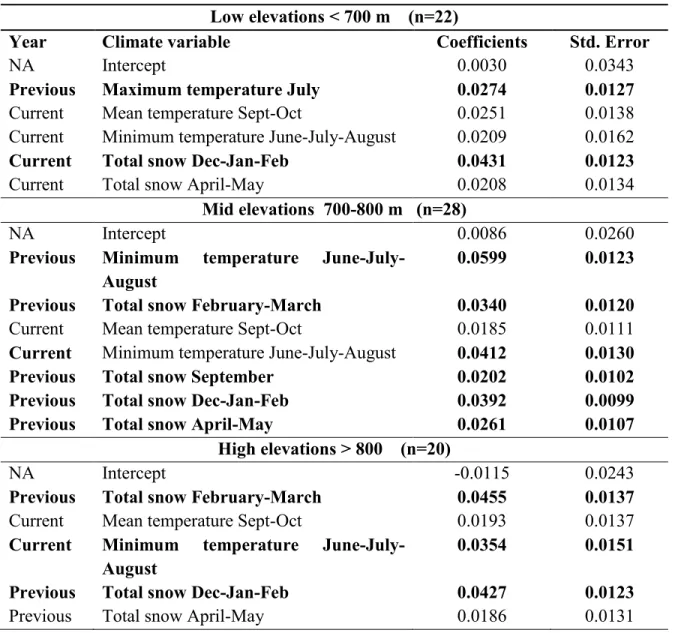
function)………...25

4. General linear model results predicting individual climate sensitivity (delta AIC) of

sugar maple trees as a function of elevation (n = 60 ; pseudo R

2

= 8.23)…………26

(12)

xi

LISTE DES FIGURES

1. Map of the study site. The black line indicates the park boundary; white represents

deciduous forest; light grey represents mixed forest; and darker grey represents

coniferous forest. The contour lines are set at 50 meter intervals. Sampling sites are

identified by red symbols (triangles, circles, squares and diamonds, which

differentiate the four transects). The top right zone encircled by the park limits

represents the Samuel-Brisson ecological reserve which has a higher protection status

than the rest of the national park………14

2. Diameter at breast height of individual trees of different ages at different elevations,

for both species. Each line represents the linear fit for diameter at breast height as a

function of age per elevational band (low <700, mid 700-800 and

high>800)……….24

3. Individual sensitivity of growth to climate (red circles) estimated by the delta AIC

method along the elevational gradient for both species. The black line and the grey

zone in the sugar maple panel represent the predictions and standard error of the

model predicting sensitivity of growth to climate by elevation from a quadratic

function (n=60 for sugar maple and n=70 for yellow birch).………...27

4. Result of the linear mixed effect models (estimated by REML) per elevation zone for

the four most important climate variables impacting sugar maple radial growth. Dots

represent the mean response of tree growth per elevation zone for each climate

variables and the bars represent the standard error. Climate variable impacting tree

growth in the current year are capitalized and climate variables impacting tree growth

in the previous year start with lower case letter. Climate variables are displayed in

order (left to right) from previous year to current year..29

(13)

xii

5. Result of the linear mixed effect models (estimated by REML) per elevation zone for

the four most important climate variables impacting yellow birch radial growth. Dots

represent the mean response of tree growth per elevation zone for each climate

variables and the bars represent the standard error. Climate variable impacting tree

growth in the current year are capitalized and climate variables impacting tree growth

in the previous year start with lower case letter. Climate variables are displayed in

order (left to right) from previous year to current year..30

(14)

1

CHAPITRE 1

INTRODUCTION GÉNÉRALE

L’environnement sélectionne les individus qui sont aptes à s’établir, survivre, croître et se

reproduire dans un certain environnement (Darwin, 1859). La niche écologique fondamentale

d’une espèce végétale dépend donc principalement de sa tolérance au climat et aux

différentes caractéristiques du sol (Hutchinson, 1957 ; Grinnell, 1917). Même si les

interactions biotiques telles que la compétition, la prédation et les relations symbiotiques

contribuent elles aussi à déterminer la limite de répartition des espèces (Ettinger et al., 2013 ;

Brown et Vellend, 2014 ; Herero et al., 2012 ; Doak et Morris, 2010 ; Mac Arhur, 1972), il

est généralement accepté que le climat est l’un des plus importants facteurs

environnementaux contrôlant les limites de répartition des espèces (Willig et al., 2003 ;

Rosenzweig, 1995 ; Rhode, 1992 ; Pianka, 1966 ; Darwin, 1859). Dans un contexte de

réchauffement climatique, il est prédit que la limite de répartition nordique ou de haute

élévation des espèces autant végétales qu’animales devrait s’étendre encore plus au nord ou

vers de plus hautes élévations, car les nouvelles températures plus élevées permettraient alors

l’établissement des individus dans un environnement qui était depuis lors inhabitable (Harsch

et al., 2009 ; Beckage et al., 2008 ; Penuelas et al., 2003 ; Dullinger et al., 2004 ; Hickling et

al., 2006 ; Perry et al., 2005 ; Vitasse et al., 2012). Cependant, la limite sud ou de basse

élévation d’une espèce devrait, elle, se contracter puisque les nouvelles températures trop

élevées devraient nuire à la survie et à la complétion du cycle de vie des individus, donc, les

individus au sud devraient être éliminés du nouvel environnement (Franco et al., 2006). Le

réchauffement climatique aurait donc comme impact de faire déplacer les aires de répartition

des espèces (Boisvert-Marsh et al., 2014 ; Parmesan, 2006 ; Kullman, 2001). Toutefois, cette

prédiction suppose que les limites de répartitions des espèces sont principalement

déterminées par le climat, ce qui ne doit pas toujours être le cas, car certaines études montrent

que l’aire de répartition de plusieurs espèces ne s’est pas déplacée comme prévu suivant le

(15)

2

réchauffement climatique (Sullivan et al., 2015 ; Zhu et al., 2012 ; Harsch et al., 2009 ; Rehm

et Feeley, 2013 ; Mathisen et al., 2014 ; Holtmeier et Broll, 2005). L’étude menée par Zhu et

al. (2014) n’a pu montrer que l’aire de répartition de 54 des 65 espèces d’arbres de forêt

tempérés du nord-est des États-Unis s’était déplacée vers le nord. Il faut toutefois considérer

que l’établissement d’espèces à hautes longévités, en l’occurrence des arbres, dans un

nouveau milieu pourrait prendre plus de temps que pour l’établissement de plusieurs espèces

herbacées. Donc, le manque d’indice supportant que les espèces d’arbres se déplacent vers le

nord ou à de plus hautes élévations comparativement aux indices montrant que les espèces

herbacées migrent vers le nord n’est peut-être qu’une question de temps.

Pour les espèces à haute longévité, cette prédiction est d’autant plus difficile à tester car il

faut une mesure de performance au niveau des paramètres démographiques (reproduction,

survie) pendant plusieurs années où les conditions climatiques varient, ce qui est un type de

données difficiles à collecter. Au lieu des paramètres démographiques, il est possible des

mesurer la croissance radiale annuelle des arbres et par des méthodes dendrochronologiques,

définir des relations croissance-climat qui sont basées sur des données à long terme (Fritts,

1976) et finalement, déterminer si les arbres croissent mieux ou moins bien sous la nouvelle

gamme de conditions climatiques (Huang et al., 2013). Advenant le cas où la croissance

serait favorisée par le nouveau climat, l’espèce devrait se maintenir dans le milieu, ce qui, au

long terme, pourrait augmenter ses chances de se propager et ainsi migrer vers le nord ou vers

de plus hautes élévations. Toutefois, cette hypothèse implique que le réchauffement

climatique affecte la croissance des arbres et que la réponse en croissance devrait être

maximale aux endroits climatiquement plus stressant tels qu’à la limite de leur aire de

répartition (Fritts, 1976). Donc, la sensibilité de la croissance annuelle en lien avec les

fluctuations annuelles du climat devrait augmenter à mesure où l’on se rapproche de la limite

de répartition des espèces (Ettinger et al., 2011 ; Galván et al., 2014).

Plusieurs études sur la croissance des arbres de l’hémisphère nord ont montré que les arbres

au sud de leur aire de répartition étaient positivement corrélés aux précipitations et

(16)

3

négativement corrélés à la température alors que les arbres au nord de leur aire de répartition

étaient positivement corrélés à la température (George et Ault, 2014 ; Bošel’a et al., 2014 ;

van der Maaten-Theunissen et al., 2013 ; Leal et al., 2007 ; Mäkinen et al., 2002 ; de Luis et

al., 2013). Il a aussi été montré que la force des relations croissance-climat dépendait de l’âge

de l’arbre, de son diamètre et de son environnement immédiat (Fang et al., 2015 ; Primicia et

al., 2015 ; Galván et al., 2014 ; Rozas et Olano, 2013 ; Carrer et Urbinati, 2004 ; Szeicz et

Macdonald, 1994). En effet, l’étude menée par Rozas et al. (2009) a montré que les individus

de l’espèce de conifère Juniperus thurifera L. de petits diamètres étaient plus sensibles à la

sécheresse que les individus de grands diamètres. Donc, analyser le patron de croissance des

arbres individuellement permet de mieux cibler quels sont les facteurs environnementaux qui

ont un impact sur la croissance des différents arbres d’une forêt, et permettrait donc de

développer des plans de gestion forestière qui tiennent compte de ces différences en

croissance (Clark et al., 2012 ; Primicia et al., 2015 ; Galván et al., 2014 ; Ettinger et al.,

2011). De plus, les analyses au niveau individuelles permettent aussi de déterminer comment

les facteurs environnementaux varient en importance le long de l’aire de répartition des

espèces (Ettinger et al., 2011 ; Primicia et al., 2015 ; Galván et al., 2014 ; Goldblum, 2010).

1.1 L’importance des gradients d’élévation en biogéographie

En tant que gradient climatique naturel, les gradients d’élévation sont largement utilisés dans

la littérature pour déterminer si les aires de répartition des espèces se sont déplacées vers de

plus hautes élévations suivant le réchauffement climatique (Savage et Vellend, 2015 ; Rehm

et Feeley, 2013 ; Beckage et al., 2008 ; Vitasse et al., 2012 ; Sundqvist et al., 2013). En effet,

les individus se trouvant près de leur limite supérieure de répartition vivent sous une gamme

de conditions environnementales (températures plus basses, conditions d’humidité plus élevée

et font face à une exposition au vent plus forte) plus stressantes que les individus vivants à

basses élévations (Körner, 2007). Si le climat est le facteur principal contrôlant la limite de

répartition supérieure des espèces, les fluctuations annuelles du climat devraient jouer un rôle

plus important quant à contrôler la survie et la croissance des individus de hautes élévations

(17)

4

que pour les individus vivants à plus basses élévations (Primicia et al., 2015 ; Galván et al.,

2014 ; Ettinger et al., 2011). De plus, comme l’aire de répartition des espèces est plus courte

le long du gradient d’élévation (centaines de mètres) que le long du gradient latitudinal

(centaines de kilomètres), les perturbations environnementales telles que les épidémies

d’insectes, les perturbations humaines et les feux de forêt risquent d’affecter plus

similairement la plupart des individus le long du gradient d’élévation que dans le cas de

gradients latitudinaux, diminuant ainsi le nombre de facteurs environnementaux causant

l’hétérogénéité du milieu. En plus de l’avantage logistique permettant d’échantillonner

plusieurs individus vivant dans des conditions climatiques différentes sur une courte distance,

l’utilisation des gradients d’élévations comme gradient climatique naturel permet de mieux

comprendre l’impact du climat quant à contrôler les limites de répartitions des espèces

(Primicia et al., 2015 ; Galván et al., 2014 ; Ettinger et al., 2011).

1.2 Analyses dendrochronologiques

L’analyse des cernes de croissance n’est pas simple car la croissance radiale d’un arbre n’est

pas égale le long de son tronc (Phipps, 1985 ; Lorimer, 1999). De plus, la croissance radiale

des arbres varie avec leur âge, leur écologie et leur stratégie écologique (Bowman et al., 2013

; Fritts, 1976 ; Helema et al., 2004). Pour départager l’effet des facteurs environnementaux de

l’effet ontogénique sur la taille des cernes de croissance d’un arbre, les dendrochronologistes

ont recours à des méthodes statistiques de détendances (Helema et al., 2004 ; Bontemps et

Esper, 2011 ; Peters et al., 2015). Dans un premier temps, une fonction mathématique servant

à imiter l’effet du développement ontogénique sur la taille des cernes de croissance est

développée à partir d’une fonction polynomiale ou d’une courbe régionale de croissance

(courbe qui relie la taille moyenne des cernes de croissance à leur âge cambial et qui est

constituée à partir d’arbre de différents âges pour une même année climatique) (Helema et al.,

2004 ; Bontemps et Esper, 2011 ; Peters et al., 2015). Puis, en deuxième temps, la mesure de

chaque cerne de croissance est divisée par la valeur de la fonction mathématique y

correspondant, ce qui transforme la série dendrochronologique en indice de croissance sans

(18)

5

unité (Helema et al., 2004). Une fois les tendances en croissance radiale reliées à l’âge de

l’arbre statistiquement contrôlé; il est supposé que les fluctuations restantes en croissance

radiale sont reliées aux facteurs environnementaux (Helema et al., 2004). En développant des

modèles de croissance-climat, on peut quantifier l’effet du climat sur la croissance des arbres

(Fritts, 1976) et ainsi déterminer si le climat augmente en importance pour la croissance des

arbres le long de l’aire de répartition des espèces (Ettinger et al., 2011 ; Primicia et al., 2015 ;

Galván et al., 2014 ; Goldblum, 2010).

Tout comme certaines études récentes (Ettinger et al., 2011 ; Galván et al., 2014 ; Primicia et

al., 2015 ; Myers-Smith et al., 2015a ; Myers-Smith et al., 2015b), notre étude diffère des

protocoles standard développés en dendrochronologie par Fritts (1976) et Phipps (1985) au

niveau des méthodes d’échantillonnage et des analysent statistiques. Au lieu de seulement

échantillonner les arbres vieux et de plus gros diamètres puis développer une chronologie

maîtresse qui représente la croissance moyenne de chacun des arbres d’un site, nous avons

échantillonné des arbres de différents diamètres et différents âges pour que notre échantillon

représente mieux la population cible (entièreté des arbres d’une forêt). Puisqu’il a été montré

que la force des relations croissance-climat est surestimée par les études dendroécologiques

développant des chronologies maîtresses (Carrer, 2011), nous avons analysé le patron de

croissance de chacun des arbres individuellement.

1.3 Objectif et hypothèse du projet de recherche

L’objectif du projet de recherche est de tester la prédiction que la sensibilité de la

performance en croissance chez les individus vivant à la limite nordique ou de haute élévation

devrait être plus fortement reliée aux fluctuations annuelles du climat que pour les individus

vivant au centre de leur distribution. Pour tester cette prédiction, nous avons échantillonné 62

érables à sucre et 72 bouleaux jaunes le long de quatre flancs de montagne au parc national

du Mont-Mégantic couvrant ainsi leur aire de répartition au site d’étude. Chaque site

d’échantillonnage était séparé par 50 m d’élévation et à chaque site, lorsque présents, trois

(19)

6

arbres appartenant à trois différentes classes de diamètres ont été échantillonnés. Puis nous

avons corrélé le patron de croissance de chacun des arbres à des variables climatiques de

température, pluie et neige. Nous avons testé les trois prédictions suivantes :

i)

La croissance radiale moyenne des arbres devrait diminuer à mesure où l’on

augmente en élévation.

ii)

La sensibilité de la croissance face aux fluctuations annuelles du climat devrait

augmenter à mesure où l’on augmente en élévation.

iii)

L’importance des variables climatiques mesurée comme étant la force de

corrélation (coefficients) des relations croissance-climat devraient varier le long

du gradient d’élévation. Spécifiquement, à hautes élévations, la force des

corrélations croissance-température devrait être plus forte qu’à basses élévations

alors qu’à basses élévations, la force des corrélations croissance-précipitations

devrait être plus forte qu’à hautes élévations.

(20)

7

CHAPITRE 2

CLIMATE CONTROL ON SPECIES UPPER RANGE LIMIT: A DENDROECOLOGY

ANALYSIS OF TWO HARDWOOD TREE SPECIES IN SOUTHEASTERN CANADA,

QUÉBEC

B. Marquis, M. Vellend, I. Myers-Smith, M. Peros

2.1 Mise en contexte et contribution des auteurs

Notre article teste si les individus vivant à la limite de répartition supérieure de leur espèce

sont bels et bien plus sensible au climat que les individus vivant au centre de leur répartition.

Cette supposition est généralement acceptée sans être testée et mène à la prédiction que dans

un contexte de réchauffement climatique, les espèces devraient migrer plus au nord ou vers

de plus hautes élévations. Cependant, ce phénomène de migration n’est pas toujours observé.

De plus, cet article se distingue par les méthodes d’échantillonnage utilisé qui

comparativement aux méthodes traditionnelles en dendrochronologie (l’échantillonnage

d’arbres vieux et à gros diamètre) échantillonne des arbres de trois diamètres différents.

Comme l’échantillon d’arbre analysé représente mieux la population cible (l’entièreté des

arbres de la forêt), les interprétations de l’étude sont plus facilement transférables et

applicables à l’entièreté des arbres d’une forêt. En outre, les relations croissance-climat de cet

article sont ajustées individuellement à chacun des arbres, ce qui permet de tenir compte de la

variation individuelle en croissance dans notre analyse.

Le premier auteur Benjamin Marquis a participé à la conception des protocoles

d’échantillonnages, de la prise de données terrains, des protocoles de laboratoires ainsi que

les mesures de cernes de croissance en plus des analyses statistiques et de la rédaction sous la

supervision toujours très avisé de son directeur de recherche, le professeur Mark Vellend

(Université de Sherbrooke) et de son codirecteur de recherche, le professeur Matthew Peros

(21)

8

(Bishop’s University). Isla Myers-Smith (Edinburgh Univeristy) a particulièrement aider au

niveau des analysent statistiques, des modèles de croissance-climat et des codes du logiciel

statistique R. Cet article sera soumis à la revue : Canadian Journal of Forest Research.

2.2 Abstract

Climate warming is widely expected to cause poleward or upward elevational shifts in

species range limits. This prediction assumes that climate is the key limiting factor

determining species ranges; however, range limits are also influenced by biotic interactions,

topographic and soil characteristics. Here we used dendrochronology to test predictions of

the hypothesis that climate as a higher impact on sugar maple and yellow birch radial growth

at their upper elevational range limit at our study site (Parc national du Mont-Mégantic). We

quantified the strength of relationships between annual tree ring widths and climate variables

across the elevational gradient, and we tested the prediction that individual sensitivity of

growth to climate would increase towards the upper range limit. For sugar maple, results

showed that sensitivity of growth to climate actually decreased at the range limit, from a

maximum at mid-elevations. For yellow birch, the sensitivity of growth to climate did not

vary significantly with any of the variables tested (elevation, topography and an index of

competition). While the importance of summer temperature in controlling sugar maple tree

growth increased from low to mid elevation it did not significatively increase between mid

and high elevations. These results are not consistent with the hypothesis that climate is the

primary variable controlling the radial growth of these species at the upper elevational range

limits. The capacity of both species (especially yellow birch) to migrate upslope in order to

track climate warming is likely to depend as much on non-climatic as climatic factors.

Keywords: dendroecology, elevation, climate-growth relationships, sugar maple, yellow

birch, southern Québec, temperature

(22)

9

2.3 Introduction

Climate warming is widely expected to cause poleward or upward elevational shifts in

species range limits (Boisvert-Marsh et al. 2014, Vitasse et al, 2012, Parmesan 2006,

Kullman, 2001). However, this prediction assumes that climate is the key limiting factor

determining species ranges. Since species range limits are also influenced by biotic (e.g.

competition, predation and parasitism) and abiotic (e.g. soil properties, topography and

disturbance events) variables other than climate (Sullivan et al. 2015, Ettinger et al. 2013,

Doak and Morris 2010, Lee et al. 2005), the determination of key environmental variables

limiting species ranges is a topic of both fundamental and applied importance. The

mechanisms by which species respond to climate warming by expanding or contracting their

ranges is still unclear (Zhu et al. 2014, Ettinger et al. 2011, Harsch 2009, Beckage et al. 2008,

Parmesan 2006).

The hypothesis that temperature limits species ranges was expressed by Darwin (1859) and

was further demonstrated by numerous ecological studies across latitudinal and elevational

gradients (Willig et al. 2003, Rosenzweig 1995, Rhode 1992, MacArthur 1972, Pianka 1966),

paleoecological studies which show that plant species abundance and temperature have

co-varied over thousands to millions of years (Cerling et al. 1997, White et al. 1997, Prentice et

al. 1991), experimental research showing increased plant growth with increased temperature

(Serreze et al. 2000, Arft et al. 1999, Chapin and Shaver 1996, Dawes et al. 2015, Lenz et al.

2013, Barbeito et al. 2012, Chung et al. 2013, Reich et al. 2015, Elmendorf et al. 2012) and

field-based evidence reporting a relationship between temperature change and tree migration

(Boisvert-Marsh et al. 2014, Vitasse et al. 2012, Harsch 2009).

However, abiotic and biotic variables can also influence species ranges by decreasing the

fitness of individuals above their range limits (Sexton et al. 2009; Hutchinson 1957). The

effect of these abiotic and biotic variables was shown in a recent study demonstrating that

while temperature appears to control the upper elevational limit of high elevation conifer

(23)

10

species, this is not the case for species that predominate at low- and mid-elevations (Ettinger

et al. 2011). In addition, predation on seeds and seedlings has been shown to impact species

establishment beyond current range limits, which in turn decreases the potential for future

range expansion (Brown and Vellend 2014, Herero et al. 2012). Other studies indicate that

competition (Ettinger and Hillerislambers 2013, Doak and Morris 2010), soil substrate

(Sullivan et al. 2015, Lafleur et al. 2010, St-Clair et al. 2008, Lee et al. 2005), site history

(Ogle et al. 2015, Zhang et al. 2014) and disturbance (Eisenlohr et al. 2013, Pylon and

Payette, 2014) could all be more important than climate in defining species range limits. For

example, by analysing the climatic niche of both seedlings and mature trees of 65 species in

the northeastern USA, Zhu et al. (2014) found no evidence of northward tree migration for 54

species. With other studies showing that plant species migration has not proceeded as fast as

climate warming (Savage and Vellend 2015, Rehm and Feeley 2013), it is clear that in

addition to climate, an interacting set of abiotic and biotic factors defines species range limits.

Studying the climate sensitivity of individuals in the core and at the edge of species

distributions allows testing of the effects of climatic vs. non-climatic variables in influencing

tree growth and in defining species range limits (Sanchez-Salguero et al. 2015, Primicia et al.

2015, Rozas 2015, Galván et al. 2014, de Luis et al. 2013, Clark et al. 2012, Ettinger et al.

2011).

One important prediction of the hypothesis that climate is the key determinant of growth at

range limit is that the sensitivity of growth to climate increases as the range limit is

approached (Ettinger et al. 2011, Galván et al. 2014, Myers-Smith et al. 2015a). This is a

difficult prediction to test given the need for some measure of performance during years with

different climate conditions. However, annual growth ring analysis provides a straightforward

method to measure individual variation in growth in relation to climate (Fritts, 1976). Many

dendroecological studies in the northern hemisphere have concluded that growth of trees in

cold environments (at the northern or upper elevation limit) is correlated positively with

temperature and growth of trees in hot and arid environments (southern or low elevation

limit) is correlated positively with precipitation and negatively with temperature (George and

(24)

11

Ault 2014, Bošel’a et al. 2014, van der Maaten-Theunissen et al. 2013, Leal et al. 2007).

Moreover, some dendroecological studies have estimated the impact of biotic (tree size and

competition) variables on the growth-climate relationships of trees and found that trees of

small diameter were more affected by drought than large mature trees, presumably because

their roots system is less well developed (Primicia et al. 2015, Galván et al. 2014, Rozas et al.

2009). Inter-tree competition could also weaken the growth-climate relationships because

trees growing under a high level of competition grow slower since they are more limited in

their capacity to acquire resources (e.g. light, space and nutrients) rather than by climate

(Rozas and Olano, 2013, Primicia et al. 2015). These studies highlight considerable

heterogeneity in growth-climate relationships between trees of the same species. Contrasting

with the classical dendrochronology protocol targeting larger and older trees (Fritts 1976,

Phipps 1985), sampling trees of different sizes and from different environments is of

fundamental importance in dendroecological studies aimed at predicting the drivers of

climate sensitivity itself (Carrer, 2011).

Elevational gradients are especially useful to test if individual sensitivity to climate increases

towards range margins because individuals can be sampled from different climate conditions

over a relatively short distance (Sundqvist et al. 2013). The present study was conducted in

Parc national du Mont-Mégantic in southern Quebec, Canada. This mountainous area is

covered by temperate deciduous forest at low elevations (500-900 m. a.s.l.) and conifer boreal

forest at high elevations (900-1100 m.). The two deciduous tree species selected for this study

were sugar maple and yellow birch because they are abundant deciduous tree species and

reach their upper elevational limits (850-900 m a.s.l.) within the study area. The hypothesis of

interest was that the upper elevational range limit of these two tree species is determined

primarily by climate. Based on this hypothesis, we tested two predictions: (i) average growth

should decrease with elevation; (ii) the sensitivity of growth to inter-annual climate

variability, temperature especially, increases with elevation.

(25)

12

2.4 Materials and Methods

2.4.1 Study area

The study site, Parc national du Mont Mégantic, is located in southeastern Québec, Canada,

in the Eastern Townships region (45° 27′ 25″ N, 71° 9′ 45″ W). This mountainous area is part

of the Monteregian Hills and sits within the sugar maple-yellow birch bioclimatic domain

(Ministère

des

Forêts,

de

la

Faune

et

des

Parcs

Québec;

https://www.mffp.gouv.qc.ca/forets/inventaire/inventaire-zones-carte.jsp).

Maximum

elevation is 1100 m. above sea level. Low elevation (550-800 m) forest stands are dominated

by sugar maple with yellow birch and beech (Fagus grandifolia Ehrh.) present at low

densities (Marcotte and Grandtner 1974). High elevation (900-1100 m) forest stands are

composed largely of balsam fir (Abies balsamea (L.) Mill.) and red spruce (Picea rubens

Sarg.) (Savage and Vellend 2015). In addition to temperature, both soil depth and pH

decrease with elevation (for a detailed description of the study site, see Marcotte and

Grandtner 1974).

For the purposes of this study, regional climate variables were calculated based on seven

weather stations (see supplementary materials for information on weather stations). Mean

annual temperature for the period 1950-2014 was 4.03 ± 0.84 °C; mean annual total rainfall

was 1033 ± 119 mm and the mean annual total snowfall was 336 ± 69 cm (see the

supplementary materials for further details). Based on two weather stations installed in 2012

at both ends of the elevational gradient (599 and 1089 m.) mean annual temperature decreases

at a lapse rate of 0.54°C per 100m of elevation, which represents a difference of 1.9 °C along

each species range distribution (see supplementary materials for information on weather

stations).

(26)

13

2.4.2 Sample collection

A total of 124 cores from 62 sugar maple trees and 144 cores from 72 yellow birch trees were

sampled for three diameter at breast height (DBH) categories (small: 15-25 cm, medium:

29-35cm, and large: > 40 cm) along four elevational transects established on four mountains

inside the national park (Fig. 1, Table 1). Two cores from each tree were sampled at breast

height, perpendicular to the slope angle, in order to avoid reaction wood (Fritts 1976, Phipps

1985). Based on Marcotte and Grandtner’s (1974) maps of past logging activities inside the

national park, transects were positioned in order to avoid the most recently disturbed areas.

Hence, the stands from which trees were sampled are believed to be minimally influenced by

human disturbance. For each transect, we started sampling at the lowest elevation possible

within the park limits. Sampling sites along each transect were set at the same approximate

elevations on each transect, separated by ~50 meters of elevation, up to the limit of each

species distribution (~550, 600, 650, 700, 750, 800, 850 and 900 m). At every sampling site,

if present, one tree per species per DBH class was cored. Sampled trees at each elevation

were separated by at least 15 meters. The x-y position of each tree was recorded with a

hand-held GPS and elevations were determined by a digital elevational model previously

developed by Brown and Vellend (2014) with the ArcGIS georeferencing software.

Table 1: The number of trees sampled per species per elevation across the four transects.

Elevation (m) Sugar maple Yellow birch

550

3

3

600

7

9

650

10

11

700

8

13

750

10

12

800

13

12

850

10

13

900

1

3

(27)

14

Figure 1: Map of the study site. The black line indicates the park boundary; white represents

deciduous forest; light grey represents mixed forest; and darker grey represents coniferous

forest. The contour lines are set at 50 meter intervals. Sampling sites are identified by red

symbols (triangles, circles, squares and diamonds, which differentiate the four transects). The

top right zone encircled by the park limits represents the Samuel-Brisson ecological reserve

which has a higher protection status than the rest of the national park.

(28)

15

2.4.3 Sampling at the individual level

In addition to focusing on elevation per se, we statistically tested for the effects of biotic (tree

height, age and competition) and topographic variables on the growth-climate relationships.

For each tree, we measured its height, age and the slope angle (%) where it was growing.

Competition intensity was estimated using the distance-dependant Hegyi competition index

(Hegyi 1974 in Radtke et al. 2003). The DBH of each potential competitor tree within a seven

meter radius was measured along with its distance to the focal tree (Hartmann et al. 2009).

Following Rozas (2014), only trees with DBH > 10 cm were considered as possible

competitors. The competition index was computed as follows:

Hegyi competition index = ∑

(

𝐷𝐵𝐻𝑗 𝐷𝐵𝐻𝑖

×

1 𝐷𝐼𝑆𝑇𝑖𝑗

)

𝑛 𝑗=𝑙

(1)

Where DBHj represents the diameter at breast height of each tree j, DBHi represents the

diameter of the focal tree i and DISTij represents the distance between the trees j and i.

2.4.4 Dendroecological methods

Tree cores were air dried, glued onto wooden mounts, sanded with paper grits ranging from

80 to 600 (Phipps 1985), and scanned at high resolution (6400 dpi). Measurement on the

resulting images was performed with WinDENDRO software (Version 2012b, WinDENDRO

2012) at a precision of 0.001 mm (Regent Instruments, Quebec City, Quebec, Canada). The

two cores from same tree were visually cross-dated and averaged. Statistical cross-dating was

then performed using the Dendrochronology Program Library (dplR) package in R, Version

3.0.2 (R Development Core Team 2013, Bunn 2010). While one study reported many missing

rings in sugar maple (Lorimer et al. 1999), many other studies on sugar maple, as in our

study, have not found this to be a problem for cross-dating (Long et al. 2009, Goldblum and

Riggs 2005, Duchesne et al. 2003, Tardif et al. 2001, Payette et al. 1996, Yin et al. 1994,

Lane et al. 1993, and Ryan et al. 1993). Therefore, we do not believe that missing rings

influenced our tree-ring chronologies.

(29)

16

The advantages and disadvantages of different detrending methods for climate growth

analysis (e.g., the statistical removal of temporal growth trends unrelated to year-to-year

climate fluctuations) are actively debated in the literature (Peters et al. 2015, Bontemps and

Esper 2011, Helema et al. 2004, Myers-Smith et al. 2015b). Here we applied three different

cubic smoothing splines with window lengths of 60, 32 and 20 years, and with a 50 %

frequency response (Hofgaard et al. 1999, Drobyshev et al. 2014, Galván et al. 2014) to each

individual tree ring series using the dplR library (R Development Core Team 2013, Bunn

2008). Each ring width measurement of a tree was divided by its corresponding predicted

value. All detrending methods yielded similar results, so to avoid overfitting issues, we used

the 60 year cubic smoothing spline in all subsequent analyses. For each tree, an

autoregressive model (AR1) was used to remove the temporal autocorrelation within the tree

ring data (Legendre and Legendre, 2012).

2.4.5 Tree growth along the elevational gradient

To test whether overall radial tree growth decreased with elevation, for each species, we used

linear models (GLM function in R) predicting DBH as a function of elevation, tree age and

their interaction (Zhang et al. 2014).

2.4.6 Climate data

Seven weather stations located within 50 km of the study site (Parc national du Mont

Mégantic) were used to develop a regional climate dataset (for details on each weather station

refer to the supplementary materials). Each station covers at least the 50 year period

1965-2014. The data consist of daily maximum, mean and minimum air temperatures (°C), total

rainfall (mm) and total snowfall (cm) which were converted into monthly data (averages for

temperature; sums for rainfall and snowfall). On average, nine percent of the daily values at

each weather station were missing. We did not directly calculate the monthly value for a

given climate variable at a given station if more than five days within the month contained

(30)

17

missing values or if three missing values were within the first seven days and last seven days

of the month. Given that at least four of the seven weather stations recorded climate variables

for any given day and that all stations were highly correlated for temperature data (r always >

0.9) and rain and snow data (r > 0.8), we predicted the missing monthly values for a given

station based on the climate data from all other stations using linear regression considering

the year, the month and the weather station as predictor variables. The adjusted R

2

values for

these models were 0.96 for temperature, 0.61 for precipitation and 0.70 for snow data.

Finally, the regional climate dataset was calculated by averaging the seven weather stations

together; this data set covered 1950 to 2014.

Important climatic time periods for tree growth

In order to identify climate variables most important for growth in our two study species, we

first defined 206 candidate variables encompassing primary variables averaged or summed

over different time periods. Calculations for the spring, fall and winter months were made for

five climate variables (maximum, mean and minimum average temperatures, total rainfall and

total snowfall) with the exception of the summer months, for which total snowfall was

omitted. Each variable was calculated for all individual months, for four three-month

“seasons” (spring: March-May, summer: June-August, fall: September-November, and

winter: December-February), for both two-month periods within each season (i.e., Dec.-Jan.

and Jan.-Feb. for winter), and for the dormant season (previous November to current March).

Finally, since growth mostly occurs in the early growing season (Tardif et al. 2001), an early

summer variable (May-June) was tested, in addition to an early spring variable

(February-March), given that freeze-thaw events during this time can affect radial growth of sugar

maple and yellow birch (Payette, et al. 1996, Comerford et al. 2012). Finally, because radial

growth is also known to be influenced by the previous year’s climate (Lane et al. 1993, Frits

1976), we also used climate variables for all time periods in the previous year as candidate

predictors of growth. Because climate variables are on different scales (temperature (°C),

precipitation (mm) and snow (cm)), prior analysis, all 206 climate variables were

(31)

18

standardized using traditional z-score method in order to maximise comparison of the effect

(coefficients) of the different climate variables on annual tree growth (Zuur et al. 2009).

To reduce the number of climate variables to be included in analyses of climate sensitivity, all

206 standardized climate variables were first regressed against each detrended and

standardized tree ring series. For each species, climate variables with a mean adjusted R

2

>

0.05 and R

2

> 0.05 for at least 20 % of the individual trees were retained for further analysis.

Adjusted R

2

= 0.05 was the average across all climate variables, and 20% is the approximate

average proportion of trees sampled per elevation band. Given that low and high elevation

trees can be affected by different climate variables (Primicia et al. 2015, Bosel’a et al. 2014,

Galván et al. 2014, van der Maaten-Theunissen et al. 2013, Ettinger et al. 2011, Savva et al.

2006, Leal et al. 2007, Filipo et al. 2007), a threshold value >20% would have run the risk of

missing variables important only at certain elevations. This process resulted in 27 variables

for sugar maple and 22 for yellow birch, many of which were strongly correlated since they

shared climate data from same months (e.g. maximum temperature in June-July and

maximum temperature in June-July-August). To further reduce the set of climate variables,

linear mixed effect models predicting tree growth from each of the correlated climate

variables were implemented in the R software with the lme4 package (R Development Core

Team 2013, Bates et al. 2014). Akaike’s information criterion (AIC) and evidence ratio (the

ratio between two model likelihood, which gives a measure of evidence in favour of a given

model relative to another model) were used to select the climate model that best predicted

tree growth from all the candidate models (Burnham et al. 2011) using the AICcmodavg R

package (R Development Core Team 2013, Mazerolle 2015). A model was retained as “final”

if it had a probability > 0.6 of being the best model; otherwise (if no one model had a

probability > 0.6), the model including the climate variable that covered the longest time

period (e.g., Dec.-Feb. instead of only Feb.) was selected given the greater information

content in such variables. After this process, the final set of climate variables was seven for

sugar maple and nine for yellow birch among which no pairwise correlations were >0.6, thus

minimizing potential convergence problems at the modelling stage (Zuur et al. 2009).

(32)

19

2.4.7 Sensitivity to climate

In this paper, sensitivity to climate refers to the capacity of annual tree growth to co-vary with

annual fluctuation in climate and is measured as the delta AIC between a null model

(intercept only) and a model containing climate variables. Since the delta AIC measures the

improvement of a model relative to another model, it is an adequate measure of sensitivity to

climate since it measures the improvement of adding climate variables in a model as

compared to a model that does not contain any climate variable (Myers-Smith et al. 2015,

Ettinger et al. 2011). Since 1-9 climate variables were included in a climate model, to further

analyse the effect each individual climate variable has on tree growth, we looked at the

coefficients and standard error for each of these climate variables. These coefficients

represent the strength of the association between the annual growth and the annual

fluctuations in the climate variable, which we will refer to as the importance of a given

climate variable for controlling tree growth. The bigger the coefficient is (positive or

negative) the more important the climate variable is in determining radial growth.

2.4.8 Analysis at the individual scale

Growth-climate relationships

To analyse climate sensitivity at the individual scale, each detrended and standardized tree

ring series was modelled as a function of the seven or nine chosen climate variables using

generalised least squared regression implemented in R with the nlme package (R

Development Core Team 2013, Pinheiro et al. 2013). The correlation structure in the tree ring

data was accounted for using an autoregressive model of type AR1 (Legendre and Legendre

2012, Zuur et al. 2009). To define the best climate predictors of growth for each tree,

stepwise backward model selection was performed using the stepAIC function in the MASS

package in R (Venables and Ripley 2002). This function finds the climate model with the set

(33)

20

of predictor variables that has the lowest AIC value by removing climate variables one at a

time until AIC increases. As a quantitative estimate of the climate sensitivity of growth that is

comparable among trees, we calculated the absolute value of delta AIC: the difference in AIC

values between the best climate model and the null model (see also Myers-Smith et al. 2015,

Ettinger et al. 2011).

Climate sensitivity along the elevational gradient

To test our prediction that individual climate sensitivity of growth should increase along the

elevational gradient, we modelled the delta AIC values as a function of elevation, while

controlling for competition and slope angle. Correlations among predictor variables were

<0.6. We used a generalised linear model (GLM) with a gamma distribution and a log link

function. To determine which variables impact individual sensitivity of growth to annual

climate variations, we performed a backward stepwise variable selection method. To test

linear vs non-linear trends in individual climate sensitivity of trees along the elevational

gradient, linear and quadratic terms for elevation were tested.

Importance of temperature and precipitation variables along the elevational gradient

To assess whether the number of trees impact by a climate variable varied along the

elevational gradient, we used binomial regressions (GLM function in R) testing if elevation

was a significant predictor of whether a tree was responsive (response variable = 1) or

unresponsive (response variable = 0) to a given climate variable. Responsiveness (1 or 0) was

determined based on whether or not the climate variable was in the best climate model for

that tree. We also tested for elevational trends in the direction of the effects of these climate

variables by regressing the coefficient (estimated with the restricted maximum likelihood

method (REML)) for a given climate variable (in the models described above) against

elevation.

(34)

21

2.4.9 Analysis at the site level (elevation zones)

Growth-climate relationships

To complement the individual-level analysis, all trees within a given elevation zone were

grouped together and used in separate growth-climate models for each zone (low elevation: <

700m, mid-elevation: 700-800m, and high elevation: > 800m). Following earlier studies

(Sánchez-Salguero et al. 2015, Galván et al. 2014, Ettinger et al. 2011), linear mixed-effect

models were used to incorporate the individual differences in radial growth response to

climate. These models were implemented in R with the lme function from the nlme package

(R Development Core Team 2015, Pinheiro et al. 2013). Since there are repeated measures

within the same individuals, the tree was set as a random effect. Again, we modelled temporal

autocorrelation using autoregressive (AR1) models (Legendre and Legendre 2012, Zuur et al.

2009). All seven and nine climate variables previously defined for each species were

incorporated into the linear mixed-effect models and backward stepwise variable selection

method was used to identify the set of climate variables most important for tree growth at

each elevation zone. Since p-values calculated for mixed effect models are biaised due to the

uncertainty on the sample size to use because of the hierarchical structure of the random

effect (Zuur et al. 2009), we removed a climate variable if the standard error of its coefficient

reached zero. Once the best model was identified, restricted maximum likelihood was used to

estimate the coefficients of the climate variables.

Climate sensitivity along the elevational gradient

The sensitivity of growth to climate was estimated per elevation zone by again calculating the

delta AIC between the best climate linear mixed effect model and the null model.

(35)

22

Importance of temperature and precipiation variables along the elevational gradient

To test if the strength of association between radial growth and temperature variables

increased towards higher elevations, we tested whether the confidence intervals of a given

temperature variable estimated with linear mixed effect models overlapped between elevation

zones. If so, temperature would not statistically differ in importance for tree growth between

elevations. We proceeded the same way to test if the association between growth and

precipitation variables were stronger at low elevations.

2.5 Results

2.5.1 Tree growth along the elevational gradient

For sugar maple, DBH increased with age. A negative interaction between age and elevation

suggests that trees of a given size are older at higher elevations (adjusted R

2

= 0.38, Table 2).

In essence, average tree growth declines with elevation (Fig. 2). For yellow birch, the

age*elevation interaction was not significant, although the qualitative trend was similar to

that of sugar maple (adjusted R

2

= 0.34, Table 2).

(36)

23

Table 2: Linear model results for predicting DBH as a function of elevation and age for both

sugar maple and yellow birch trees. Bold values are significant (p < 0.05).

Sugar maple (n = 60)

Variables

Coefficients Std. Error p-value

Intercept

-43.54

34.84

0.22

Elevation

0.075

0.046

0.11

Age

1.12

0.399

0.0067

Age * Elevation -0.0012

0.0005

0.022

Yellow birch (n=70)

Variables

Coefficients Std. Error p-value

Intercept

29.79

10.99

0.008

Elevation

-0.024

0.015

0.106

(37)

24

Figure 2: Diameter at breast height of individual trees of different ages at different elevation,

for both species. Each line represents the linear fit for diameter at breast height as a function

of age per elevational band (low <700, mid 700-800 and high >800).

2.5.2 Important climatic time periods for tree growth

For sugar maple, climate variables that best correlated with growth of the same year tended to

be the beginning and end of the growing season, whereas climate variables from the previous

year tended to be summer conditions (Table 3). For yellow birch, snow variables were more

important than for sugar maple. While not identical, some chosen climate variables represent

similar time periods, such as minimum July-August temperature for sugar maple trees and

minimum June-July-August temperature for yellow birch.

(38)

25

Table 3: Summary of the climate variables that best predict radial growth of both species

based on the mixed effect models per elevation zone. For each climate variable, we also show

the percentage of trees for which their growth is impacted by that climate variable (based on

the individual analysis with the gls models and stepAIC function).

Sugar maple

Year

Climate variable

Time period

%Trees

Current

Maximum temperature (°C)

December-January-February

21

Current

Total snow (cm)

March-April-May

24

Current

Minimum temperature (°C)

July-August

26

Current

Minimum temperature (°C)

September

24

Previous

Maximum temperature (°C)

June-July

37

Previous

Total rain (mm)

July-August

27

Yellow birch

Year

Climate variable

Time period

% Trees

Current

Minimum temperature (°C)

June-July-August

32

Current

Total snow (cm)

December-January-February

36

Current

Mean temperature (°C)

September-October

28

Current

Total snow (cm)

April-May

31

Previous

Maximum temperature (°C)

July

29

Previous

Total snow (cm)

February-March

28

Previous

Total snow (cm)

September

25

2.5.3 Analysis at the individual tree scale

Growth-climate relationships

For individual sugar maple trees, stepwise variable selection resulted in models including on

average two climate variables; for yellow birch, models included on average three climate

(39)

26

variables. Consistent with other studies of individual-level tree growth (Primicia et al. 2015,

Rozas 2014, Galván et al. 2014, Carrer 2011), climate variables accounted for a relatively

small proportion of the variance in growth: the mean pseudo R

2

for the gls models (calculated

following Griff and Stedinger 2007) was 0.08 ± 0.07 and 0.008 ± 0.1 for sugar maple and

yellow birch, respectively. Nonetheless, delta AIC between the best climate model and the

intercept-only model was > 2 for most trees (Fig. 3).

Climate sensitivity along the elevational gradient

Stepwise backward variable selection identified elevation as a significant predictor of climate

sensitivity in sugar maple (Table 4). The effect of elevation was unimodal, peaking at

mid-elevations (Fig. 3). Important to note, both the competition index and the slope did not impact

sensitivity of growth to climate. The detailed statistics on the variable selection procedure is

shown in appendix C. For yellow birch, no topographic or biotic variables were significant

predictors of sensitivity of growth to climate, see appendix D for the detailed statistics on

these models.

Table 4: General linear model results predicting individual climate sensitivity (delta AIC) of

sugar maple trees as a function of elevation (n = 60 ; pseudo R

2

= 8.23).

Variable

Coefficients

Std. Error

p-value

Intercept

1.47

0.1078

<2e-16

Elevation

3.48

1.71

0.044

Figure

Table 1: The number of trees sampled per species per elevation across the four transects
Table 4: General linear model results predicting individual climate sensitivity (delta AIC) of  sugar maple trees as a function of elevation (n = 60 ; pseudo R 2  = 8.23)
Tableau 5 : Tableau montrant le numéro d’identification des stations climatiques émises par  environnement  canada  (ID),  la  latitude,  la  longitude,  l’élévation  et  la  première  et  dernière  année utilisées pour les analysent subséquente pour chacu
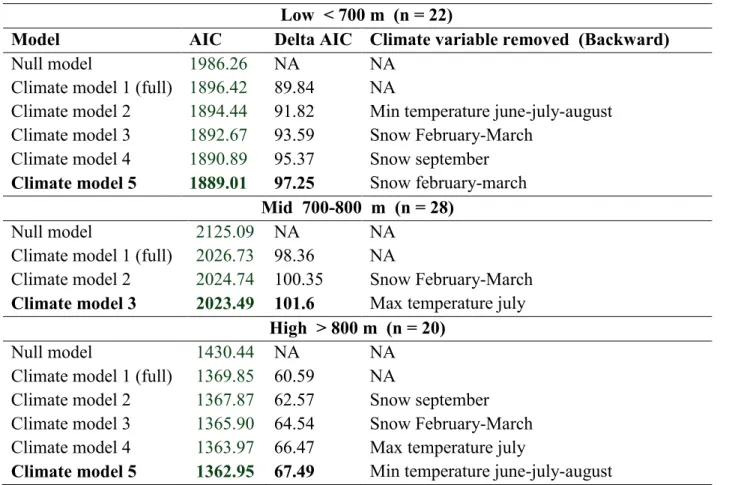
Tableau 6 : Résultat  de la sélection de variables  pas à pas de reculons pour l’analyse de la  sensibilité  de  la  croissance  radiale  face  aux  variations  annuelles  du  climat  pour  l’érable  à  sucre
+6

Références

Outline

Documents relatifs