HAL Id: hal-00297021
https://hal.archives-ouvertes.fr/hal-00297021
Submitted on 6 Jul 2007
HAL is a multi-disciplinary open access
archive for the deposit and dissemination of
sci-entific research documents, whether they are
pub-lished or not. The documents may come from
teaching and research institutions in France or
abroad, or from public or private research centers.
L’archive ouverte pluridisciplinaire HAL, est
destinée au dépôt et à la diffusion de documents
scientifiques de niveau recherche, publiés ou non,
émanant des établissements d’enseignement et de
recherche français ou étrangers, des laboratoires
publics ou privés.
region obtained in a three-member ensemble climate
change simulation experiment
S. O. Krichak, P. Alpert, K. Bassat, P. Kunin
To cite this version:
S. O. Krichak, P. Alpert, K. Bassat, P. Kunin. The surface climatology of the eastern Mediterranean
region obtained in a three-member ensemble climate change simulation experiment. Advances in
Geosciences, European Geosciences Union, 2007, 12, pp.67-80. �hal-00297021�
© Author(s) 2007. This work is licensed under a Creative Commons License.
Geosciences
The surface climatology of the eastern Mediterranean region
obtained in a three-member ensemble climate change
simulation experiment
S. O. Krichak, P. Alpert, K. Bassat, and P. Kunin
Department of Geophysics and Planetary Sciences, Raymond and Beverly Sackler Faculty of Exact Sciences, Tel Aviv University, Tel Aviv, Israel
Received: 27 February 2007 – Revised: 29 May 2007 – Accepted: 2 July 2007 – Published: 6 July 2007
Abstract. Two configurations of RegCM3 regional climate
model (RCM) have been used to downscale results of two atmosphere-ocean global climate model (AOGCM) simula-tions of the current (1961–1990) and future climates (2071– 2100) over the eastern Mediterranean (EM) region. The RCM domain covering the EM region from northern Africa to central part of Asia Minor with grid spacing of 50 km was used. Three sets of RCM simulations were completed. Re-sults of the RCM experiment support earlier projections of a temperature (annual precipitation) increase (decrease) to the end of 21st century over the EM. The roles of several major factors in controlling uncertainty of the climate change esti-mates are evaluated. The main uncertainty factors appear to be associated with possible inadequacies in RCM description of the EM-climate-controlling developments over remotely located areas as well as those in the simulations of the global climate and its trends by the AOGCMs.
1 Introduction
The Eastern Mediterranean region (hereafter EM) is charac-terized by sharp gradients of main climate parameters. The EM climate peculiarity is a joint consequence of the air-sea interactions, effects of regional topography and predominant wind directions causing air to dry-off during its way along the upwind slopes of the coastal zone. Significant for the EM climate is also the contribution of the large-scale cli-mate effects associated with the inter-annual displacements of the Hadley cell and the trends of the Asian-African mon-soon (Bedi et al., 1976). An impressive manifestation of the dependency is the well-known uneven character of annual distribution of precipitation over the southeastern EM, with practically all the precipitation falling out during the cool
Correspondence to: S. O. Krichak
season. A positive correlation of the EM precipitation with the indices of the east Atlantic – western Russia anomaly pat-tern (Krichak and Alpert, 2005) demonstrates the role of the weather processes over Europe in the EM climate. Intense EM precipitation events are usually associated with a south-ward propagation of the polar front jet and its interaction with the upper-troposphere subtropical jet stream. Such synop-tic situations are often characterized by formation of poten-tial vorticity (PV) streamer systems, penetration of Arctic air masses and intensification of the tropical-extratropical inter-actions over the region (Alpert et al., 2006; Krichak et al., 2007). Significance of the long-distance dependencies for understanding the EM climate and especially the EM precip-itation regimes appears evident.
The peculiarity of the EM climate is also important for its hydrodynamic simulation. Relatively low-resolution (150– 300 km) of contemporary atmosphere-ocean global climate models (AOGCM) precludes accurate representation of the small-scale effects. A limited number of efforts on run-ning regional climate models (RCM) driven from the lateral boundaries by the AOGCM (or reanalysis) data to downscale them over the EM region has been undertaken (Alpert et al., 20071; Evans et al., 2004; Giorgi et al., 2004a; Krichak and Alpert, 2004; Krichak et al., 2005; Pal et al., 2007). Although the simulations describe the main features of the EM climate, a number of problems remain unsolved. Among those the ability of the contemporary systems to reproduce frequency and intensity of occurrence of extreme precipitation, temper-ature and wind events remains insufficient. A positive bias in representation of summer air temperatures over arid areas has been reported (Krichak at al., 2005; Pal et al., 2007). The RCM simulations are affected by an insufficient accuracy of
1Alpert, P., Krichak, S. O., Osetinsky, I., Dayan, M., Haim,
D., and Shafir, H.: Climatic trends to extremes employing regional modeling and statistical interpretation over the E. Mediterranean, Global Planet. Change, submitted, 2007.
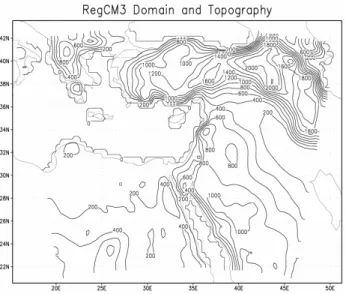
Fig. 1. Model domain and topography Units are m and the contour
interval is 100 m.
description of different controlling the EM climate factors leading to an uncertainty in the modeling results.
Application of the RCM approach is also an accepted strat-egy for determination of the regional effects of the global cli-mate change (e.g. Christensen and Christensen, 2003; Giorgi et al., 2004b). Limitations in accuracy of an RCM simulation of the current climate over a region seem to be also leading to uncertainty in the estimates of the future climate change with the same model. In addition to the uncertainties derived from model formulations also those derived from natural cli-mate variability and future atmospheric emissions are usually addressed (Christensen and Christensen, 2003). Additional efforts for determination of the main active factors and their relative contribution in the RCM simulations are required.
A multi-model approach has been adopted in a European climate modeling effort under the EU PRUDENCE Project (Christensen and Christensen, 2003; Giorgi et al., 2004a, b; Deque et al., 2005). In this project the EM area was covered however by only one of the RCM experiments (Giorgi et al., 2004a, b). A similar strategy for performing hydrodynamic simulation of the EM climate has been applied in the current study.
2 Experimental design
The primary aim of the effort was to determine directions for future optimizations of the RCM system at Tel Aviv Univer-sity (TAU). The evaluations are focused on quantification of uncertainties in the modeling results due to (a) the RegCM3 internal variability and (b) quality of the driving data in the climate projections. Additional mechanisms leading to un-certainties in the results are those associated with (mainly computationally induced) oscillations in the AOGCM data
as well as long-term natural variability of the real climate. It is assumed here, that the oscillations are filtered out by the time-averaging of the 30-year RCM data.
The RegCM3 model (Pal et al., 2007) of the International Center for Theoretical Physics (ICTP), Trieste, Italy has been adopted. A three-member ensemble RCM experiment has been realized. The EM climate during the current (CT, 1961– 1990) and future (2071–2100, A2 and B2 IPCC 2000) 30-year periods was simulated. To account for effects of un-certainty due to different formulations of driving data, the boundary data used were from two climate simulation experi-ments, with the UK Met. Office Hadley Center HadCM3, ad-ditionally downscaled with a global atmosphere-only model (HadAM3P), forced by surface boundary conditions (sea-surface temperature and sea-ice fraction) from HadCM3 (Johns at al., 2003) and observations and NASA Finite Vol-ume FV-GCM global atmosphere-ocean models (Atlas et al., 2005).
The A2 and B2 (IPCC 2000) scenarios were adopted in the experiment. According to the IPCC A2 scenario global CO2
emissions will increase by more than fourfold over their 1990 level to 2100 (CO2concentration of about 850 ppm by 2100)
A less intense CO2emission is projected to the 21st century
by the B2 scenario CO2concentration of about 600 ppm by
2100. Within the full range of the IPCC emission scenarios, the A2 lies towards the upper end, while the B2 scenario lies towards the lower end. The two scenarios encompass about half of the IPCC emission scenario range. Only one future climate (A2 scenario) simulation experiment was performed with the FV-GCM. The A2 and B2 (IPCC 2000) scenarios were adopted in the HadCM3-HadAM3P experiments. Fi-nally, it must also be noted that new observation data (Rau-pach et al., 2007) demonstrate a more intense than expected by the B2 scenario CO2 emission during the first years of
21st century.
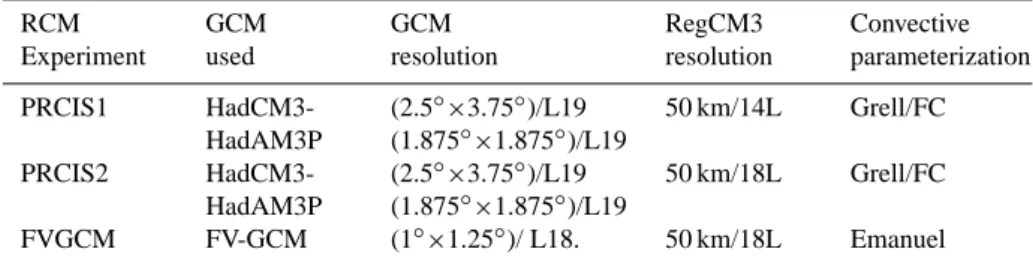
The same model domain covering a significant part of the EM from northern Africa to central Asia Minor with the grid-spacing of 50 km (Fig. 1) was used in all the simulation runs. To account for uncertainties due to different active factors three RCM runs performed were characterized by different model setups. Two of the runs (PRCS1 and PRCS2) used HadAM3-based driving data and one of them (FVGCM) – the FV-GCM ones. Prameterization of chemistry/aerosol ef-fects was not activated. Additional details of the RCM and AOGCM simulations are given in Table 1.
In the following, unless otherwise specified, we refer to the term “change” as the difference between the selected climate statistics in the scenario (2071–2100) and reference (1961–1990) simulations. Both results of simulation of the current EM climate and its future change due to the anthro-pogenic emission of greenhouse gases (GHG) are discussed here. In accordance with this, the simulated current climate patterns of several meteorological parameters and those of the changes projected to the end of 21st century are discussed below in comparison to the observation data available.
Table 1. Characteristics of the simulation experiments. RCM Experiment GCM used GCM resolution RegCM3 resolution Convective parameterization PRCIS1 HadCM3-HadAM3P (2.5◦×3.75◦)/L19 (1.875◦×1.875◦)/L19 50 km/14L Grell/FC PRCIS2 HadCM3-HadAM3P (2.5◦×3.75◦)/L19 (1.875◦×1.875◦)/L19 50 km/18L Grell/FC FVGCM FV-GCM (1◦×1.25◦)/ L18. 50 km/18L Emanuel 3 Results
3.1 Simulation of current climate
Evaluation of the RCM-produced long-term (30 year) mean patterns of summer and winter distributions of near-surface air temperatures, winds, net absorbed short-wave radiation and annual precipitation over the northern (southern Turkey), central (Lebanon, Syria and Israel) and southern (Egypt, Palestinian Autonomy area and Israel) parts of the EM is performed below in comparison to the 30-year mean (1961– 1990) data from the Climate Research Unit (CRU) of the University of East Anglia, UK (Mitchell et al., 2004). The CRU data are available with 0.5◦spacing based on the
obser-vations from land stations only. The fact additionally compli-cates evaluation of the RCM results over Sea areas. It must be noted here, that no validation of results of simulation of the surface wind and radiative fluxes over the region was per-formed earlier (Christensen and Christensen, 2003; Evans, 2004; Giorgi et al., 2004a, b).
3.1.1 Air temperature
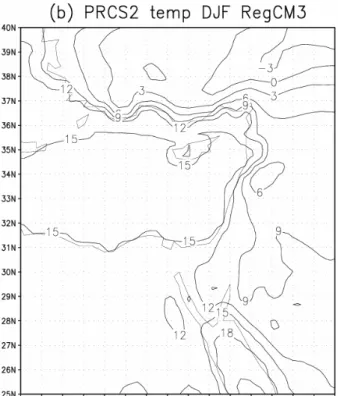
The long-term mean winter (December-January-February, DJF) near-surface air temperatures simulated in the PRCS1, PRCS2 and FVGCM experiments are presented in Figs. 2a– c, respectively. The corresponding CRU air temperatures are given in Fig. 2d. A small negative (∼1◦C) bias characterizes
the model-produced winter temperatures over the northern part of the region in the PRCS1 and PRCS2 results (Figs. 2a, b). The FVGCM results (Fig. 2c) are characterized by a pos-itive (∼3◦C) bias however. An overestimation of the DJF
temperatures is also found in the FVGCM results (Fig. 2c) over the central part of the EM, whereas the PRCS1 and PRCS2 data (Figs. 2a, b) quite accurately represent the real temperatures here. A good agreement between the model-produced and observed DJF temperatures is found over the southern part of the region in all the three experiments.
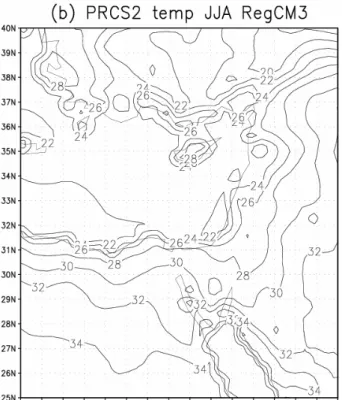
Results of simulation of the summer (June-July-August, JJA) near-surface air temperatures and CRU data are pre-sented in Figs. 3a–d, respectively. A positive (∼2◦C) bias
characterizes the simulated JJA temperatures over the north-ern part of the EM region in the PRCS1 and PRCS2 data
(Figs. 3a, b). The FVGCM results (Fig. 3c) are character-ized by a more significant (∼3–5◦C) positive bias. Also
positive (∼4◦C) temperature bias is found in the
FVGCM-based RCM results (Fig. 3c) over the central part of the EM, whereas results of the PRCS1 and PRCS2 (Figs. 3a, b) repre-sent real data with only a small positive bias here. The warm area simulated south of Cyprus in PRCS1 experiment is not found in results of the other two experiments (Figs. 3b, c) and is not supported by the observations (Fig. 3d). The spot appears to be a model artifact, possibly indicating an insuf-ficiency of the vertical resolution in the experiment. Over the southern part of the region the model overestimates the JJA temperatures by about 2◦C in the PRCS1, PRCS2
periments, but the temperatures produced in the FVGCM ex-periment are higher than those observed by about 4◦C.
Fur-ther remark about the temperature biases is given in next sub-section, in connection to the precipitation results.
3.1.2 Annual precipitation
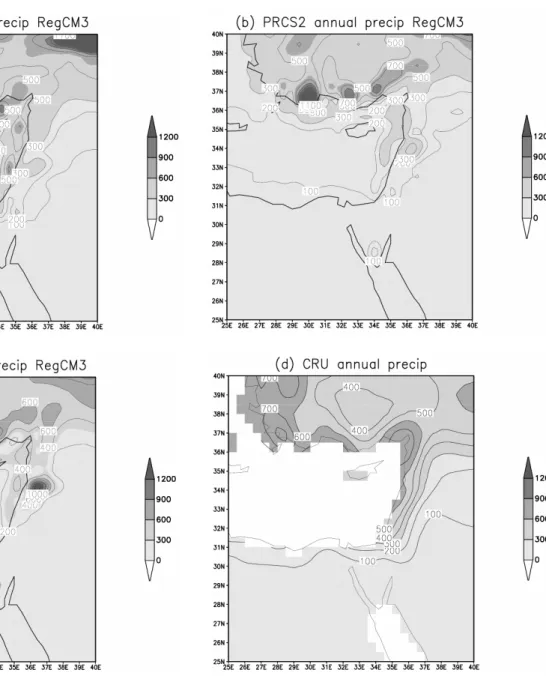
Long-term mean annual precipitation CT patterns from the PRECS1, PRECS2 and FVGCM experiments as well as the corresponding CRU-based pattern are given in Figs. 4a–d, respectively. The four figures are quite similar in their major details. It must be noted however that the RCM experiments performed did not reproduce the sharp east-west gradient of the real precipitation distribution. Over the land areas the modelling results are characterized by a negative bias. Most successfully the CT EM annual precipitation is simulated in the FVGCM experiment (Fig. 4c). At the same time, the CT precipitation over the northern part of the EM is better reproduced by the PRCS2 experiment (Fig. 4b). Over the central EM results of the PRCS1 (Fig. 4a) experiment are closer to the real pattern than those of the PRCS2. Too high precipitation amounts are simulated in FVGCM experiment over a number of locations, including that over the mountain-ous area at the Lebanon-Surya border however. The higher amount of the FVGCM-based annual precipitation may be explained by the increase of the air-moisture content due to the positive temperature bias detected. The earlier noted bi-ases in the summer and winter FVGCM-based temperatures could be caused by an excessive intensity of the warm air-mass influx from the lateral boundaries.
Fig. 2. December-January-February long-term mean near surface air temperature (◦C) produced in (a) PRCS1, (b) PRCS2, (c) FVGCM experiments and (d) CRU data.
Fig. 4. Same as in Fig. 2 but for annual precipitation (mm).
3.1.3 Wind
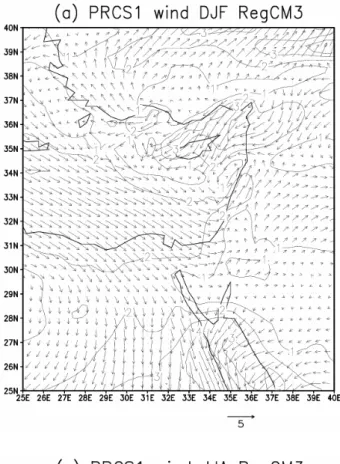
The following discussions are limited by evaluation of re-sults of the PRCS1 only. The model simulated winds are presented in Figs. 5a–d. The DJF and JJA winds are pre-sented in Figs. 5a and c. The corresponding CRU data (only wind intensity data are available from the CRU archive) are given in Figs. 5b and d. Simulated DJF wind pattern (Fig. 5a) is characterized by mild west-north-westerly winds over the southern EM, westerly, south-westerly winds over central EM, southern and south-eastely winds over northern EM and relatively strong north-easterly winds (∼4 m s−1)over
north-eastern part of the Mediterranean Sea area. The most intense (>4 m s−1)are found over the north of Cyprus area of the
Sea. Due to the use of land only data by the CRU, the wind maximum may not be found in Fig. 5b. Over land regions however, intensities and location of the areas with simulated wind maxima over northern and southern EM are in good agreement with the observations. The EM JJA air flow pat-terns are similar to that of DJF in the southern and central parts of the area but significantly differ over the northern EM where northerly, north-easterly winds are found in the model simulated pattern (Fig. 5c). Positioning of the wind maxima areas over northern part of central EM and Red Sea area may be noted in the figure. Locations of the simulated areas with wind maxima are in reasonably good agreement with the CRU data (Fig. 5d).
Fig. 5. Near surface winds directions and magnitudes (given by shadings and arrows’ length) (a, c) simulated for DJF, JJA seasons, (b, d)
3.1.4 Radiative flux
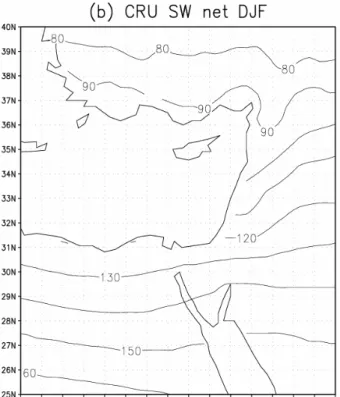
Radiative fluxes are an important climate component. The model simulated patterns with the net absorbed short-wave DJF and JJA radiation are presented in Figs. 6a and c, respec-tively. Corresponding verification data are given in Figs. 6b and d. Simulated DJF net absorbed SW pattern (Fig. 6a) is characterized by a large enough latitudinal gradient of the flux (∼100 W m−2). A different (east-west)
orienta-tion of the SW flux gradient characterizes the JJA simulated (Fig. 6c) and observed (Fig. 6d) patterns over the EM region. The model successfully reproduces the observed pattern over most of the area. A slight negative bias may be noted over the eastern boundary area. The bias may be resulting from an insufficient accuracy of the driving data.
3.2 Future climate change
Expected changes of a number of climate parameters due to the anthropogenic emission of greenhouse gases in the EM region have been discussed by Giorgi et al. (2004b) based on results of RCM simulations at the ICTP (using a dif-ferently configured RegCM model) driven by results of the same AOGCM – HadCM3 experiment (downscaled with a different AGCM – HadAM3H). Main results of our RCM ex-periment are in agreement with those of Giorgi et al. (2004b). In particular, both (Giorgi et al., 2004b and our (not pre-sented) climate change experiments project a 20% decrease in amount of DJF precipitation and increase of DJF (up to 3◦.) as well as JJA (up to 4–5◦.) temperatures over the
cen-tral EM. In the current study only results of simulation of the simulated changes in the surface wind and net absorbed so-lar radiation patterns are presented. The information is given in the form of patterns representing the mean future (2071– 2100) and current (1961–1990) differences between the fu-ture (A2 scenario) and CT as well as A2 minus B2 climate conditions.
3.2.1 Wind
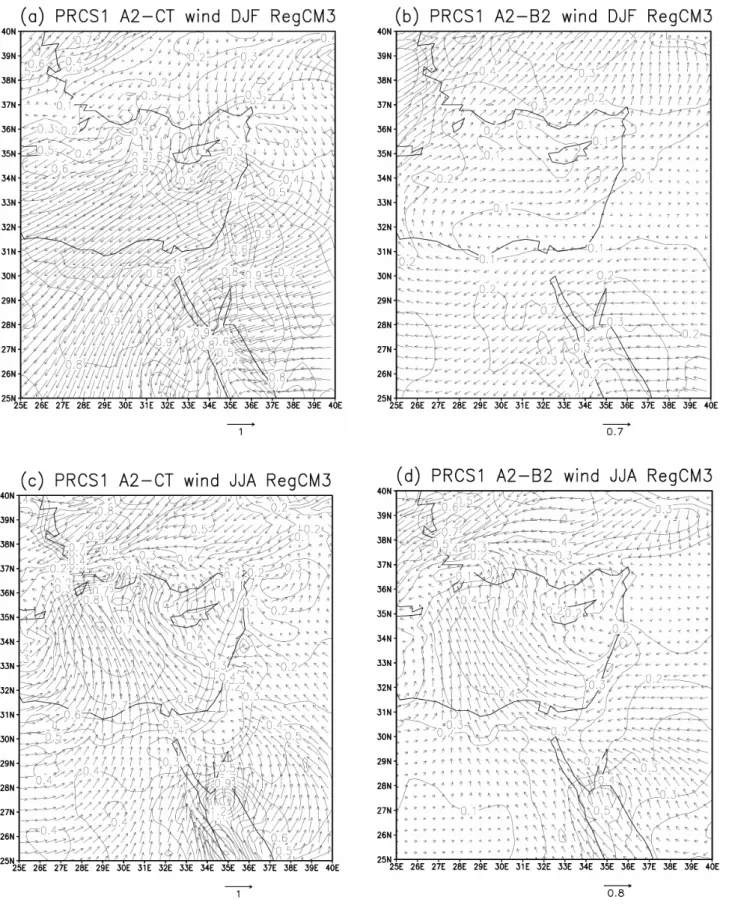
The model simulated A2-CT changes in 30-year mean DJF wind patterns are presented in Fig. 7a. The corresponding A2-B2 differences are given in Fig. 7b. The results demon-strate a large enough (∼1 m s−1)decrease in intensity of the
south-westerly air-flow over the central EM region due to the climate change process both the case of A2 and B2 scenarios of the climate change. The wind intensity change is appar-ently among the factors partly responsible for the projected decrease in DJF precipitation. A similar DJF wind climate change effect is projected by the model experiment for the southern EM region. Over the north-eastern part of the Sea area the projected A2-scenario climate change is associated with a 0.5 m s−1intensification of the northerly air-flow over
the area of the Cyprus Island. The change may mean an in-crease in cyclogenetic activity over the climatologically
sen-sitive area (Krichak et al., 2006) and that in intensity of ex-treme precipitation events in the area. Additional analyses and higher-resolution RCM simulations may be required to investigate the issue.
The corresponding JJA changes in the wind patterns are given in Figs. 7c, d. The climate change experiment con-sistently projects a ∼1 m s−1weakening of the westerly
air-flows over the central and south-eastern parts of the EM re-gion. The process may be representing the earlier mentioned significant air-temperature increase in the area due to the cli-mate change process.
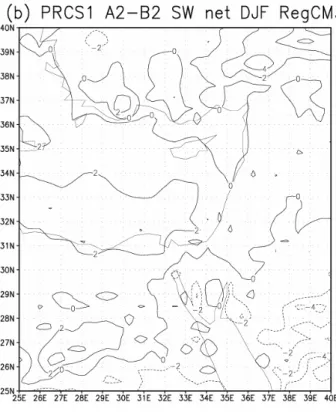
3.2.2 Radiative flux
The experiment’s results for the net absorbed SW radiative flux are given in Figs. 8a–d. According to the pictures pre-sented an increase in the solar radiation flux is expected (both in the case of A2 and B2 scenarios) over the northern part of the region. The increase is of about 25% (up to 20 W m−2)
over the northern part of the area, whereas over the cen-tral EM it is much smaller (∼5%). For the JJA period the RCm experiment consistently projects a quite insignificant increase in the radiative flux over the northern part of the re-gion. Over the central EM no changes are projected. Over the southern part of the region a slight decrease in the flux intensity is expected.
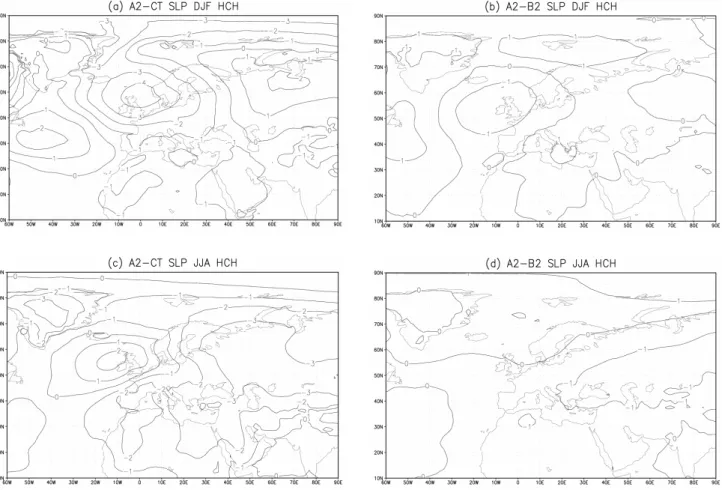
4 Effect of driving data
HadAM3H based projections of the Sea Level Pressure (SLP) changes to the end of 21st century are presented in Figs. 9a–d. Namely, the A2-CT SLP changes are given in Figs. 9a,c for DJF and JJA respectively. Corresponding A2-B2 differences are given in Figs. 9b, d. According to Fig. 9a, the DJF SLP change over S. Europe is expected to be char-acterized by a dipole structure with negative SLP anomaly over north-western Europe and positive SLP anomaly over and to the north of the EM. The dipole pattern resembles that of the negative phase of the East Atlantic/Western Rus-sia (EA/WR) teleconnection pattern (Krichak et al., 2005). The climate change projection assumes an intensification of southerly airflow over the EM. Such atmospheric circulation anomaly is appropriate for drier than the current weather con-ditions over the region. An extending from the north-east positive SLP anomaly area is found over the Mediterranean area meaning positioning of an additional clockwise circula-tion change cell over the EM. The earlier discussed RCM-projected DJF wind changes (Fig. 7a) are in agreement with the pattern in Fig. 9a which means a large-scale origin of the RCM-simulated A2-CT DJF circulation change.
Fig. 7. RCM projection of future changes in wind direction and magnitude: (a, c) A2 minus CT in DJF and JJA; (b, d) sensitivity to emission
Fig. 9. Same as in Fig. 7 but for sea level pressure and based of results of HadAM3H global simulation experiment.
According to Fig. 9b the B2 scenario GHG emission will lead to formation of a similar (though weaker) SLP anomaly pattern – which is also in agreement with the pattern in Fig. 7b.
According to Fig. 9c, the a large-scale climate change pro-cess over Europe during JJA will be associated with develop-ment of a negative SLP anomaly over central and east Russia and positive SLP anomaly over east Atlantic. Such atmo-spheric circulation anomaly is appropriate for predominantly northerly winds over the EM region during the season. The RegCM3-produced JJA wind change pattern (Fig. 7c) differs from that in Figs. 9c, d however. The fact seems to be indi-cating a regional origin of the RCM-produced JJA wind field A2-CT wind circulation changes in JJA season.
5 Discussion
Three current climate and climate change simulation experi-ments have been performed. Analysis of 30-year mean sea-sonal patterns of several produced in the experiments pa-rameters allows evaluation of uncertainty in the results ob-tained. The fact that all the RCM experiments performed
did not reproduce the sharp east-west gradient of the precip-itation distribution may be attributed to an insufficient size of the model domain chosen as well as the space resolution adopted. The current climate PRCS1/PRCS2-based tempera-ture and air-moistempera-ture patterns are in better agreement with the observations than those of the FVGCM experiment. Though the PRCS1/PRCS2 experiments reasonably accurately repro-duced the real annual precipitation pattern, the corresponding FVGCM-based pattern is in a better agreement with the ob-servations. At the same time the FVGCM-based climate is characterized by a positive air moisture bias. The facts seem to be indicating an insufficiency in the moist air mass influx from the lateral boundaries in the PRCS1/PRCS2 runs. Both possible inadequacies in the AOGCM formulations and in-sufficient RCM domain size (Vannitsem and Chome, 2005) may be contributing to those in the boundary forcing. A higher accuracy of the annual precipitation pattern produced by Giorgi at al. (2004a) over a larger model domain supports the latter suggestion.
Based on the results of the study as well as those of the earlier analyses of the EM precipitation-wind field relation-ships (Krichak and Alpert, 2005) a significant increase of
the model domain size to include into consideration synoptic processes over southern Europe and E. Atlantic is planned. The current results allow however a preliminary conclusion about the EM climate change expected. Namely, weakening of DJF and JJA westerly air flows over the central part of the EM, intensification of the northerly flows over Cyprus Island and increase of intensity of the SW radiative fluxes over the northern (DJF and JJA) and central (DJF) part of the region are projected for the end of the 21st century. The changes projected are in agreement with the earlier climate change estimates (Giorgi et al., 2004b) in respect to temper-ature (increase) and annual precipitation (decrease). Results of the experiment allow an understanding of the EM climate change processes expected. The climate change processes during the cool season (DJF) appear to be mainly associated with the large-scale developments over Europe. Different mechanisms, mainly associated with smaller-scale regional EM and summer Asian monsoon, control projected climate change processes during JJA.
Acknowledgements. The research was supported by German-Israeli
research grant (GLOWA – Jordan River) from the Israeli Ministry of Science and Technology; and the German Bundesministerium fuer Bildung und Forschung (BMBF). The HadAM3P (PRECIS) driving data have been provided by the Met Office Hadley Centre, University of Reading, UK. The NASA FV-GCM driving data as well as results of the RegCM2 simulations performed for the EU PRUDENCE Project have been provided by the International Centre for Theoretical Physics (ICTP), Trieste. Grid-point data from the Climate Research Unit (CRU) of the University of East Anglia, UK have been used for verification of the results of the climate simulations performed. M. Dayan participated in realization of the PRCS1 experiment. We thank X. Bi for help in our work with the RegCM3. We also much appreciated the constructive comments of the anonymous reviewers.
Edited by: P. Alpert, H. Saaroni, and E. Heifetz Reviewed by: two anonymous referees
References
Alpert, P., Price, C., Krichak, S. O., Ziv, B., Saaroni, H., Osetinsky, I., Barkan, J., and Kishcha, P.: Tropical tele-connections to the Mediterranean climate and weather, Adv. Geosci., 2, 157–160, 2005,
http://www.adv-geosci.net/2/157/2005/.
Atlas, R., Reale, O, Shen, B. W., Lin, S. J., Chern, J. D., Putman, W. T., Lee, T., Yeh, K. S., Bosilovich, M., and Radakovich, J.: Hur-ricane forecasting with the high-resolution NASA finite volume general circulation model, Geophys. Res. Lett., 32(3), L03807, doi:10.10292004GL021513, 2005.
Bedi, H. S., Datta, R. K., and Krichak, S. O.: Numerical forecast of summer monsoon flow pattern, Sov. Meteorol. Hydrol., USA, 5, 39–45, 1976.
Christensen, J. H., Machenhauer, B., Jones, R. G., Schaar, C., Ruti, P. M., Castro, M, and Visconti, G.: Validation of present-day regional climate simulations over Europe: LAM simulations
with observed boundary conditions, Clim. Dynam., 13, 489–506, 1997.
Christensen, J. H. and Christensen, O. B.: Severe summertime flooding in Europe, Nature, 421, 805–806, 2003.
Deque, M., Jones, R. G., Wild, M., Giorgi, F., Christensen, J. H., Hassell, D. C., Vidale, P. L., Rockel, B., Jacob, D., Kiellstrom, E., de Castro, M., Kucharski, F., and van den Hurk, B.: Global high resolution versus limited area model climate change pro-jections over Europe: quantifying confidence level from PRU-DENCE results, Clim. Dyn., 25, 653–670, 2005.
Evans, J. P., Smith, R., and Oglesby, R.: Middle East climate simu-lation and dominant precipitation processes, Int. J. Climatol., 24, 1671–1694, 2004.
Giorgi, F., Bi, X., and Pal, J.: Mean, interannual variability and trends in a regional climate change experiment over Europe. I. Present-day climate (1961–1990), Clim. Dynam., 22, 733–756, 2004a.
Giorgi, F., Bi, X., and Pal, J.: Mean, interannual variability and trends in a regional climate change experiment over Europe. II. climate change scenarios (2071–2100), Clim. Dynam., 23, 839– 858, 2004b.
IPCC: Emission scenarios, a special report of working group III of the intergovernmental panel on climate change, Nakicenovic N, Coordinating Lead Author, Cambridge UniversityPress, Cam-bridge, p. 599, 2000.
Johns, T. C., Gregory, J. M., Ingram, W. J., Johnson, C. E., Jones, A., Lowe, J. A., Mitchell, J. F., Roberts, D. L., Sexton, D. M. H., Stevenson, D. S., Tett, S. F. B., and Woodage, M.: Anthropogenic climate change for 1860 to 2100 simulated with the HadCM3 model under updated emissions scenarios, Clim. Dynam., 20, 583–612, 2003.
Krichak, S. O. and Alpert, P.: Eastern Mediterranean precipitation climate modeling and analysis evaluations, Geophys. Res. Abstr., 6, 05781, 2004.
Krichak, S. O. and Alpert, P.: Decadal trends in the East At-lantic/West Russia pattern and the Mediterranean precipitation, Int. J. Clim., 25, 183–192, 2005.
Krichak, S. O., Alpert, P., and Dayan, M.: Adaptation of the MM5 and RegCM3 for regional, climate modeling over the eastern Mediterranean, region, Geophys. Res. Abstr., 7, 04624, 2005. Krichak, S. O., Alpert, P., and Dayan, M.: An evaluation of
role of hurricane Olga (2001) in an extreme rainy event in Is-rael using dynamic tropopause maps, Meteorol. Atmos. Phys., doi:10.1007/s00703-006-0230-7, in press, 2007.
Leckebusch, G. C., Koffi, B., Ulbrich, U., Pinto, J. P., Spangehl, T., and Zacharias, S. :Analysis of frequency and intensity of Eu-ropean winter storm events from a multi-model perspective at synoptic and regional scales, Clim. Res., 31, 59–74, 2006. Mitchell, T. D., Carter, T. R., Jones, P. D., Hulme, M., and New,
M.: A comprehensive set of high-resolution grids of monthly cli-mate for Europe and the globe: the observed record (1901–2000) and 16 scenarios (2001–2100), Tyndall Centre Working Paper No. 55., Tyndall Centre for Climate Change Research, Univer-sity of East Anglia, Norwich, UK, 2004.
Pal, J. S., Giorgi, F., Bi, X., Elguindi, N., Solmon, F., Gao, X., Fran-cisco, R., Zakey, A., Winter, J., Ashfaq, M., Syed, F. S., Bell, J. L., Diffenbaugh, N. S., Karmacharya, J., Konare, A., Martinez, D., da Rocha, R. P., Sloan, L. C., and Steiner, A. : The ICTP RegCM3 and RegCNET: regional climate modeling for the
de-veloping world, B. Am. Meteorol. Soc., in press, 2007. Raupach, M. R., Marland, G., Ciais, Ph., Le Qu´er´e, C. Canadell, J.
G., Klepper, G., and Field, C. B.: Global and regional drivers of accelerating CO2emissions, Proc. Nat. Acad. Sci. USA,
avail-able online: www.pnas.org/cgi/doi.10.1073/pnas.0700609104, 2007.
Vannitsem, S. and Chome, F.: One-Way Nested Regional Climate Simulations and Domain Size, J. Climate, 18, 229–233, 2005.