HAL Id: hal-00297816
https://hal.archives-ouvertes.fr/hal-00297816
Submitted on 9 Sep 2005HAL is a multi-disciplinary open access
archive for the deposit and dissemination of sci-entific research documents, whether they are pub-lished or not. The documents may come from teaching and research institutions in France or abroad, or from public or private research centers.
L’archive ouverte pluridisciplinaire HAL, est destinée au dépôt et à la diffusion de documents scientifiques de niveau recherche, publiés ou non, émanant des établissements d’enseignement et de recherche français ou étrangers, des laboratoires publics ou privés.
Controls over N2O, NOx and CO2 fluxes in a calcareous
mountain forest soil
B. Kitzler, S. Zechmeister-Boltenstern, C. Holtermann, U. Skiba, K.
Butterbach-Bahl
To cite this version:
B. Kitzler, S. Zechmeister-Boltenstern, C. Holtermann, U. Skiba, K. Butterbach-Bahl. Controls over N2O, NOx and CO2 fluxes in a calcareous mountain forest soil. Biogeosciences Discussions, European Geosciences Union, 2005, 2 (5), pp.1423-1455. �hal-00297816�
BGD
2, 1423–1455, 2005
N2O, NOxand CO2 fluxes in a calcareous
mountain forest soil
B. Kitzler et al. Title Page Abstract Introduction Conclusions References Tables Figures J I J I Back Close
Full Screen / Esc
Print Version Interactive Discussion EGU Biogeosciences Discussions, 2, 1423–1455, 2005 www.biogeosciences.net/bgd/2/1423/ SRef-ID: 1810-6285/bgd/2005-2-1423 European Geosciences Union
Biogeosciences Discussions
Biogeosciences Discussions is the access reviewed discussion forum of Biogeosciences
Controls over N
2
O, NO
x
and CO
2
fluxes in
a calcareous mountain forest soil
B. Kitzler1, S. Zechmeister-Boltenstern1, C. Holtermann2, U. Skiba3, and K. Butterbach-Bahl4
1
Federal Research and Training Centre for Forests, Natural Hazards and Landscape (BFW), Seckendorff-Gudent-Weg 8, Vienna, Austria
2
Sellenyg. 2–4/52, Vienna, Austria
3
Institute of Terrestrial Ecology, Bush Estate, Penicuik, Midlothian EH26 OQB, Scotland
4
Institute for Meteorology and Climate Research, Atmospheric Environmental Research, Forschungszentrum Karlsruhe, Kreuzeckbahnstraße 19, 82467, Garmisch-Partenkirchen, Germany
Received: 1 July 2005 – Accepted: 11 August 2005 – Published: 9 September 2005 Correspondence to: B. Kitzler ([email protected])
BGD
2, 1423–1455, 2005
N2O, NOxand CO2 fluxes in a calcareous
mountain forest soil
B. Kitzler et al. Title Page Abstract Introduction Conclusions References Tables Figures J I J I Back Close
Full Screen / Esc
Print Version
Interactive Discussion
EGU Abstract
We measured nitrogen oxides (N2O and NOx), dinitrogen (N2) and carbon dioxide (CO2) emissions from a spruce-fir-beech forest soil in the North Tyrolean limestone Alps in Austria. The site received 12.1 kg nitrogen via wet and dry deposition. Fluxes of nitric oxide (NO) were measured by an automatic dynamic chamber system on an 5
hourly basis over a two year period. Daily N2O emissions were obtained by a semi-automatic gas measuring system. In order to cover spatial variability biweekly manual measurements of N2O and CO2 emissions were carried out, additionally. For acquir-ing information on the effects of soil and meteorological conditions and of N-deposition on N-emissions we chose the autoregression procedure (time-series analysis) as our 10
means of investigation. Hence, we could exclude the data’s autocorrelation in the course of the time. We found that soil temperature, soil moisture and wet N-deposition followed by air temperature and precipitation were the most powerful influencing pa-rameters effecting N-emissions. With these variables up to 89% of observed temporal variations of N-emissions could be explained. During the two-year investigation pe-15
riod between 2.5 and 3.5% of deposited N was reemitted in form of N2O whereas only 0.2% were emitted as NO. At our mountain forest site the main end-product of mi-crobial activity processes was N2 and trace gases (N2O and NO) were only of minor importance.
1. Introduction
20
Nitrous oxide (N2O) is a stable greenhouse gas in the troposphere and is involved directly in global warming. In the stratosphere it is responsible for the catalytic de-composition of ozone (Crutzen, 1979). The increase in the atmosphere is reported at present to be about 0.25% per year (IPCC, 2001). As the potential of global warm-ing of N2O is 300 times higher than that of carbon dioxide (CO2) a further increase of 25
BGD
2, 1423–1455, 2005
N2O, NOxand CO2 fluxes in a calcareous
mountain forest soil
B. Kitzler et al. Title Page Abstract Introduction Conclusions References Tables Figures J I J I Back Close
Full Screen / Esc
Print Version
Interactive Discussion
EGU In contrast, nitric oxide (NO) is indirectly involved in global warming and contributes
to the net production of radiative tropospheric ozone and photochemical air pollution (Crutzen, 1995; Firestone and Davidson, 1989; Williams et al., 1992).
The production of N2O, NO, and N2in soils is mainly the result of nitrifying and den-itrifying bacteria (e.g. Davidson et al., 2000; Conrad, 1996; Lovett et al., 2002). These 5
microbial activity processes – and thus the production rates of NO, N2O and N2 are influenced by various factors. These drivers are temperature, precipitation, total N, availability of O2, mineralization rate, respiration, texture and structure, available ni-trogen, pH and tree species composition (Davidson et al., 2000; Ludwig et al., 2001; Simek and Cooper, 2002). As forest soils are generally not treated with N fertilizers, 10
N deposition from the atmosphere which are mainly due to NH3 release form agricul-tural practices and NOx release from combustion processes provides a considerable increase in mineral N input to forest soils. Atmospheric N-deposition is estimated to be at least 5 kg N ha−1y−1in most regions of Europe, but can reach up to 50 kg N ha−1y−1 in central and northern Europe (NADP, 2002). Nitrogen surplus in forest soil can be 15
stored as soil N, taken up by microbes and plants or leached into groundwater. It can alter the rates of microbial N- and C- turnover in soil or it can be nitrified and denitrified to gaseous products of NO, N2O and N2 (Skiba et al., 2004). Increased N-deposition can lead to changes in soil chemistry, forest composition and forest productivity.
A deposition of 12 kg ha−1y−1 of nitrogen at the study site Achenkirch (AK) is mod-20
erate but exceeds Critical Loads according to the WHO-Guideline (WHO, 1995) for sensitive coniferous forest ecosystems (Smidt et al., 1996). In other alpine areas an input of up to 30 kg ha−1y−1 was found (Herman et al., 2002); and increased flux rates of atmospheric greenhouse gas emissions (NO, N2O, CO2, CH4) might be expected. However, only limited information is available about effects of atmospheric N deposition 25
on the biosphere-atmosphere exchange of N trace gases in alpine forest ecosystems. During a two-year sampling period of CO2, N2O and NOx emissions, measurements were carried out in order (1) to investigate the trace gas exchange between a typical spruce-beech-fir forest soil in the limestone Alps and the atmosphere. Measurements
BGD
2, 1423–1455, 2005
N2O, NOxand CO2 fluxes in a calcareous
mountain forest soil
B. Kitzler et al. Title Page Abstract Introduction Conclusions References Tables Figures J I J I Back Close
Full Screen / Esc
Print Version
Interactive Discussion
EGU were conducted in high temporal and spatial resolution (2) to get better estimates of
annual emissions, (3) to study the relationships between N-trace gas emissions and meteorological factors and soil parameters, (4) to investigate if N-deposition affects N-emissions in these forest ecosystems and (5) to find an appropriate statistical pro-cedure to describe the relationships between N-emissions and their ecological drivers. 5
2. Material and methods
2.1. Investigation site and soil
The 127 year old forest is located in the Achental of the North Tyrolean limestone Alps, and was described by Englisch and Starlinger (1995) as a warm, central-montane spruce-fir-beech forest. The M ¨uhleggerk ¨opfl is a completely isolated hill, formed from 10
dolomite, at a height of 895 m above sea level. The soils are mainly Rendzic Leptosols and Chromic Cambisol and are characterized by high clay content and a low percent-age of coarse material in the upper 10 cm. The soil properties are characterized by a high spatial heterogeneity. The depth of the A-horizon varies from 10–35 cm. For this horizon the organic matter content is very high (>10%). Mean pH is 6.42. For 15
site description see Table 1. A detailed description of the site is given in Herman et al. (2002).
2.2. N2O and CO2flux measurements
Gas measurements were carried out as described in Kitzler et al. (2005). Gas samples of four manually operated chambers (area: 1 m2, volume: 80 l) were taken biweekly 20
from April 2002 until July 2004. Duplicate air samples from the chambers were taken after 0, 1 and 2 h and injected into gas tight headspace vials (20 ml). Daily (1/day) samples were taken by the automatic gas sampling system (AGPS – patent DE 198 52 859) and vials were collected every two weeks. The system is described in detail
BGD
2, 1423–1455, 2005
N2O, NOxand CO2 fluxes in a calcareous
mountain forest soil
B. Kitzler et al. Title Page Abstract Introduction Conclusions References Tables Figures J I J I Back Close
Full Screen / Esc
Print Version
Interactive Discussion
EGU by Kitzler et al. (2005) and has been shown to allow realistic N2O emission estimates
for forest soils (Zechmeister-Boltenstern et al., 2002). Gas samples were stored at 4◦C until analysis. The time of automatic sampling was scheduled for 6 a.m. due to the fact that in a previous experiment highest emissions had been measured at morning dew. In order to avoid freezing of the covering case on the sealing plate, the thermostat was 5
set to 1◦C and there were no measurements conducted below this temperature. During winter no automatic measurements were carried out, but manual measurements were carried out as long as the site was accessible.
Emissions of N2O (µg N m−2h−1) and CO2 (mg C m−2h−1) were determined by the linear increase of the mixing ratio within the incubation period. Nitrous oxide and CO2 10
fluxes were calculated as described in (IAEA, 1992).
A gas chromatograph (HP 5890 Series II) with a 63Ni-electron-capture detec-tor (ECD), connected to an automatic sample-injection system (DANI HSS 86.50, HEADSPACE-SAMPLER) was used for N2O analysis. The oven, injector and detector temperatures were set at 120◦C, 120◦C and 330◦C, respectively. A calibration gas of 15
5 µl l−1N2O (Linde Gas) and N2 in ECD-quality with a flow rate of 30 ml min−1 served as carrier-gas. Carbon dioxide was analysed by using a gas chromatograph (Hewlett-Packard 5890 II series) equipped with a thermal conductivity detector (TCD). Helium was used as carrier-gas (flow rate 10 ml min−1); the CO2 calibration gas contained 10 ml l−1CO2(Linde Gas).
20
2.3. NO flux measurements
Continuous measurements of NO/NO2 were completed by a fully automated system (Holtermann, 1996), at an hourly frequency, throughout the vegetation periods of 2002 and 2003. NO and NO2 were measured with a HORIBA APNA-360 chemolumines-cence nitrogen oxide analyzer (detection limit: was 1 ppb; flow rate: 1 l min−1). Calibra-25
tion was conducted by using a HORIBA calibration unit (Transferstandard, ASGU-360, 0–600 ppb). To avoid reactions of NO and O3 in the chambers, a filter cylinder, filled
BGD
2, 1423–1455, 2005
N2O, NOxand CO2 fluxes in a calcareous
mountain forest soil
B. Kitzler et al. Title Page Abstract Introduction Conclusions References Tables Figures J I J I Back Close
Full Screen / Esc
Print Version
Interactive Discussion
EGU with Purafil and activated charcoal, was used in 2002 as no ozone analyzer was
avail-able in this year. In year 2003 we used an ozone analyzer (HORIBA APOA-360) for measuring O3 concentrations within the chambers. Thus, the chemical reaction be-tween NO and O3could be considered. It has to be mentioned that the NO2 measure-ments with the HORIBA is the sum of NO2(most likely the main component) and other 5
nitrogen compounds (PAN, NH3, HONO). Air samples were taken from 5 chambers (ø=20 cm; Vol.=3.27 l), plus one reference chamber where the opening to the soil was sealed with a Plexiglas pane. Each chamber was closed for 5 min within which steady state was reached. Fluxes were calculated as described by Schindlbacher et al. (2004) for 2002 fluxes and Butterbach-Bahl et al. (1997) for 2003 fluxes. For further details on 10
analysis of gas samples and calculation of fluxes compare Kitzler et al. (2005). In view of the low concentrations and the spatial heterogeneity of NOx fluxes the uncertainty coming from disregarding wall effects was assumed to be of minor importance (Ludwig, 1994).
2.4. Soil samples 15
Soil samples were taken approximately every two months. Extractable nitrogen was determined from litter layer (frame: 30×30 cm) and mineral soil (upper 7 cm), and anal-ysed according to Kandeler (1995). Soil moisture was determined gravimetrically. The pH was measured in soil suspensions in 0.01 M CaCl2 solution using a glass elec-trode. Additionally to these analyses, an acetylene (C2H2) inhibition experiment was 20
carried out twice (May 03 and August 03). Acetylene inhibits the reduction of N2O to N2and is used to quantify the total N-loss (N2O+N2) that is produced via denitrification (Klemedtsson et al., 1990).
Per sampling time 16 soil cores from the upper 7 cm mineral soil were incubated in airtight incubation cylinders (volume: 500 ml) and sealed with silicon grease. The 25
headspace of the cylinders was sampled (30 ml) at the beginning of the incubation period and after 4 h at a temperature of 25◦C; thus allowing the determination of N2O production. Afterwards, acetylene was injected into the headspace exposing the soil
BGD
2, 1423–1455, 2005
N2O, NOxand CO2 fluxes in a calcareous
mountain forest soil
B. Kitzler et al. Title Page Abstract Introduction Conclusions References Tables Figures J I J I Back Close
Full Screen / Esc
Print Version
Interactive Discussion
EGU core to 10 kPa acetylene. The incubation period lasted again for 4 h at 25◦C. Nitrous
oxide was analyzed as described in Sect. 2.2.
2.5. Meteorological data
Soil temperature (in◦C, Vitel-thermisters) and soil moisture (in %, Vitel – Theta probes) were quantified at a soil depth of 5, 15, 25 and 50 cm and stored in a data logger. Air 5
temperature (◦C) was measured with a temperature sensor at 2 m above ground. Mea-suring interval was 4 h. As far as the manual gas sampling time was concerned, soil temperatures at a soil depth of 3 and 10 cm were additionally measured around the chambers. Daily precipitation was recorded by an ombrometer at the nearby mete-orological station – Pumpwerk Achenkirch. The biweekly input below the crown was 10
calculated from the crown throughfall collectors.
2.6. Deposition measurements
Dry deposition of NO2and NH3was captured by three passive diffusion tubes and three CEH ALPHA samplers, respectively (Tang et al., 2001), and were analysed by CEH Edinburgh. They were placed in the canopy at the investigation site and at an open site 15
nearby, at a height of 1.5 m and were changed monthly. Dry deposition velocities were assumed to be 1.5 mm s−1for NO2and 3 mm s−1 for NH3(Duyzer, pers. comm.). Wet deposition was collected biweekly using 15 crown throughfall collectors. Wet deposition was analysed for NH+4 and NO−3 (Dionex DX100 and Dionex 120).
2.7. Statistical analysis 20
Data were checked for normal distribution. The t-test or the nonparametric Wilcoxon-test was used for determining differences in soil emissions, soil chemical and N-deposition data between the investigation years. Pearson or Spearman rank corre-lation was used for determining recorre-lations between daily or biweekly emission data and
BGD
2, 1423–1455, 2005
N2O, NOxand CO2 fluxes in a calcareous
mountain forest soil
B. Kitzler et al. Title Page Abstract Introduction Conclusions References Tables Figures J I J I Back Close
Full Screen / Esc
Print Version
Interactive Discussion
EGU soil, meteorological or deposition data. A moving average of 2 or 3 was applied for
deposition data.
As variables are autocorrelated in the course of time (Durbin-Watson statistic), the autoregression procedure – GARCH (p, q) model – was used to detect influences of soil data, meteorological- or deposition data on N-emissions. Specifications of the 5
GARCH model are described in detail in Kitzler et al. (2005). Variables that emerged to correlate best with N2O and NO emissions and variables, whose effects on emis-sions were lagged, were incorporated in the models. Statistical analysis was either completed using SAS Enterpriseguide Version 2 or SAS Version 8. All differences reported were significant at p<0.05 unless otherwise stated.
10
3. Results
3.1. Soil nitrogen and pH
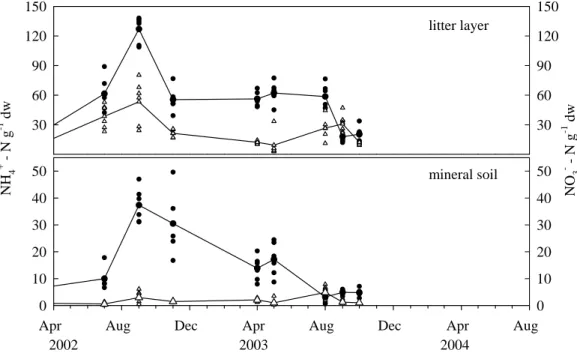
Concentrations of extractable N in the litter layer were at their highest after litterfall in autumn and reached a maximum of 138 µg NH+4-N and 80 µg NO−3-N g−1 dw (dry weight) in September 2002 (Fig. 1). Mean NH+4 and NO−3 concentrations of the first 15
year were considerably higher than the concentrations measured in the second year (Table 2).
A similar seasonality was also observed with regard to N concentrations in the min-eral soil. Here, up to 7.9 µg NO−3-N g−1dw and up to 50 µg NH+4-N g−1dw were reached in autumn 2002 and 2003, respectively. In 2003 considerably lower NH+4-N concentra-20
tions were detected, particularly in autumn.
Mean soil pH was 6.4 with a maximum of 7.0 and a minimum of 5.4. PH of the litter layer was generally lower (mean=5.9) and was ranging from 5.1–7.1.
BGD
2, 1423–1455, 2005
N2O, NOxand CO2 fluxes in a calcareous
mountain forest soil
B. Kitzler et al. Title Page Abstract Introduction Conclusions References Tables Figures J I J I Back Close
Full Screen / Esc
Print Version
Interactive Discussion
EGU 3.2. Nitrogen input
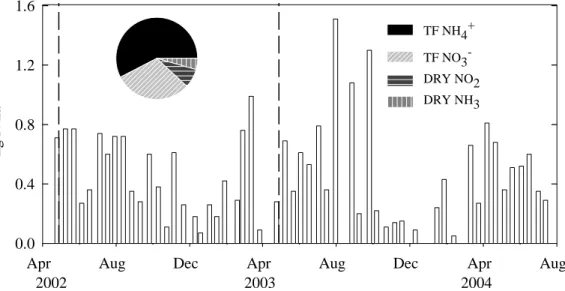
In the two years of investigation, the N-input via throughfall amounted to 10.6 kg and 11.9 kg N ha−1y−1(Table 3). Ratio of deposited NO−3:NH+4 is 1.7:1. In general, N from throughfall had its maximum in spring/early summer. In 2003, however, the highest wet N-deposition was detected in autumn (Fig. 2). No relationship was found between pre-5
cipitation rates and N-input. Dry deposition was measured from May 2002 to July 2003 and amounted to 1.52 kg N ha−1y−1, thus amounting to a total of 12.1 kg N ha−1y−1 through wet and dry deposition in the first year of sampling. NO2deposition was at its highest in winter, whereas concentration of NH3deposition was at its highest in spring and summer. The forest floor received 21.6 kg N per ha−1y−1 (1999) through litterfall 10
(Herman et al., 2002).
3.3. Gas fluxes
3.3.1. Carbon dioxide emissions
Maximum CO2emissions were recorded in the summer 2003 and 2004 (Table 4), fol-lowing a seasonal course of air and soil temperature (Fig. 3a). In 2002 the summer 15
peak was not as pronounced and summer emissions were significantly (p<0.01) lower than in the following years. In late autumn emissions decreased steadily and reached a minimum in winter (0.0–0.4 mg CO2-C m−2h−1).
Mean annual CO2 emission were 11.6±1.1 mg CO2-C m−2h−1 (year 1) and 19.7±2.0 mg CO2-C m−2h−1 (year 2) showing a significant difference between the two 20
years (Table 4). At our site the cumulative soil respiration rate was 1.3±0.3 t C ha−1y−1 (Table 5) with a 60% higher annual CO2production rate in year 2.
The most influencing parameters controlling CO2emissions (Table 6) were soil tem-perature at a soil depth of 3–25 cm (r2=0.86) and air temperature (r2=0.70). Further-more, a positive correlation could be detected with N-deposition (r2=0.62). A negative 25
BGD
2, 1423–1455, 2005
N2O, NOxand CO2 fluxes in a calcareous
mountain forest soil
B. Kitzler et al. Title Page Abstract Introduction Conclusions References Tables Figures J I J I Back Close
Full Screen / Esc
Print Version
Interactive Discussion
EGU (r2=−0.59). All correlations were highly significant (p<0.001).
3.3.2. N2O emissions
Nitrous oxide emissions were mostly dependent on air and soil temperature, as well as soil moisture. Figure 3b shows the high spatial and temporal variability during the field survey from May 2002 until July 2004. Spatial variation between the chambers was 5
high (mean CV: 50%) and reached a maximum in winter (CV: 350%).
Mean annual N2O emissions averaged 4.4±0.3 µg N2O-N m−2h−1 (Table 4). In the course of the year highest N2O emissions were observed in summer 2003 (40.6 µg N2O-N m−2h−1). Although we missed the summer peak with the manual chamber system in year 2002, we were able to observe high N2O emissions by the 10
AGPS (Fig. 3b). During winter, when the site was covered with snow, even a signif-icant uptake of atmospheric N2O (range: −0.3 to −3.5 µg N2O-N m−2h−1) could be observed. Significant differences in the seasonality of N2O emissions between both years could only be observed for August (p<0.01).
Significant correlations could be found between C- and N-emissions, and soil, mete-15
orological and N-input data (Table 6). Log-transformed N2O emission rates measured by the manual system were positively correlated (p<0.001) to soil respiration rates (r2=0.58), soil temperature in a depth of 3 and 10 cm (r2=0.64) and air temperature (r2=0.58). A negative dependency was found with soil moisture (r2=−0.52). Correla-tion analysis between daily N2O emissions from the AGPS system and soil temperature 20
and soil moisture revealed weaker but significant relationships (r2=0.27 and r2=−0.32, p<0.001).
Nitrate and NH+4 deposition via throughfall and NO−3 concentration in the mineral soil showed significant positive effects on N2O emission (r2=0.26, r2=0.25, p<0.001 and r2=0.41, p<0.05), even higher correlation was found with NO−3 concentration in the litter 25
layer (r2=0.44, p<0.01).
BGD
2, 1423–1455, 2005
N2O, NOxand CO2 fluxes in a calcareous
mountain forest soil
B. Kitzler et al. Title Page Abstract Introduction Conclusions References Tables Figures J I J I Back Close
Full Screen / Esc
Print Version
Interactive Discussion
EGU data as residuals were correlated over time. Two GARCH models could be developed
to predict N2O emissions as measured with the manually operated system. Indepen-dent variables in model 1 were (x1t) soil moisture at a soil depth of 5 cm and (x2t) soil temperature at a soil depth of 3 cm. As an effect of N-deposition on N2O emis-sion was discovered while carrying out the correlation analysis (Table 6), we included 5
the monthly sum of nitrogen input (NO−3 and NH+4) via throughfall within model 2 and achieved an improvement of modelled N2O emissions in comparison to simple regres-sion analysis. Both models follow the GARCH (2, 1) process and revealed a r2of 0.89 (model 1) and r2 of 0.83 (model 2) (Fig. 4). Daily N2O emissions from the AGPS showed a high temporal variability. Moreover, correlations with soil parameters were 10
lower compared to the N2O emissions measured by the spatially extended manual sys-tem. The GARCH model (Fig. 4, model 3 and Table 7) revealed that precipitation and air temperature on daily N2O emissions are delayed by 8 days (p<0.001, r2=0.43). 3.3.3. NOx emissions
NO and NO2flux rates from soil were measured from July 2002 until November 2003 15
(Fig. 3c) but not during the winter months. Mean NO emissions in the vegetation period were 0.7±0.04 µg NO-N m−2h−1 and hence significantly higher in year 2002 (p<0.001) compared to the year 2003 (0.5±0.07 µg NO-N m−2h−1) when low soil N concentrations were measured. Mean NO emissions were generally lower than N2O emission rates. The ratio NO/N2O was 1:3. A consistent seasonal trend could not 20
be observed: In the year 2002 highest emissions occurred in autumn, whereas in year 2003 maximum emissions were measured in spring (Fig. 3c). Lowest NO emis-sions or even negative fluxes were observed in November 2003. NO2 was deposited over the entire observation period with a mean of −0.4± 0.2 µg NO m−2h−1(2002) and −0.3±0.1 µg NO2m−2h−1 (2003).
25
Correlation analysis (Table 6) revealed a weak positive relationship between mean daily NO fluxes and soil temperature at the soil depth of 5 cm (r2=0.19, p<0.5), whereas
BGD
2, 1423–1455, 2005
N2O, NOxand CO2 fluxes in a calcareous
mountain forest soil
B. Kitzler et al. Title Page Abstract Introduction Conclusions References Tables Figures J I J I Back Close
Full Screen / Esc
Print Version
Interactive Discussion
EGU a highly significant positive dependency could be observed with soil moisture in 5 cm,
(r2=0.55, p<0.001). No valid statistical explaination could be given to characterize NO emissions by a simple regression model. By using the autoregression procedure, however, a GARCH (1,1) model could be developed to predict daily NO emissions of our site (Fig. 4, model 4). Through a mean of daily soil moisture content (x1t) and 5
soil temperature (x2t) at a soil depth of 5 cm, predictions of mean daily NO emissions could be carried out with an r2of 0.77 (Table 7). This model revealed a time lag of 2, signifying that the independent variables have an influence on NO emissions over two days.
3.3.4. Actylen inhibition 10
By using the C2H2inhibition method the reduction of N2O to N2is inhibited and total N-loss, which is produced via denitrification, can be measured. The increase of N2O pro-duction in the Acetylene-treated samples, in comparison to the samples without added C2H2was between 101% and 4200% with a median of 266%. The ratio of N2O:N2was 1:6. Mean N2 production of the two experiments (n=16) was 11.6±1.4 µg N2m−2h−1 15
and 19.1±3.9µg N2m−2h−1.
4. Discussion
4.1. CO2emissions
Carbon dioxide emissions, a measure for general microbial activity, followed a typical seasonal trend, with highest rates in summer, when mineralization of organic matter 20
occurs. Lowest rates were measured in winter. Organic carbon is converted to CO2 during mineralization. This process is strongly dependent on soil temperature and soil moisture. At our site, soil temperature at a soil depth of 3 and 10 cm was mostly re-sponsible for temporal variation in soil respiration. This finding is in good agreement
BGD
2, 1423–1455, 2005
N2O, NOxand CO2 fluxes in a calcareous
mountain forest soil
B. Kitzler et al. Title Page Abstract Introduction Conclusions References Tables Figures J I J I Back Close
Full Screen / Esc
Print Version
Interactive Discussion
EGU with results from other studies (Epron et al., 1999; Merino et al., 2004). Soil moisture
showed also a significant effect on soil respiration rates. Carbon dioxide release was reduced during periods of heavy rain (summer 2002), when the water content was be-tween 50–65%, probably as a consequence of O2 deficiency in soil due to diffusion restrictions (Howard and Howard, 1993). Further significant relationships could be 5
established between biweekly mean CO2 emissions and biweekly N-deposition rates. The cumulative soil respiration rates at our site (1–1.6 t C ha−1y−1) are lower than val-ues for temperate coniferous forests reported by Raich and Schlesinger (1992).
4.2. N2O emissions
At our site, seasonal variations in N2O emissions followed mainly the annual changes 10
in soil temperature, soil moisture and the availability of N in the soil. Highest emissions were thus observed during summer/autumn. Although, we missed out on the summer peak in year 2002 through the manual chamber system (biweekly sampling), we were able to observe high emissions by the AGPS. Correlation analysis revealed that soil temperature was the most important factor controlling N2O emissions followed by soil 15
moisture. Those parameters affect microorganisms and their metabolism and, hence, the production and consumption of N trace gases in soils (Conrad, 1996). The air-filled porosity controls the movement of the gases towards and away from the atmosphere; it also affects soil aeration, and, thus, indirectly controls the capacity of the soil for pro-ducing or consuming soil-produced trace-gases (Smith et al., 2003); (Davidson et al., 20
2000). In a laboratory parameterisation study, Schindlbacher et al. (2004) found that for the AK site a N2O emission maximum for a soil moisture range of 60%–90% water filled pore space (WFPS) which corresponds to a water content of 53–80%. In the field we found, beside the peak in August 2003, that maximum N2O emissions occurred at water moisture values in the range of 50%–65%, i.e. in accordance to the laboratory 25
results of Schindlbacher et al. (2004). With the GARCH model 1 N2O emissions could be predicted best using soil moisture and soil temperature as predictors (r2=0.89).
BGD
2, 1423–1455, 2005
N2O, NOxand CO2 fluxes in a calcareous
mountain forest soil
B. Kitzler et al. Title Page Abstract Introduction Conclusions References Tables Figures J I J I Back Close
Full Screen / Esc
Print Version
Interactive Discussion
EGU This analysis also revealed that past environmental conditions (up to 12 weeks) can
significantly affect actual N2O emissions. Within the model, soil moisture showed a highly significant effect (p<0.001) whereas the effect of soil temperature was lower (p<0.01). Furthermore, precipitation and air temperature showed a clear influence in daily (AGPS) N2O emissions (model 3). Here a highly significant effect of conditions 5
during the past 8 days were observed.
Highest emissions were observed in August 2003. There are various parameters that might have contributed to the N2O peak. Even at this site, where soil moisture is generally high, the water content during the European drought period of summer 2003 decreased to 30%. After a rainfall event soil moisture increased again and may 10
have caused an increase in microbial activity. On the other hand, the actual level of N-deposition and the NO−3 pool in the soil might have played an important role in the sudden release of N2O (Davidson et al., 2000). Highest amounts in NO−3 and NH+4 via throughfall reached the forest floor in August. Although, throughout the study wet N-deposition accounted for up to 31% of the variation in N2O emission (correlation 15
analysis) only, a strong relationship was apparent between the two factors. This high N2O peak coincided with significant larger available soil N concentrations, in particular soil NO−3. Using model 2 the relationship between biweekly measured N2O emissions and biweekly sum of nitrogen input (NO−3 and NH+4) via throughfall was found by a high model efficiency (r2=0.83). The time series analysis revealed a highly significant 20
(p<0.001) lagged effect of wet N-deposition on N2O emission for 2 weeks, but correla-tions are expected for a 3-month period.
The soil at the M ¨uhleggerk ¨opfl is, typically, moist (mean 55%) and denitrification may have been the main source of N2O emissions throughout the year. A high pH value is also one of the factors that provide favourable conditions for denitrification at the 25
site. Previous studies (H ¨artel et al., 2002) have indicated that complete nitrification takes place at our site and that it is of major importance for N2O emission. 15NO−3 was strongly immobilized. Furthermore, close C/N-ratios (16–18) suggest favourable conditions for N-mineralization and nitrification (Herman et al., 2002). It was in
Au-BGD
2, 1423–1455, 2005
N2O, NOxand CO2 fluxes in a calcareous
mountain forest soil
B. Kitzler et al. Title Page Abstract Introduction Conclusions References Tables Figures J I J I Back Close
Full Screen / Esc
Print Version
Interactive Discussion
EGU gust/September that nitrate concentration increased and we suppose that the high
N2O peak in year 2003 is the product of nitrification.
At our site winter emissions were generally low and the site even functioned as a sink for N2O. The AGPS system, in particular, was a useful means for detecting negative fluxes. Butterbach-Bahl et al. (2002) detected negative N2O fluxes from pine forests 5
with moderate N-deposition whereas a pine forest with high N-loads exclusively func-tioned as a source of N2O during winter. On the other hand winter emissions, compa-rable to the ones from the rest of the year (January 2003; 4.3±1.3 µg N2O-N m−2h−1), could be observed after freeze-thaw events. These high emissions were either a result of enhanced denitrification activity or could be due to the physical release of accumu-10
lated N2O in the snow or in the soil (Teepe et al., 2001). 4.3. NO emissions
The production of NO is strongly dependent on climate and varies considerable with soil temperature and soil moisture (Davidson et al., 2000; Ludwig et al., 2001; Van Dijk et al., 2002). We found best correlations with soil moisture and only little dependency 15
on soil temperature. The optimum soil temperature, as found in laboratory studies (20◦C) by Schindlbacher et al. (2004), could not be confirmed in the field experiment, where highest NO emissions were found at 8–10◦C soil temperature; maximum soil temperature in the field was 16◦C. Optimum WFPS in the field for NO emission was found to be at 30–45% WFPS (water content 27–40%) and was, thus, higher than in 20
laboratory studies (Schindlbacher et al., 2004). In the field highest NO emissions were found in autumn and in spring, when soil water content was between 45–50%. High spring emissions were detected in May, when soil was still moist and soil temperature increased. At our site soil moisture had a stronger impact on NO emission than soil temperature. With the GARCH procedure a relationship between NO emissions and 25
soil moisture and soil temperature could be found with a model efficiency of r2of 0.77 (model 4). Autoregressive parameters were estimated for a time-lag of 2 days; i.e. soil moisture and soil temperature affected NO emission over a two days period at our site.
BGD
2, 1423–1455, 2005
N2O, NOxand CO2 fluxes in a calcareous
mountain forest soil
B. Kitzler et al. Title Page Abstract Introduction Conclusions References Tables Figures J I J I Back Close
Full Screen / Esc
Print Version
Interactive Discussion
EGU Soil nitrogen content contributed to high NO emission in autumn, where highest
NO−3-N and NH+4-N concentrations were measured. As in autumn 2003 the N-pool (especially extractable NH+4-N) in the soil and the litter layer was low compared to concentrations measured in autumn 2002 no increase in NO emissions could be found. The effect of rewetting the soil as it was found for N2O emissions could not be seen for 5
NO emissions.
Soil acidity is supposed to be an important factor promoting N-losses from forest soils influenced by atmospheric nitrogen deposition (Li et al., 2000 and Venterea et al., 2003). Soils with a pH of 7–8 are supposed to produce higher amounts of N2(Simek and Cooper, 2002) but revealed an order of magnitude higher N2O emissions than soils 10
with a pH between 4 and 6 (Vermoesen et al., 1996). A soil pH of 6.7–7.1 measured at our limestone site restricts self-decomposition of HNO2and might, therefore, be re-sponsible for low NO fluxes (Van Cleemput and Samater, 1996). Beside the high pH and the high microbial biomass (H ¨artel et al., 2002), the well-balanced community com-position of the microflora (Zechmeister-Boltenstern, pers. comm.) could be a reason for 15
low NO-fluxes. Results of PLFA studies of European soils by (Zechmeister-Boltenstern, pers. comm.) showed that at acidic high N-input sites the microbes are under stress which leads to structural changes of their cell membranes. This could cause losses of intermediate products in the nitrification or denitrification pathway and could, thereby, lead to higher NO and N2O emissions. The assumption of a well-balanced microflora 20
was supported by the acetylene inhibition and simulation runs with the Pnet-N-DNDC where high N2 emissions were detected and a large portion of N was fully recycled (Butterbach-Bahl, pers. comm.).
4.4. Annual N-losses
In both years N released in form of N2O was between 0.3 and 0.4 kg N2O-N ha−1y−1, 25
and 0.03 kg NO-N ha−1(Table 5). These values correspond to a yearly release of actual N input of 2.5–3.5% in form of N2O and 0.2% in form of NO and are located in the lower
BGD
2, 1423–1455, 2005
N2O, NOxand CO2 fluxes in a calcareous
mountain forest soil
B. Kitzler et al. Title Page Abstract Introduction Conclusions References Tables Figures J I J I Back Close
Full Screen / Esc
Print Version
Interactive Discussion
EGU reported percentage of deposited N which is 0–16% (N2O) and 0–10% (NO) (Skiba et
al., 2004). Through the acetylene inhibition we calculated a N2/N2O ratio of 6.0 and concluded a rough estimation of 2.2 kg N ha−1 of annual N2 loss. Simulated mean N2 production by the model PnetNDNDC for years 1998–2001 (Zechmeister-Boltenstern, unpublished) was 14 kg, which would mean that more than 18% of the deposited N 5
were lost by the complete pathway of microbial soil processes as N2. As the acetylene inhibition was only conducted twice within the investigation period this value has to be interpreted with caution. However, it can be hypothesized that the deposited N from the atmosphere is mainly emitted as N2at this limestone site.
The magnitude of N2O emissions from our site are consistent with values reported 10
of other coniferous forests (MacDonald et al., 1997; Papen and Butterbach-Bahl, 1999; Butterbach-Bahl et al., 2002) and limed beech forests (Borken and Brumme, 1997). Considerable higher fluxes were measured in more acidic spruce forests, where high loads of N was deposited (Papen and Butterbach-Bahl, 1999; Butterbach-Bahl et al., 2002) and in deciduous forest ecosystems with low pH (Brumme and Beese, 1992; 15
Borken and Brumme, 1997).
Nitric oxide emission measured in our study are low in comparison to other pub-lished NO fluxes from temperate coniferous forests. But our rates are in accordance with studies by (Johansson, 1984) who reported annual NO emissions of 0.04 kg NO-N ha−1 from an unfertilized coniferous forest soil in Sweden. The majority of studies, 20
however, revealed significantly higher values. Pilegaard et al. (1999) and Butterbach-Bahl et al. (2002) found in moderately N-effected spruce forests annual NO losses of 3.15 kg NO-N ha−1 and 3.1 µg NO-N m−2h−1, respectively. It has to be taken into ac-count that most of the reported data were measured at forest soils with low pH values, however, NO fluxes are reported to be significantly higher in more acidic soils com-25
pared to N2O fluxes (Yamulki et al., 1997).
Nitrogen oxide emissions could be predicted with high efficiencies. Nitrous oxide emissions measured by manual chambers revealed an r2 of 0.89 (model 1) and an r2 of 0.83 (model 2). Through model 2, where N-deposition is the only independent
BGD
2, 1423–1455, 2005
N2O, NOxand CO2 fluxes in a calcareous
mountain forest soil
B. Kitzler et al. Title Page Abstract Introduction Conclusions References Tables Figures J I J I Back Close
Full Screen / Esc
Print Version
Interactive Discussion
EGU variable, annual emission rates could be estimated better than with model 1, where soil
moisture and soil temperature were the crucial parameters. Especially in year 2003, where high emissions were detected in August, the predicted emissions with model 2 revealed a better accuracy as model 1. High variations in N2O emissions measured by the AGPS led to an overestimation of N2O emissions through model 3 (21–27%). 5
Nitric oxide emissions predicted with model 4 could be predicted with an r2of 0.77 and annual simulated fluxes were in accordance with measured annual NO emissions.
It can be concluded that with time series analysis lagged effects of the controlling fac-tors soil moisture, soil temperature and N-deposition on N2O and NO emissions could be revealed. In particular significant two weeks delayed response of N2O emission to 10
N-deposition was observed. Nitric oxide emissions were three times lower compared to N2O emissions and total losses of N were small compared to N-inputs. This may be attributed to the fact that in the limestone Alps soil pH is high, a large microbial biomass can be found and nitrogen is mainly emitted in the form of N2.
Acknowledgements. We would like to thank the landowners for access on their land. A. Fiege, 15
J. Pausch, J. Plattner, and F. Winter for field work, C. Abo-Elschabaik and M. Kitzler for helping with the sample analysis and S. Smidt for provision of meteorological data. The study is a part of the NOFRETETE project EVK2-CT2001-00106 funded by the European Commission DG Research – Vth Framework Programme.
References
20
Borken, W. and Brumme, R.: Liming practice in temperate forest ecosystems and the effects
on CO2, N2O and CH4fluxes, Soil use and management, 13, 251–257, 1997.
Brumme, R. and Beese, F.: Effects of liming and nitrogen fertilization on emissions of CO2and
N2O from temperate forest, J. Geophys. Res., 97, 12, 851–858, 1992.
Butterbach-Bahl, K., Gasche, R., Breuer, L., and Papen, H.: Fluxes of NO and N2O from
25
temperate forest soils: impact of forest type, N deposition and of liming on NO and N2O
BGD
2, 1423–1455, 2005
N2O, NOxand CO2 fluxes in a calcareous
mountain forest soil
B. Kitzler et al. Title Page Abstract Introduction Conclusions References Tables Figures J I J I Back Close
Full Screen / Esc
Print Version
Interactive Discussion
EGU
Butterbach-Bahl, K., Breuer, L., Gasche, R., Willibald, G., and Papen, H.: Exchange of trace gases between soils and the atmosphere in Scots pine forest ecosystems of the
northeast-ern German lowlands: 1. Fluxes of N2O, NO/NO2 and CH4 at forest sites with different
N-deposition, Forest Ecology and Management, 167, 1–3, 123–134, 2002.
Conrad, R.: Soil microrganisms as controllers of atmospheric trace tases (H2, CO, CH4, OCS,
5
N2O, NO), Microbiology Reviews, 60, 609–640, 1996.
Crutzen, P. J.: Ozone in the troposphere, in: Composition, Chemistry, and Climate of the Atmosphere, edited by: Signh, H. P., Van Nostrand Reinhold, New York, 1995.
Crutzen, P. J.: The role of NO and NO2in the chemistry of the troposphere and stratosphere,
Annu. Rev. Earth Planet. Sci., 7, 443–472, 1979.
10
Davidson, E. A., Keller, M., Erickson, H. E., Verchot, L. V., and Veldkamp, E.: Testing a concep-tual model of soil emissions of nitrous and nitric oxides, BioScience, 50, 667–680, 2000. Englisch, M. and Starlinger, F.: Waldgesellschaften und Standorte im Bereich der H ¨ohenprofile
Achenkirch, FBVA-Bericht, 25–54, 1995.
Epron, D., Farque, L., Lucot, E., and Badot, P. M.: Soil CO2 efflux in a beech forest: the
15
contribution of root respiration, Annals of Forest Science, 56, 4, 289–295, 1999.
Firestone, M. K. and Davidson, E. A.: Microbial Basis of NO and N2O Production and
Con-sumption in Soil, in: Exchange of Trace Gases between Terrestrial Ecosystems and the Atmosphere, edited by: Andreae, M. O. and Schimel, D. S., John Wiley, New York, 7–21, 1989.
20
H ¨artel, E., Zechmeister-Boltenstern, S., and Gerzabek, M.: Gaseous nitrogen losses from a for-est site in the north Tyrolean limfor-estone alps, Environmental Science and Pollution research, Special Issue 2, 23–30, 2002.
Herman, F., Smidt, S., Englisch, M., Feichtinger, F., Gerzabek, M., Haberhauer, G., Jandl, R., Kalina, M., and Zechmeister-Boltenstern, S.: Investitations of nitrogen fluxes and pools on a
25
limestone site in the Alps, ESPR – Environmental Science and Pollution Research, 46–52, 2002.
Holtermann, C.: A transportable system for the on-line-measurement of NOx (NO, NO2
)-emission from soils, Die Bodenkultur, 47, 235–244, 1996.
Howard, D. M. and Howard, P. J.: Relationships between CO2evolution, moisture content and
30
temperature for a range of soil types, Soil Biology & Biochemistry, 25, 1537–1546, 1993. IAEA: Manual on measurements of methane and nitrous oxide emissions from agriculture,
BGD
2, 1423–1455, 2005
N2O, NOxand CO2 fluxes in a calcareous
mountain forest soil
B. Kitzler et al. Title Page Abstract Introduction Conclusions References Tables Figures J I J I Back Close
Full Screen / Esc
Print Version
Interactive Discussion
EGU
IPCC: Climate Change 2001: The Scientific Basis. Contribution of Working Group I to the Third Assessment Report of the Intergovernmental Panel of Climate Change, in: Cambridge University Press, edited by: Houghton, J.T., Ding, Y., Griggs, D. J., Noguer, M., Van der Linden, P. J., and Xiaosu, D., Cambridge, United Kingdom and New York, NY, USA, 881, 2001.
5
Johansson, C.: Field measurements of emission of nitric oxide from fertilized and unfertilized forest soils in Sweden, J. Atmos. Chem., 1, 429–442, 1984.
Kandeler, E.: Ammonium and Nitrate, in: Methods of Soil Biology, edited by: Schinner, F., ¨
Ohlinger, T., Kandeler, E., and Margesin, R., Springer, Berlin, 406–410, 1995.
Kitzler, B., Zechmeister-Boltenstern, S., Holtermann, C., Skiba, U., and Butterbach-Bahl, K.:
10
Nitrogen oxides emission from two beech forests subjected to different nitrogen loads, Bio-geosciences Discuss., 2, 1381–1422, 2005,
SRef-ID: 1810-6285/bgd/2005-2-1381.
Klemedtsson, L., Hanson, G., and Mosier, A.: The use of acetylene for the quantification of N2
and N2O production from biological processes in soils, in: Denitrification in soil and sediment,
15
edited by: Sorensen, J. and Revsbech, N. P., Plenum Press, 167–180, 1990.
Li, C., Aber, J. D., Stange, F., Butterbach-Bahl, K., and Papen, H.: A process-oriented model
of N2O and NO emission from forest soils,1, Model development, J. Geophys. Res., 105(4)
4369–4384, 2000.
Lovett, G. M., Weathers, K. C., and Arthur, M. A.: Control of nitrogen loss from forested
wa-20
tersheds by soil carbon: Nitrogen ratio and tree species composition, Ecosys., 5, 712–718, 2002.
Ludwig, J.: Untersuchungen zum Austausch von NO und NO2 zwischen Atmosph ¨are und
Biosph ¨are, PhD Thesis, University of Bayreuth, 251, 1994.
Ludwig, J., Meixner, F. X., Vogel, B., and F ¨orstner, J.: Soil-air exchange of nitric oxide: An
25
overview of processes, environmental factors, and modeling studies, Biogeochemistry, 52, 225–257, 2001.
MacDonald, J., Skiba, U., Sheppard, L. J., Ball, B. C., Roberts, J. D., Smith, K. A., and Fowler, D.: The effect of nitrogen deposition and seasonal variability on methane oxidation and ni-trous oxide emission rates in upland spruce plantation and moorland, Atmos. Environ., 31,
30
22, 3693–3706, 1997.
Merino, A., P ´erez-Batall ´on, P., and Mac´ıas, F.: Responses of soil organic matter and
BGD
2, 1423–1455, 2005
N2O, NOxand CO2 fluxes in a calcareous
mountain forest soil
B. Kitzler et al. Title Page Abstract Introduction Conclusions References Tables Figures J I J I Back Close
Full Screen / Esc
Print Version
Interactive Discussion
EGU
southern Europe, Soil Biology & Biochemistry, 36, 917–925, 2004.
Mutsch, F.: Bodenchemische Charakterisierung des M ¨uhleggerk ¨opfls im Rahmen einer Un-tersuchung ¨uber Stickstoff-Fl¨usse in den Norditoler Kalkalpen, FBVA Berichte, 116, Wien, 33–40, 2001.
NADP: National Atmospheric Deposition Program 2001 Summary. NADP Report, Illinois State
5
Water Survey, Champaign, IL, 2002.
Papen, H. and Butterbach-Bahl, K.: A 3-year continuos record of N-trace gas fluxes from un-treated and limed soil of a N-saturated spruce and beech forest ecosystem in Germany: I.
N2O-emissions, J. Geophys. Res., 104, 18 487–18 503, 1999.
Pilegaard, K., Hummelshoj, P., and Jensen, N. O.: Nitric oxide emission from a Norway spruce
10
forest floor, J. Geophys. Res., 104, 3433–3445, 1999.
Raich, J. W. and Schlesinger, W. H.: The global carbon dioxide flux in soil respiration and its relationship to vegetation and climate, Tellus, 44B, 81–99, 1992.
Schindlbacher, A., Zechmeister-Boltenstern, S., and Butterbach-Bahl K.: Effects of soil
mois-ture and temperamois-ture on NO, NO2and N2O emissions from forest soils, J. Geophys. Res.,
15
109, D17302, 1–12, 2004.
Simek, M. and Cooper, J. E.: The influence of soil pH on denitrification: progress towards the understanding of this interaction over the last 50 years, European Journal of Soil Science, 53, 3, 345–354, 2002.
Skiba, U., Pitcairn, C. E. R., Sheppard, L. J., Kennedy, V. H., and Fowler, D.: The influence of
20
atmospheric N deposition on nitrous oxide and nitric oxide fluxes and soil ammonium and nitrate concentrations, Water, Air and Soil Pollution, Focus 4, 37–43, 2004.
Smidt, S., Herman, F., Grill, D., and Guttenberger, H.: Studies of ecosystems in the Limestone Alps – “Achenkirch Altitude Profiles”, Phyton, 36, Horn, Austria, 1996.
Smith, K. A. Ball, T., Conen, F., Dobbie, K. E., Massheder, J. and Rey, A.: Exchange of
green-25
house gases between soil and atmosphere: interactions of soil physical factors and biological processes, Eur. J. Soil Science, 54, 4, 779–791, 2003.
Tang, Y. S., Cape, J. N., and Sutton, M. A.: Development and types of passive samplers for
monitoring atmospheric NO2 and NH3 concentrations, The Scientific World, 1, 513–529,
2001.
30
Teepe, R., Brumme, R., and Beese, F.: Nitrous oxide emissions from soil during freezing and thawing period, Soil Biol Biochem, 33, 1269–1275, 2001.
BGD
2, 1423–1455, 2005
N2O, NOxand CO2 fluxes in a calcareous
mountain forest soil
B. Kitzler et al. Title Page Abstract Introduction Conclusions References Tables Figures J I J I Back Close
Full Screen / Esc
Print Version
Interactive Discussion
EGU
gaseous N compounds, Fertilizer Research, 45, 81–89, 1996.
Van Dijk, S. M., Gut, A., Kirkman, G. A., Meixner, F. X. and Andreae, M. O.: Biogenic NO emissions from forest and pasture soils: Relating laboratory studies to field measurements, J. Geophys. Res., 107, D20, 8058, 2002.
Venterea, R. T., Groffman, P. M., Verchot, L. V., Magill, A. H., Aber, J. D., and Streudler, P. A.:
5
Nitrogen oxide gas emissions from temperate forest soils receiving long-term nitrogen inputs, Global Change Biology, 9, 346–357, 2003.
Vermoesen, A., de Groot, C., Nollet, L., Boeckx, P., and Van Cleemput, O.: Effect of ammonium
and nitrate application on the NO and N2O emission out of different soils, Plant and Soil, 181,
153–162, 1996.
10
WHO: Updating and revision of the air quality guidelines for Europe, Les Diablerets, 1995.
Williams, E. J., Hutchinson, G. L., and Fehsenfeld, F. C.: NOx and N2O emissions from soil,
Global Biogeochem. Cycles, 6, 351–388, 1992.
Yamulki, S., Harrison, R. M., Goulding, K. W. T., and Webster, C. P.: N2O, NO and NO2fluxes
from a grassland: Effect of soil pH, Soil Biol. Biochem., 29, 8, 1199–1208, 1997.
15
Zechmeister-Boltenstern, S., Hahn, M., Meger, S., and Jandl, R.: Nitrous oxide emissions and nitrate leaching in relation to microbial biomass dynamics in a beech forest soil, Soil Biol. Biochem, 34, 823–832, 2002.
BGD
2, 1423–1455, 2005
N2O, NOxand CO2 fluxes in a calcareous
mountain forest soil
B. Kitzler et al. Title Page Abstract Introduction Conclusions References Tables Figures J I J I Back Close
Full Screen / Esc
Print Version
Interactive Discussion
EGU
Table 1. Site and soil characteristics of the investigation site AK.
Page 17: line 12: insert et al., between Butterbach-Bahl, and 2002 …………Butterbach-Bahl, et al., 2002)
Page 17: line 29: change Model in model
Page 18: line 1, 3, 4, 5, 6: change Model in model
Page 20: line: 3 ……… edited by: Houghton, J.T., Ding, Y., Griggs, D.J., Noguer, M., Van der Linden, P. J. and Xiaosu, D.
Page 20: line 18: remove reference………Lovett et al.,………
Page 22: line 12: change floxes in fluxes………
Tables:
Page 23: In the last row it should be………… C [mg org g-1] 0-15 cm ………and not C [mg org g-1] 0-15 cm
Table 1. Site and soil characteristics of the investigation site AK.
Location 47°34´50´´ N 11°38´21´´E
Vegetation Aposerido-Fagetum caricetosum albae –
Carici albae-Fagetum a)
Stand age [y] 127
Exposition, elevation [m] N, 895 m a sl.
Tree height [m] 19.1
Basal area [m2 ha-1] 40
Soil type Rendzic Leptosols / Chromic Cambisol
Soil texture loam
Soil aciditiy 0-7cm (pH CaCl2) 5.8-7.1
C:N 16-18
Mean precipitation [mm] 1733 b)
Mean air temp [°C] 6.52 b)
Soil density (g cm-3) 0.3
Ntot (mg g-1) 9 c)
Corg (mg g-1) 150 c)
a)
Englisch and Starlinger 1995, b) Mean of years 1998-2003, c) Mutsch 2001.
Page 24: Table 2.
Change in the upper 5 cminto in the upper 7 cm….
BGD
2, 1423–1455, 2005
N2O, NOxand CO2 fluxes in a calcareous
mountain forest soil
B. Kitzler et al. Title Page Abstract Introduction Conclusions References Tables Figures J I J I Back Close
Full Screen / Esc
Print Version
Interactive Discussion
EGU
Table 2. Mean soil nitrogen [µg N g−1dw] and pH (CaCl2) in the litter layer and in the upper 7 cm mineral soil in year 1 and year 2 at AK.
NH4+ 65.8 (8.5) 43.1 (4.0) NO3 - 31.4 (4.4) 18.3 (2.2) pH (CaCl2) 6.1 (0.1) 5.8 (0.1) NH4 + 21.0 (3.0) 8.8 (1.2) NO3 - 1.5 (0.3) 2.1 (0.3) pH (CaCl2) 6.5 (0.1) 6.3 (0.1) Note. Soil data are means with standard error in
parenthesis.
Table 2. Mean soil nitrogen [µg N g-1 dw] and pH (CaCl2) in the litter layer and in the upper 5 cm mineral soil in year 1 and year 2 at AK.
Mineral soil year 1 year 2 Litter layer
1
2
3
4
5
6
7
8
17
1446BGD
2, 1423–1455, 2005
N2O, NOxand CO2 fluxes in a calcareous
mountain forest soil
B. Kitzler et al. Title Page Abstract Introduction Conclusions References Tables Figures J I J I Back Close
Full Screen / Esc
Print Version
Interactive Discussion
EGU
Table 3. Wet and dry deposition [kg N ha−1y−1], precipitation via throughfall, soil nitrogen and
pH (CaCl2) in study year 1 and study year 2 at AK.
NH4+ 65.8 (8.5) 43.1 (4.0) NO3- 31.4 (4.4) 18.3 (2.2) pH (CaCl2) 6.1 (0.1) 5.8 (0.1) NH4 + 21.0 (3.0) 8.8 (1.2) NO3 - 1.5 (0.3) 2.1 (0.3) pH (CaCl2) 6.5 (0.1) 6.3 (0.1)
Note. Soil data are means with standard error in parenthesis.
Table 2. Mean soil nitrogen [µg N g-1 dw] and pH (CaCl2) in the litter layer and in the upper 7 cm mineral soil in year 1 and year 2 at AK.
Mineral soil
year 1 year 2
Litter layer
Page 25: Table 3:
Change (CaCl2) into (CaCl2)
And remove Note: Depostion data and precipitation are sums.
year 1 year 2 1416 1067 NH4 + 3.5 4.6 NO3 -7.1 7.3 10.6 11.9 NH3 0.56 n.d. NO2 0.96 n.d. 1.52 n.d.
N-input by dry deposition
deposition
n.d. = not determined.
N-input by wet deposition/throughfall
Sum of wet deposition
Table 3. Wet and dry deposition [kg N ha-1 y-1], precipitation via throughfall, soil nitrogen and pH
(CaCl2) in study year 1 and study year 2 at AK.
Precipitation [mm]
Page 27: Table 5
Is table 5 and table 7 in the endversion that small as it is now ???
BGD
2, 1423–1455, 2005
N2O, NOxand CO2 fluxes in a calcareous
mountain forest soil
B. Kitzler et al. Title Page Abstract Introduction Conclusions References Tables Figures J I J I Back Close
Full Screen / Esc
Print Version
Interactive Discussion
EGU
Table 4. Mean annual CO2-C, N2O-N and mean NO-N losses in the vegetation period,
mini-mum and maximini-mum values and number of observations at AK for the two investigation years.
year 1 year 2 1416 1067 NH4 + 3.5 4.6 NO3 - 7.1 7.3 10.6 11.9 NH3 0.56 n.d. NO2 0.96 n.d. 1.52 n.d.
N-input by dry deposition
Sum of dry deposition
Note: Deposition data and precipitation are sums. n.d. = not determined.
N-input by wet deposition/throughfall
Sum of wet deposition
Table 3. Wet and dry deposition [kg N ha-1 y-1], precipitation via throughfall, soil nitrogen and pH (CaCl2)in study year 1 and study year 2 at AK. Precipitation [mm]
1
2
CO
2-C
N
2O
NO
[mg C m
-2h
-1]
year 1
mean
11.6
4.5
0.7
min-max (0-56.4) (-3.5 - 34.0) (0.4-2.5) N 95 242 105year 2
mean
19.7
4.4
0.5
min-max (0.2-83.0) (-2.9-40.6) (-0.1-7.6) N 96 288 145[µg N m
-2h
-1]
Table 4. Mean annual CO
2- C, N
2O - N and mean NO - N losses
in the vegetation period, minimum and maximum values and
number of observations at AK for the two investigation years.
3
4
5
6
7
18
1448BGD
2, 1423–1455, 2005
N2O, NOxand CO2 fluxes in a calcareous
mountain forest soil
B. Kitzler et al. Title Page Abstract Introduction Conclusions References Tables Figures J I J I Back Close
Full Screen / Esc
Print Version
Interactive Discussion
EGU
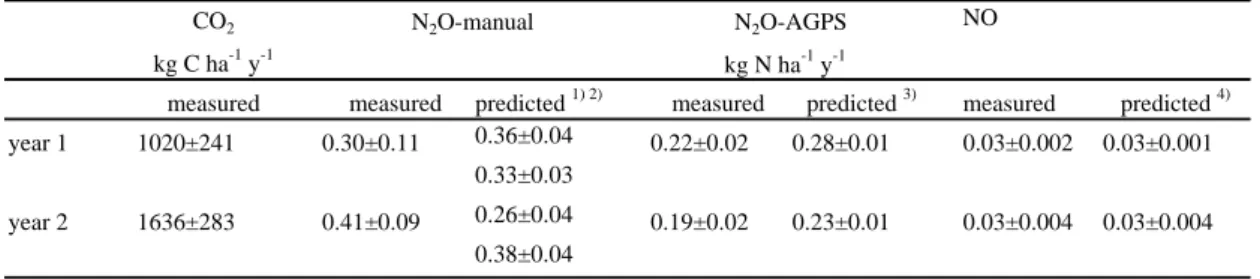
Table 5. Measured and predicted annual CO2-C, N2O-N losses (± S.E) from the manual
cham-bers for the two investigation years at the site AK; N2O-N (AGPS) and NO-N losses are
calcu-lated for June–November 2002 (year 1) and May–November 2003 (year 2).
CO2 NO
kg C ha-1 y-1
measured measured predicted 1) 2) measured predicted 3) measured predicted 4) year 1 1020±241 0.30±0.11 0.36±0.04 0.22±0.02 0.28±0.01 0.03±0.002 0.03±0.001
0.33±0.03
year 2 1636±283 0.41±0.09 0.26±0.04 0.19±0.02 0.23±0.01 0.03±0.004 0.03±0.004 0.38±0.04
Table 5. Measured and predicted annual CO2 - C, N2O - N losses (± S.E) from the manual chambers for the two investigation years at the site AK; N2O – N (AGPS) and NO - N losses are calculated for 06-11/2002 (year 1) and 05-11/2003 (year 2).
N2O-AGPS N2O-manual
1) – 4)
Model 1 - Model 4.
BGD
2, 1423–1455, 2005
N2O, NOxand CO2 fluxes in a calcareous
mountain forest soil
B. Kitzler et al. Title Page Abstract Introduction Conclusions References Tables Figures J I J I Back Close
Full Screen / Esc
Print Version
Interactive Discussion
EGU
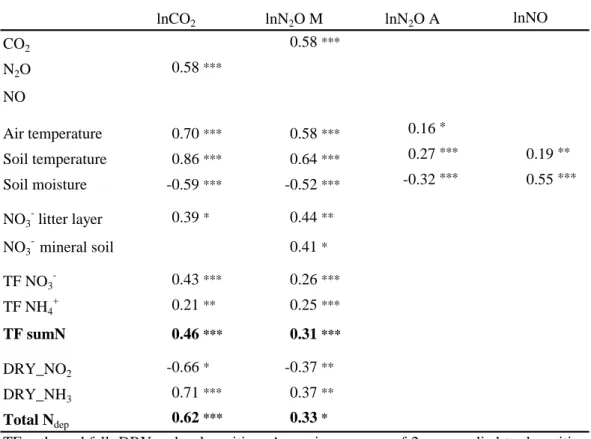
Table 6. Matrix of Pearson correlation coefficients for significant relationships of mean C- and
N-emissions (M=manual chambers, A=AGPS) and soil-, meteorological- and N-input data at
the site AK. Total N-deposition (Total Nd ep) is calculated from the first investigation year when
dry deposition was measured.
CO2 0.58*** N2O 0.58*** NO Air temperature 0.70*** 0.58*** 0.16* Soil temperature 0.86*** 0.64*** 0.27*** 0.19** Soil moisture -0.59*** -0.52*** -0.32*** 0.55*** NO3 litter layer 0.39* 0.44** NO3 - mineral soil 0.41* TF NO3 - 0.43*** 0.26*** TF NH4 + 0.21** 0.25*** TF sumN 0.46*** 0.31*** DRY_NO2 -0.66* -0.37** DRY_NH3 0.71*** 0.37** Total Ndep 0.62*** 0.33*
TF = throughfall, DRY = dry deposition. A moving average of 2 was applied to deposition data. Asterisk indicates the statistic significance (* p<0.05, **p<0.01, ***p<0.001).
Table 6. Matrix of Pearson correlation coefficients for significant relationships of mean C-
and N- emissions (M=manual chambers, A=AGPS) and soil-, meteorological- and N-input
data at the site AK. Total N-deposition (Total Ndep) is calculated from the first investigation
year when dry deposition was measured.
lnCO2 lnN2O M lnN2O A lnNO
BGD
2, 1423–1455, 2005
N2O, NOxand CO2 fluxes in a calcareous
mountain forest soil
B. Kitzler et al. Title Page Abstract Introduction Conclusions References Tables Figures J I J I Back Close
Full Screen / Esc
Print Version
Interactive Discussion
EGU
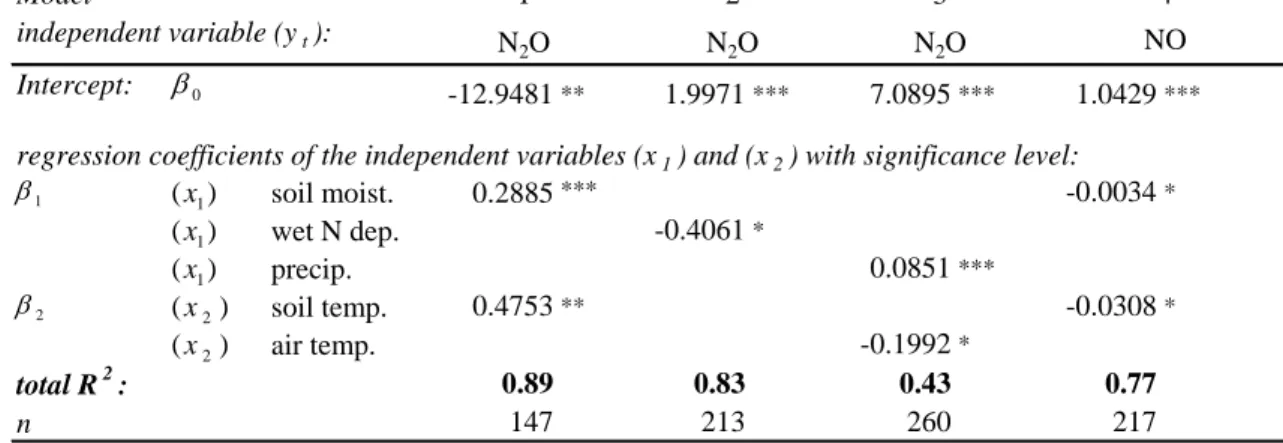
Table 7. Parameter estimation for the autoregression models 1 to 4 to predict N2O and NO
emissions from the study site, AK. Independent variables (x1) and (x2) for the individual models
are shown in the table (regression coefficients). Sample period is from April 2002–May 2004.
Intercept: -12.9481** 1.9971*** 7.0895*** 1.0429*** soil moist. 0.2885*** -0.0034* wet N dep. -0.4061* precip. 0.0851*** soil temp. 0.4753** -0.0308* air temp. -0.1992* 0.89 0.83 0.43 0.77 147 213 260 217
Table 7. Parameter estimation for the autoregression models 1 to 4 to predict N2O and NO emissions from
the study site, AK. Independent variables (x1) and (x2) for the individual models are shown in the table (regression coefficients). Sample period is from April 2002–May 2004.
Model 1 2 3 4
total R2: n
independent variable (yt):
Regression coefficients and model parameters are statistically significant at the * p<0.05, ** p<0.01, *** p<0.001 level.
NO N2O
N2O N2O
regression coefficients of the independent variables (x1) and (x2) with significance level:
2 β 1 β 0 β ) (x1 ) (x1 ) (x1 ) (x2 ) (x2
BGD
2, 1423–1455, 2005
N2O, NOxand CO2 fluxes in a calcareous
mountain forest soil
B. Kitzler et al. Title Page Abstract Introduction Conclusions References Tables Figures J I J I Back Close
Full Screen / Esc
Print Version
Interactive Discussion
EGU
Fig. 1
Apr Aug Dec Apr Aug Dec Apr Aug
NH 4 + - N g -1 dw 0 10 20 30 40 50 NO 3 - - N g -1 dw 0 10 20 30 40 50 30 60 90 120 150 30 60 90 120 150 litter layer mineral soil 2002 2003 2004
Fig. 1. Extractable NH+4 (circles) and NO−3 (triangles) in the litter layer and in the mineral soil at AK in the investigation years. Pooled samples (n=4) were taken from around the individual chambers.
BGD
2, 1423–1455, 2005
N2O, NOxand CO2 fluxes in a calcareous
mountain forest soil
B. Kitzler et al. Title Page Abstract Introduction Conclusions References Tables Figures J I J I Back Close
Full Screen / Esc
Print Version
Interactive Discussion
EGU Fig. 2
2002 2003 2004
Apr Aug Dec Apr Aug Dec Apr Aug
kg N ha -1 0.0 0.4 0.8 1.2 1.6 TF NH4+ TF NO3 -DRY NO2 DRY NH3
Fig. 2. Bar chart: Biweekly N-input (kg N ha−1) at AK measured in the two investigation years. Note: Dry deposition was measured only in the first year. Pie chart: Portion of throughfall (TF
NH+4, TF NO−3) and dry deposition (DRY NO2, DRY NH3) on annual N-input (kg N ha−1) in the
BGD
2, 1423–1455, 2005
N2O, NOxand CO2 fluxes in a calcareous
mountain forest soil
B. Kitzler et al. Title Page Abstract Introduction Conclusions References Tables Figures J I J I Back Close
Full Screen / Esc
Print Version Interactive Discussion EGU Fig. 3 2 0 0 2 2 0 0 3 2 0 0 4 M a y Ju l S e p N o v Ja n M a r M a y Ju l S e p N o v Ja n M a r M a y soi l moi stu re [cm 3 cm -3] 0 2 0 4 0 6 0 preci pi tati on [mm] 0 2 0 4 0 6 0 µg NO -N m -2 h -1 0 1 2 3 µg N2 O-N m -2 h -1 0 1 0 2 0 3 0 mg CO 2 -C m -2 h -1 0 2 5 5 0 soil tempe ra ture [°C] -5 0 5 1 0 1 5 b ) c ) d ) a )
Fig. 3. (a) Mean CO2 emissions (squares±S.E) measured with the manual chambers and
soil temperature [5 cm] (black line),(b) mean N2O emissions from manual (circles±S.E) and
automatic (diamonds) chambers, (c) mean NO emissions (±S.E) and, (d) daily precipitation
BGD
2, 1423–1455, 2005
N2O, NOxand CO2 fluxes in a calcareous
mountain forest soil
B. Kitzler et al. Title Page Abstract Introduction Conclusions References Tables Figures J I J I Back Close
Full Screen / Esc
Print Version
Interactive Discussion
EGU
Fig. 4
2002 2003 2004 Apr Aug Dec Apr Aug Dec Apr Aug
µg NO-N m -2 h -1 0 1 2 6 NO M 4; r2=0.77 µg N 2 O-N m -2 h -1 0 5 10 15 20 N2O M 3; r2=0.43 0 5 10 15 20 N2O M 1; r2=0.89 M 2; r2=0.83 a) b) c)
Fig. 4. Predicted versus measured N2O and NO emissions at AK between April 2002 and July 2004. Independent variables are soil moisture and soil temperature for model 1 (M 1)
and model 4 (M 4); N-deposition (NH+4 and NO−3) for model 2 (M 2) and, precipitation and air
![Table 2. Mean soil nitrogen [µg N g -1 dw] and pH (CaCl 2 ) in the litter layer and in the upper 5 cm mineral soil in year 1 and year 2 at AK.](https://thumb-eu.123doks.com/thumbv2/123doknet/14778140.594906/25.918.155.553.182.494/table-mean-nitrogen-cacl-litter-layer-upper-mineral.webp)
![Table 2. Mean soil nitrogen [µg N g -1 dw] and pH (CaCl 2 ) in the litter layer and in the upper 7 cm mineral soil in year 1 and year 2 at AK.](https://thumb-eu.123doks.com/thumbv2/123doknet/14778140.594906/26.918.166.536.218.483/table-mean-nitrogen-cacl-litter-layer-upper-mineral.webp)
![Table 3. Wet and dry deposition [kg N ha -1 y -1 ] , precipitation via throughfall, soil nitrogen and pH (CaCl 2 ) in study year 1 and study year 2 at AK](https://thumb-eu.123doks.com/thumbv2/123doknet/14778140.594906/27.918.112.598.248.459/table-deposition-precipitation-throughfall-nitrogen-cacl-study-study.webp)
![Fig. 3. (a) Mean CO 2 emissions (squares±S.E) measured with the manual chambers and soil temperature [5 cm] (black line), (b) mean N 2 O emissions from manual (circles±S.E) and automatic (diamonds) chambers, (c) mean NO emissions (±S.E) and, (d) daily prec](https://thumb-eu.123doks.com/thumbv2/123doknet/14778140.594906/33.918.64.649.115.468/emissions-measured-chambers-temperature-emissions-automatic-diamonds-emissions.webp)
