HAL Id: hal-00298012
https://hal.archives-ouvertes.fr/hal-00298012
Submitted on 6 Jun 2008HAL is a multi-disciplinary open access
archive for the deposit and dissemination of sci-entific research documents, whether they are pub-lished or not. The documents may come from teaching and research institutions in France or abroad, or from public or private research centers.
L’archive ouverte pluridisciplinaire HAL, est destinée au dépôt et à la diffusion de documents scientifiques de niveau recherche, publiés ou non, émanant des établissements d’enseignement et de recherche français ou étrangers, des laboratoires publics ou privés.
Importance of long-term monitoring for detecting
environmental change: lessons from a lowland river in
south east England
T. P. Burt, N. J. K. Howden, F. Worrall, M. J. Whelan
To cite this version:
T. P. Burt, N. J. K. Howden, F. Worrall, M. J. Whelan. Importance of long-term monitoring for detecting environmental change: lessons from a lowland river in south east England. Biogeosciences Discussions, European Geosciences Union, 2008, 5 (3), pp.2369-2379. �hal-00298012�
BGD
5, 2369–2379, 2008 Detecting long-term environmental change T. P. Burt et al. Title Page Abstract Introduction Conclusions References Tables Figures ◭ ◮ ◭ ◮ Back Close Full Screen / EscPrinter-friendly Version Interactive Discussion
Biogeosciences Discuss., 5, 2369–2379, 2008 www.biogeosciences-discuss.net/5/2369/2008/ © Author(s) 2008. This work is distributed under the Creative Commons Attribution 3.0 License.
Biogeosciences Discussions
Biogeosciences Discussions is the access reviewed discussion forum of Biogeosciences
Importance of long-term monitoring for
detecting environmental change: lessons
from a lowland river in south east England
T. P. Burt1, N. J. K. Howden2, F. Worrall3, and M. J. Whelan2
1
Department of Geography, Durham University, Durham DH1 3LE, UK
2
Department of Natural Resources, Cranfield Univ., Cranfield, Bedfordshire MK43 0AL, UK
3
Department of Earth Sciences, Durham University, Durham DH1 3LE, UK Received: 20 May 2008 – Accepted: 21 May 2008 – Published: 6 June 2008 Correspondence to: T. P. Burt ([email protected])
BGD
5, 2369–2379, 2008 Detecting long-term environmental change T. P. Burt et al. Title Page Abstract Introduction Conclusions References Tables Figures ◭ ◮ ◭ ◮ Back Close Full Screen / EscPrinter-friendly Version Interactive Discussion
Abstract
Rising nitrate concentrations in rivers and groundwater in regions with intensive agri-culture have been of concern for several decades. Long records of nitrate concen-tration are rare; in the UK, few pre-date 1974. Records from the River Stour from 1937 are analysed using “moving-windows”, to explore the effects of window width on 5
trend detection and process inference. Nitrate concentrations rose sharply from the late 1950s in response to widespread ploughing of grassland, but have fallen since the early 1980s, suggesting that widespread nitrogen control measures, which were intro-duced after the start of the downward trend, may not be the principal driver for recent change. Short windows (5 years) are too noisy; longer windows (10, 15 and 30 years) 10
identify signals (i.e. trends) more reliably. Since system response times can be of the order of 20–30 years, management decisions made on shorter data sets (even up to 15 years) could be misleading.
1 Introduction
High nitrate concentrations in rivers and groundwater have been a matter of concern 15
throughout the developed world for several decades (Burt et al., 1993). Initially, the main concern was about human health, reflected in the European Drinking Water Di-rective (EU 80/778). More recently, legislation, viz the European Nitrates DiDi-rective, has included reference to nitrate’s role in eutrophication (including coastal waters where pri-mary productivity is likely to be nitrogen-limited). Since the 1970s, a clear link has been 20
established between agricultural activity and nitrate transfer from land to surface and ground water (Royal Society, 1983). Of the nitrogen which enters surface waters in England and Wales, 61% estimated to originate from agricultural land and 32% from sewage effluent (Hunt et al., 2004), although these proportions will vary in different catchments. In rural catchments, nitrate losses from farmland predominate (>90%: 25
Direc-BGD
5, 2369–2379, 2008 Detecting long-term environmental change T. P. Burt et al. Title Page Abstract Introduction Conclusions References Tables Figures ◭ ◮ ◭ ◮ Back Close Full Screen / EscPrinter-friendly Version Interactive Discussion
tive demonstrated that protective action was considered to be a feasible alternative to water treatment as a remedy. However, at the catchment scale, solute transfers are often characterised by considerable delays in response times (Owens and Edwards, 1992; Kirchner et al., 2000) so detection of water quality improvements resulting from NVZ designation is usually impossible in the short term.
5
Studies of temporal variation in nitrate concentration in relation to changing climate and land use have focused on single river basins (Casey and Clarke, 1979; Jos ´e, 1989; Worrall and Burt, 1999) or combined records from many catchments to make regional comparisons (Roberts and Marsh, 1987; Betton et al., 1991; Stuart et al., 2007). For example, an upward trend in nitrate concentrations was reported for the period 1971– 10
1985 at Slapton Wood, a small catchment of mixed land use in Devon, UK (Burt et al., 1988). Agricultural intensification within the catchment (including ploughing of grass-land, increased ploughing frequency, higher fertiliser application rates, the introduction of new crops and higher stocking densities) is most likely to account for the upward trend (Burt and Johnes, 1997). After accounting for the trend, nitrate concentration 15
was shown to be controlled by antecedent rather than concurrent conditions. A “mem-ory effect” was evident with dry years followed by higher concentrations than expected in subsequent years and vice versa. Recent analysis (1971–2005) showed that the upward trend had not continued and that the “memory effect” had reversed in sign, suggesting change from supply- to transport-limited controls on nitrate leaching (Burt 20
and Worrall, 2007). There have been many studies of nitrate trends, but unless anal-ysis spans many years, short-term fluctuations caused by climatic variations may be misinterpreted as trends. For example, a recent report that 77% of c. 6000 surface wa-ter sites in England had a declining nitrate concentration (ADAS, 2006) must be viewed with caution since only five years’ data were employed and very few “trends” were sta-25
tistically significant. The same criticism can be levelled at an earlier study (Betton et al., 1991) which used similarly short windows.
BGD
5, 2369–2379, 2008 Detecting long-term environmental change T. P. Burt et al. Title Page Abstract Introduction Conclusions References Tables Figures ◭ ◮ ◭ ◮ Back Close Full Screen / EscPrinter-friendly Version Interactive Discussion
2 Analysis
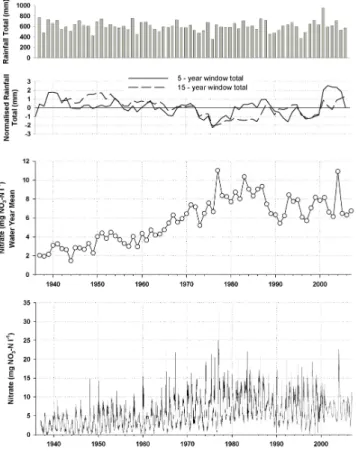
The Environment Agency of England and Wales provided nitrate records for the River Stour at Langham Bridge (Station Number 036006; National Grid Reference 62 TM 020 344): weekly data for 1937–2001; thereafter monthly samples. The National River Flow Archive provided catchment rainfall totals (Fig. 1). The catchment (578 km2) is 5
low-lying (7–128 m a.s.l.) and dominated by arable land (76% arable, 13% grassland, 4% urban: National Rivers Flow Archive). Annual mean nitrate-nitrogen concentrations (mg NO3-N l−1) and rainfall totals were calculated for water years beginning 1 October.
Fig. 2 presents partial correlations between annual mean nitrate concentration and independent variables: year number (Anno Domini); annual rainfall total in the current 10
year (rf); annual rainfall total lagged by one year (rf-1); and, annual rainfall total lagged by two years (rf-2). A partial correlation coefficient indicates correlation between a dependent variable and one independent variable whist holding constant effects of other specified independent variables (Johnston, 1987). Here, we consider the effect of year, independent of rainfall, and vice versa. Correlations are repeated using a 15
“moving window” analysis (Worrall et al., 2003) with the result plotted against the final year of the series. Consistent trends can be identified from patterns of consecutive significant correlations. Correlations are deemed significant if the probability of chance occurrence is less than 5%. Moving windows of 5, 10, 15 and 30 years are used to demonstrate the effect of window width on trend identification and the role of climatic 20
controls at varying time scales.
3 Results
A seasonal cycle is evident in the raw data with maxima in late winter and minima in late summer (Fig. 1). A long upward trend begins in the late 1950s (average rate of increase: 0.22 mg NO3-N l−1), peaking in the mid 1980s, after which concentrations
25
BGD
5, 2369–2379, 2008 Detecting long-term environmental change T. P. Burt et al. Title Page Abstract Introduction Conclusions References Tables Figures ◭ ◮ ◭ ◮ Back Close Full Screen / EscPrinter-friendly Version Interactive Discussion
in southern England, conspicuously high concentrations follow the severe 1975–1976 drought (Doornkamp et al., 1978). The annual series shows that lower concentrations are often associated with drier years in the 1990s. The higher concentrations that follow occur in wetter years, probably due to the flushing of excess nitrate is flushed from the system.
5
There is great inconsistency between successive 5-year windows (Fig. 2a). Depend-ing on when a period starts, it is possible to get very different trends. There are some statistically significant trends, positive and negative, but overall the record is noisy with no clear signal. Rainfall is highly variable in short records; correlations with rf are mainly positive as expected, with many non-significant results. Correlations with rf-1 10
are mainly negative when significant, implying exhaustion effects as described above, but there are three significant positive results in the dry period of the early 1990s. There are only six significant correlations with rf-2, three positive and three negative, but these do not suggest any consistent “memory effect”.
Ten-year windows show longer periods of significant upward trend but there are sig-15
nificant downward trends ending in the early 1990s (Fig. 2b); the influence of high concentrations in the mid-1980s is crucial. Correlations with rf are all positive including many significant results; correlations are weaker in the early 1970s, which was a very dry period. Correlations with rf-1 shift from mainly negative in windows ending in the mid 1980s to positive in the late 1990s. This mirrors findings elsewhere (Betton et al., 20
1991) and reflects high rainfall in this period. For rf-2, two correlations are significantly positive in the early 1960s and gradually become negative, but not significant.
Results from 15-year windows immediately indicate coherent patterns of change (Fig. 2c). Long-term trends are positive and mostly significant through to the mid 1980s. Trends then switch (over just five windows) to become significantly negative through 25
the 1990s. Correlations with rf are consistently positive and significant, except for windows ending 1964–1975. Patterns observed with 10-year windows are, therefore, confirmed when longer records are used. For correlations with rf-1, there is one period of significant negative correlations for windows ending in the 1980s, again matching
BGD
5, 2369–2379, 2008 Detecting long-term environmental change T. P. Burt et al. Title Page Abstract Introduction Conclusions References Tables Figures ◭ ◮ ◭ ◮ Back Close Full Screen / EscPrinter-friendly Version Interactive Discussion
what was seen using 10-year windows. There is no pattern with correlations for rf-2: all are non-significant.
Thirty-year windows show a very smooth pattern of change (Fig. 2d). Even so, strong positive trends identified by windows ending in the late 1980s are followed by a rela-tively rapid change with trends for the last 6 windows being significantly negative. High 5
concentrations in the period 1977–1986 exert key influence over observed trends. Cor-relations with rf, which are nearly all significantly positive, imply clear process links be-tween rainfall, nitrate leaching and river water concentrations. Correlations with rf-1 are significantly negative for windows ending around 1990, a period when annual rainfall totals were low. Once again, there are no significant correlations for rf-2.
10
4 Conclusions
We draw the following conclusions:
1. The pattern of long-term change revealed for the River Stour reflects the com-plex interactions between nitrogen availability in the catchment, hydrological con-trols over nitrate leaching and hydrogeologically controlled delays in solute break-15
through. The decrease in nitrate concentrations appears to have started in the early 1980s, before widespread nitrogen control measures were introduced. This suggests that much of the rising trend in the post-war period was caused by nitro-gen mineralisation in soil resulting from ploughing of old grassland (Whitmore et al., 1992) and augmented by increased nitrogen inputs.
20
2. Climatic fluctuations induce high-frequency variations around the long-term trend. Rainfall in the current year is significantly and positively correlated with nitrate con-centration, as would be expected; this is seen for 10-year windows and longer. The “memory effect” is seen to shift from negative to positive in the 10-year window. This could either relate to a shift from drier to wetter years, or indi-25
BGD
5, 2369–2379, 2008 Detecting long-term environmental change T. P. Burt et al. Title Page Abstract Introduction Conclusions References Tables Figures ◭ ◮ ◭ ◮ Back Close Full Screen / EscPrinter-friendly Version Interactive Discussion
have moved from supply-limited conditions (in which the overall trend appears to have been influenced predominantly by nitrogen availability in the system) to a transport-limited state (in which nitrogen availability is relatively constant and temporal variations in concentrations are controlled mainly by hydrological con-ditions). Both the timing and the shift mirror results found elsewhere (Burt and 5
Worrall, 2007). Only the negative memory effect is significant when longer win-dows are considered. Here, no significant lags are identified for rf-2.
3. Use of moving window analysis has shown that statistically significant trends may be identified for almost any time period. However, this study suggests that the response times for nitrate in this system can be of the order of 20–30 years (par-10
ticularly in the case of re-equilibration of soil organic matter levels in ploughed-out pasture: Whitmore et al., 1992). Management decisions made on shorter data sets (even up to 15 years) could, therefore, be misleading: interventions could be judged unsuccessful, even if they have had significant positive impact in the long term.
15
4. There are three implications for scientists and government agencies involved in environmental policy and management. First, in order to know if change is hap-pening, monitoring systems must be adequately maintained over long periods – records less than thirty years may well be of little use (Burt, 1994). Secondly, when results are analysed, they must be viewed within an appropriate historical 20
context (i.e. a sufficiently long record) in order to be able to distinguish the im-pact of policy-driven change from shorter-term variability. Thirdly, present nitrate management strategies have not taken into account the evidence that the impact of such strategies will always have a limited effect within the context of major land-use change (i.e. widespread ploughing of grassland in the post-war period). 25
The exceptional length of the nitrate record for the River Stour and the use of vary-ing window width has allowed us to understand the time constants of the system and
BGD
5, 2369–2379, 2008 Detecting long-term environmental change T. P. Burt et al. Title Page Abstract Introduction Conclusions References Tables Figures ◭ ◮ ◭ ◮ Back Close Full Screen / EscPrinter-friendly Version Interactive Discussion
contextualise management strategies. The maintenance of long-term records for rep-resentative river basins is crucial to assess present and future policy decisions.
References
ADAS: Nitrates in water – the current status in England (2006), Consultation report D1 to the UK Department of Environment, Food and Rural Affairs, http://www.defra.gov.uk/environment/
5
water/quality/nitrate/pdf/consultation-supportdocs/d1-nitrateswater.pdf, 2007.
Betton, C., Webb, B. W., and Walling, D. E.: Recent trends in NO3-N concentrations and loads in British rivers, Int. Assoc. Hydrol. Sci. Pub., 203, 169–180, 1991.
Burt, T. P.: Long-term study of the natural environment: perceptive science or mindless moni-toring?, Prog. Phys. Geog., 18, 475–496, 1994.
10
Burt, T. P. and Johnes, P. J.: Managing water quality in agricultural catchments, T. I. Brit. Geogr, NS22(1), 61–68, 1997.
Burt, T. P. and Worrall, F.: Non-stationarity in long time series: some curious reversals in the ‘memory’ effect, Hydrol. Process., 21, 3529–3531, 2007.
Burt, T. P., Arkell, B. P., Trudgill, S. T., and Walling, D. E.: Stream nitrate levels in a small
15
catchment in south west England over a period of 15 years, Hydrol. Process., 2, 267–284, 1988.
Burt, T. P., Heathwaite, A. L., and Trudgill, S. T.: Nitrate: Processes, Patterns and Management, John Wiley, Chichester, 1993.
Casey, H. and Clarke, R. T.: Statistical analysis of nitrate concentrations from the river Frome
20
(Dorset) for the period 1965–76, Freshwater Biol., 9, 91–97, 1979.
Casey, H., Clarke, R. T., and Smith, S. M.: Increases in nitrate concentrations in the River Frome (Dorset) Catchment related to changes in land use, fertiliser applications and sewage input, Chem. Ecol., 8, 105–117, 1993.
Doornkamp, J. C., Gregory, K. J., and Burn, A. S. (Eds.): Atlas of Drought in Britain 1975–76,
25
London, Institute of British Geographers, 1978.
Hunt, D. T. E., Dee, A. S., and Oakes, D. B.: Updating the estimates of the source apportion-ment of N to UK waters. Phase 2. Defra report by WRc plc, http://www.fwr.org/defrawqd/
wqd0002.htm (last access: 4 June 2008), 2004.
Johnston, R. J.: Multivariate Statistical Analysis in Geography, Longman, London, 1978.
BGD
5, 2369–2379, 2008 Detecting long-term environmental change T. P. Burt et al. Title Page Abstract Introduction Conclusions References Tables Figures ◭ ◮ ◭ ◮ Back Close Full Screen / EscPrinter-friendly Version Interactive Discussion
Jos ´e, P.: Long-term nitrate trends in the River Trent and four main tributaries, Regul. Rivers, 4, 43–57, 1989.
Kirchner, J. W., Feng, X., and Neal C.: Fractal stream chemistry and its implications for con-taminant transport in catchments, Nature, 403, 524–527, 2000.
National River Flow Archive (NRFA): Centre for Ecology and Hydrology, Wallingford, UK,http:
5
//www.ceh.ac.uk/data/nrfa/index.html, last access: 4 June 2008.
Owens, L. B. and Edwards, W. M.: Long-term groundwater quality changes from a one-time surface bromide application, J. Environ. Qual., 21, 406–410, 1992.
Royal Society.: The Nitrogen Cycle of the United Kingdom, Royal Society, London, 1983. Roberts, G. and Marsh, T.: The effects of agricultural practices on the nitrate concentrations in
10
the surface water domestic supply sources of Western Europe, International Association of Hydrological Sciences Publication, 164, 365–380, 1987.
Stuart, M. E., Chilton, P. J., Kinniburgh, D. G., and Cooper, D. M.: Screening for long-term trends in groundwater nitrate monitoring data, Q. J. Eng. Geol. Hydroge., 40, 361–376, 2007. Whitmore, A. P., Bradbury, N. J., and Johnson, P. A.: Potential contribution of ploughed
grass-15
land to nitrate leaching, Agr. Ecosyst. Environ., 39, 221–233, 1992.
Worrall, F. and Burt, T. P.: A univariate model of river water nitrate time series, J. Hydrol., 214, 74–90, 1999.
Worrall, F., Swank, W. T., and Burt, T. P.: Changes in nitrate export due to ecological succes-sion, land management and climate: developing a systems approach to integrated catchment
20
BGD
5, 2369–2379, 2008 Detecting long-term environmental change T. P. Burt et al. Title Page Abstract Introduction Conclusions References Tables Figures ◭ ◮ ◭ ◮ Back Close Full Screen / EscPrinter-friendly Version Interactive Discussion
Fig. 1. The time series of nitrate concentrations for the River Stour since 1937. The bottom graph shows the raw data series. The middle graph shows the annual mean concentrations. The upper graph shows annual rainfall (mm). All data for water years beginning 1 October. All nitrate concentrations in mg NO3-N l−1.
BGD
5, 2369–2379, 2008 Detecting long-term environmental change T. P. Burt et al. Title Page Abstract Introduction Conclusions References Tables Figures ◭ ◮ ◭ ◮ Back Close Full Screen / EscPrinter-friendly Version Interactive Discussion
Fig. 2. Moving window partial correlation results for 5, 10, 15 and 30-year windows. The independent variables are (from top to bottom): year, rainfall in current water year (rf), rainfall in previous water year (rf-1), and rainfall two years ago (rf-2). Solid and open symbols represent significant (p<0.05) and non-significant correlations respectively.