HAL Id: hal-00298742
https://hal.archives-ouvertes.fr/hal-00298742
Submitted on 26 Jul 2006HAL is a multi-disciplinary open access
archive for the deposit and dissemination of sci-entific research documents, whether they are pub-lished or not. The documents may come from teaching and research institutions in France or abroad, or from public or private research centers.
L’archive ouverte pluridisciplinaire HAL, est destinée au dépôt et à la diffusion de documents scientifiques de niveau recherche, publiés ou non, émanant des établissements d’enseignement et de recherche français ou étrangers, des laboratoires publics ou privés.
Temperatures and precipitation totals over the Russian
Far East and Eastern Siberia: long-term variability and
its links to teleconnection indices
V. V. Krokhin, W. M. J. Luxemburg
To cite this version:
V. V. Krokhin, W. M. J. Luxemburg. Temperatures and precipitation totals over the Russian Far East and Eastern Siberia: long-term variability and its links to teleconnection indices. Hydrology and Earth System Sciences Discussions, European Geosciences Union, 2006, 3 (4), pp.1915-1942. �hal-00298742�
HESSD
3, 1915–1942, 2006
Longterm variability and its links to teleconnection indices V. V. Krokhin and W. M. J. Luxemburg Title Page Abstract Introduction Conclusions References Tables Figures J I J I Back Close
Full Screen / Esc
Printer-friendly Version
Interactive Discussion Hydrol. Earth Syst. Sci. Discuss., 3, 1915–1942, 2006
www.hydrol-earth-syst-sci-discuss.net/3/1915/2006/ © Author(s) 2006. This work is licensed
under a Creative Commons License.
Hydrology and Earth System Sciences Discussions
Papers published in Hydrology and Earth System Sciences Discussions are under open-access review for the journal Hydrology and Earth System Sciences
Temperatures and precipitation totals
over the Russian Far East and Eastern
Siberia: long-term variability and its links
to teleconnection indices
V. V. Krokhin1and W. M. J. Luxemburg2
1
Laboratory of Natural System Modeling, Pacific Institute of Geography, FEB RAS Vladivostok, 690041, Radio st., 7, Russia,
2
Delft University of Technology, Faculty of Civil Engineering, Section of Water Resources, P.O. Box 5048, 2600 GA Delft, The Netherlands
Received: 22 March 2006 – Accepted: 9 June 2006 – Published: 26 July 2006 Correspondence to: W. M. J. Luxemburg ([email protected])
HESSD
3, 1915–1942, 2006
Longterm variability and its links to teleconnection indices V. V. Krokhin and W. M. J. Luxemburg Title Page Abstract Introduction Conclusions References Tables Figures J I J I Back Close
Full Screen / Esc
Printer-friendly Version
Abstract
The present study examines the spatial-temporal regime of the mean monthly tem-perature (MMT) and monthly precipitation (MPT) anomalies over the Russian Far East and Eastern Siberia for the period 1949–2003. The original data were analyzed spa-tially by means of complex principal component analysis and temporally by means of
5
the maximum entropy method and traditional Fourier spectral analysis. The interan-nual variability in these anomalies can be represented by the single dominant modes. These dominant modes oscillate with periods of about 2–3 yr and 6–8 yr that are ac-companied by statistically significant changes in such monthly teleconnection indices, as the Arctic and North Pacific Oscillations.
10
1 Introduction
The variations of surface-air temperature and precipitation are of vital social and eco-nomic importance (Watson et al., 2001). However, there is uncertainty in the question how climatic systems evolve. The potential reliability of climate models can be tested by comparing simulated climate variability with observed. So, the study of observed
15
climate variability may be summarized as a climate model verification problem (Majda et al., 2001).
The physical processes that are responsible for climate evolution are fundamentally non-linear. The most widespread linear correlation techniques are unable to clearly recognize the climatic signal in the short and noisy data series. Methods based on
20
modern spectral analysis techniques are relatively free from these disadvantages. Hancock and Yarger (1979) used classic Fourier spectral analysis to investigate the relationship between the Zurich annual sunspot number and state monthly mean tem-perature and precipitation for the contiguous United States. Schonwiese (1987) applied the cross-spectral analysis to provide physical reasons for periodic signals included in
25
anal-HESSD
3, 1915–1942, 2006
Longterm variability and its links to teleconnection indices V. V. Krokhin and W. M. J. Luxemburg Title Page Abstract Introduction Conclusions References Tables Figures J I J I Back Close
Full Screen / Esc
Printer-friendly Version
Interactive Discussion ysis to explore the connections between the prominent oscillations in temperature in
central England and solar activity.
At present the tandem “spectral analysis + principal component analysis” is more preferable than other methods (Ghil and Yiou, 1996). Suitable significance criteria for spectral and principal component analysis are more developed as distinct from wavelet
5
analysis.
In this work the complex research of the spatial-temporal regime of the mean monthly temperature (MMT) and monthly precipitation (MPT) anomalies is carried out for the Russian Eastern Siberia and Russian Far East for the period 1949–2003.
2 Data
10
At present the gridded precipitation and temperature data are available from Na-tional Centers for Environmental Prediction–NaNa-tional Center for Atmospheric Research (NCEP–NCAR) or the web-site (http://www.cru.uea.ac.uk/∼mikeh/) at the University of East Anglia (Hulme and Jones, 1993). However, it is well known that the interpola-tion of data, especially precipitainterpola-tion, from individual stainterpola-tion locainterpola-tions to a regular grid
15
proved to be critical (White, 2000), and, therefore, we used the stations data only. Time series of monthly precipitation and monthly mean temperatures are determined by 56 stations around Eastern Siberia and the Far East (Fig. 1) approximately be-tween 41◦N–60◦N and 100◦E–144◦E. Each 55-year series begins in 1949 and ends in 2003. Data series were obtained from the Department of Long-Term Weather
20
Forecast (Far East Regional Hydrometeorological Research Institute, Vladivostok,
http://www.hydromet.com).
From studies (Barnston and Livizey, 1987; King et al., 1998; Thompson and Wal-lace, 2000) we know that the different teleconnection indices can reflect the major part of multi-scale variability of the atmospheric dynamics. After that, many investigators
25
showed that variations in the teleconnection indices involve surface air temperature and precipitation (Thompson et al., 2000; Cavazos, 2000; Rodriguez-Puebla et al.,
HESSD
3, 1915–1942, 2006
Longterm variability and its links to teleconnection indices V. V. Krokhin and W. M. J. Luxemburg Title Page Abstract Introduction Conclusions References Tables Figures J I J I Back Close
Full Screen / Esc
Printer-friendly Version 2001). In the present work, we approximated the East Asian monsoon activity via
cir-culation teleconnection indices, i.e. the North-Pacific (NP) index and Arctic Oscillation (AO) index. These teleconnection circulation indices are distributed by NCEP–NCAR (Bell and Halpert, 1995).
The North-Pacific Oscillation is a decennial-scale mode, that is, the North-Pacific
5
index is the leading mode of October–March sea surface temperature variability pole-ward of 20◦N (Gershunov and Barnett, 1998; Biondi et al., 2001).
The Arctic Oscillation index is constructed by projecting 1000 mb height anomalies poleward of 20◦N onto the loading pattern of the AO. The loading pattern of the AO is defined as the leading mode of classic principal component analysis of monthly mean
10
1000 gPa height during 1949–2003 period.
We used the technique of data preparation described in Yuan and Martinson (2000). The precipitation and temperature anomaly time series, i.e. after removing the seasonal cycle, contained inter-annual and longer variability as well as linear trends. Then we removed any linear trend at every station point.
15
It is well known that monthly precipitation time series do not have a Gaussian function distribution, so a square root transformation was applied to the data (Krokhin, 2000).
3 Methods
The complex principal component analysis (CPCA), maximum entropy method (MEM) and traditional Fourier cross-spectral analysis techniques have been used to studying
20
traveling phenomena in the anomaly time series and their connectivity with different teleconnection indices.
The anomaly time series is affected by strong spatial-temporal (spectra-like) noise and locally quasi “errata” values. Fortunately, the temporal variability of anomaly time series was found spatially coherent at scales larger than the spatial noise (Genthon et
25
HESSD
3, 1915–1942, 2006
Longterm variability and its links to teleconnection indices V. V. Krokhin and W. M. J. Luxemburg Title Page Abstract Introduction Conclusions References Tables Figures J I J I Back Close
Full Screen / Esc
Printer-friendly Version
Interactive Discussion We used complex time series analysis which allows decomposing space-time
sig-nals into different modes when the variance is spread over a number of frequencies. The complex principal component analysis is a method which allows introduction of a temporal dimension in the classical principal component analysis for studying travel-ing waves in the atmosphere (Horel, 1984; Davis et al., 1991). The complex principal
5
component analysis method consists of transforming a spatial-temporal data set into a complex signal. In the study this was done using Hilbert transform of real time series computed for instance using the time-domain filtering Herrmann’s technique (1969). The variance can be decomposed into different modes, as for a classical component analysis, but the modes are no longer associated with only static variability but with a
10
dynamic one, taking into account the time evolution on the variability.
Further, the spatial patterns of only two dominant complex principal components were complex rotated orthogonally by the Varimax method (Kaiser, 1958; Bloomfield and Davis, 1994). The orthogonal rotation solution is “. . . less dependent on the domain of the analysis” (Horel, 1984, p. 1665).
15
For carrying out the CPCA we used the author’s package based on IMSL programs (International Mathematical and Statistical Library, 1982).
A main limitation on the performance of complex empirical orthogonal function anal-ysis is that modal spatial patterns from a time domain analanal-ysis of wide-banded signals should be interpreted cautiously (Merrifield and Guza, 1990). Therefore, the anomaly
20
time series were filtered by a Butterworth’s low-pass symmetric filter (Rabiner and Gold, 1975) to eliminate noise with periods less than 1 year prior to the variability anal-ysis. In order to minimize Gibbs’s end effects during spectral analysis the first and last 10% time steps of time series were tapered using a portion of a cosine bell distribution (Bloomfield, 2000).
25
Multivariate analysis methods, especially the complex empirical orthogonal function method, assume the data to be complete. When there are gaps the resulting complex correlation matrix shall be ill conditioned, it will be even not a positive definite and the numeric procedure will give several small negative eigenvalues. A way of overcoming
HESSD
3, 1915–1942, 2006
Longterm variability and its links to teleconnection indices V. V. Krokhin and W. M. J. Luxemburg Title Page Abstract Introduction Conclusions References Tables Figures J I J I Back Close
Full Screen / Esc
Printer-friendly Version this problem is to fill the missing data using an adequate method. In the study we
recovered missing data with the help of simulation techniques based on Bayesian in-ference for multivariate data with missing values. The computational routine NORM is described by Schafer (1997). NORM (version 2.02) is a Windows 95/98/NT program for multiple imputations of incomplete multivariate data. The program is available on
5
personal Schafer’s site (http://www.stat.psu.edu/∼jls/).
Although a CPCA is a very powerful method for identifying waves or modes, an ad-vantage of spectral analysis is that the techniques for determining the statistical signif-icance of the results are better developed. In the present paper, the maximum entropy method and the traditional cross-spectral analysis have been used to find connections
10
between anomaly time series and some circulation indices. Maximum entropy spectral analysis is a technique that can be used for relatively short and noisy time series when one needs more spectral resolution than provided by classic Fourier spectral analy-sis (Press et al., 1992). The maximum entropy method will tend to strongly localize spectral peaks. In practice, we used it in conjunction with traditional Fourier spectral
15
analysis (Bloomfield, 2000).
Cross-spectral analysis of coherence was obtained by Fast Fourier Transform us-ing the Welch’s periodogram technique (Welch, 1967; Jenkins and Watts, 1968). Co-herence can be regarded as evidence against meteorological distinctness (Brillinger, 1981).
20
In order to establish the significance of periodic signal components in the analyzed time series in the presence of white noise, Siegel’s test has been used. Siegel’s test is the most powerful test against many periodicities, i.e., for cases in which up to three periodic components are present in a time series (Percival and Walden, 1993).
HESSD
3, 1915–1942, 2006
Longterm variability and its links to teleconnection indices V. V. Krokhin and W. M. J. Luxemburg Title Page Abstract Introduction Conclusions References Tables Figures J I J I Back Close
Full Screen / Esc
Printer-friendly Version
Interactive Discussion
4 Complex principal analysis on precipitation and temperature anomaly time series
In an attempt to identify coherent spatial/temporal substructure in the anomaly time series, a CPCA was applied to identify traveling and standing waves (Horel, 1984).
Earlier, Salinger (1980a, b), Domroes et al. (1998), Varlamov et al. (1998),
5
Rodrigues-Puebla et al. (2001) established that time series of temperature and pre-cipitation anomalies in the different geographical regions could be represented with relatively few empirical orthogonal function modes. Later, White and Cherry (1999) found out that interannual variability in temperature and precipitation time series in New Zealand can be represented by a single dominant mode.
10
Here, we also demonstrate that interannual variability in Eastern Siberian and Far Eastern time series of temperature and precipitation anomalies can be represented by the single or two dominant modes.
CPCA of temperature anomalies yields the first mode explaining 55% of the total low-pass interannual variance. The complex empirical orthogonal functions are
pre-15
sented here in terms of its amplitude (arrow length) (Fig. 2a) and phase (arrow di-rection) (Fig. 2b). The vector pointing upwards (downwards) indicates that real and imaginary eigenvector components are in-phase (out-of-phase), a vector pointing to the right (left) indicates that the real part lags the imaginary on1/4 of a period. For
example, the clockwise vector rotation from west to east indicates that the wave travels
20
eastward (Horel, 1984; Tourre et al., 1999). In our case, the phase angle over our pattern remains quasi-constant, indicating that the temperature anomalies evolution is stationary. So, the temperature variability over our domain can be represented by a standing wave component.
However, “. . . ... precipitation variability is relatively elusive ... ” (Genthon et
25
al., 2003; citation from “Interannual Antarctic tropospheric circulation and precipita-tion variability”, 2003). Mode discriminaprecipita-tion and sorting through CPCA is thus more difficult and unreliable for precipitation than for temperature. Therefore we analyzed
HESSD
3, 1915–1942, 2006
Longterm variability and its links to teleconnection indices V. V. Krokhin and W. M. J. Luxemburg Title Page Abstract Introduction Conclusions References Tables Figures J I J I Back Close
Full Screen / Esc
Printer-friendly Version the first mode only. The remaining part of the total interannual variance is too
incon-sistent and noisy to be further analyzed with confidence. The dominant mode of the precipitation anomalies pattern (Figs. 3a, b) represents 22% of the total low-pass in-terannual variance. The relative parity among the weights in the real and imaginary components of the precipitation dominant mode (not shown) indicates that
precipita-5
tion anomalies have a greater propagational character associated with them than do temperature anomalies. In other words, this mode is a superposition of progressive and standing waves. Some eastward and equator directed spreading of the climatic signal occurs over our domain. This is shown by a clockwise rotation of vectors over Eastern Siberia and the Far East. The eastward and equator directed propagation is
10
consistent with the direction of propagation in atmospheric anomalies associated with the Arctic Circumpolar Wave. This is true for the middle latitudes in the Southern and Northern Hemispheres both (White and Cherry, 1999; White, 2000; Ambaum et al., 2001).
The real components of the temperature and precipitation anomaly time series for
15
dominant complex principal modes lags the imaginary components by approximately 2–3 yr (≈23–34 months) with coherence levels 0.91 and 0.87, respectively (Fig. 4). Real and imaginary component time series are orthogonal to each other (not shown), however these are not Hilbert transforms to each other (Horel, 1984). Note, that White and Cherry (1999) recommended to use a temporal lag between real and imaginary
20
components in statistical climate prediction models.
The dominant complex principal component temporal phase for the precipitation and temperature anomalies (here not shown) decreases with time for the most part of our time domain but it increases in some intermediate periods. On the one side this can be explained by the fact that analyzed time series consist of anomalies of varied time
25
scales. On the other hand, if the phase increases or decreases monotonically from 0 to 2 π over π, it can be inferred that a certain cyclicity exists in the anomalies time series (Venegas et al., 1998; Tourre et al., 1999). We shall demonstrate below that this may be explained when significant periodic signal components in the temporal coefficients
HESSD
3, 1915–1942, 2006
Longterm variability and its links to teleconnection indices V. V. Krokhin and W. M. J. Luxemburg Title Page Abstract Introduction Conclusions References Tables Figures J I J I Back Close
Full Screen / Esc
Printer-friendly Version
Interactive Discussion of complex principal modes of analyzed time series exist.
5 Cross-spectral analysis of the dominant complex principal modes of the tem-perature and precipitation anomaly time series and the teleconnection in-dices
Earlier, Rodriguez-Puebla et al. (2001) carried out the cross-spectral analysis of the
5
dominant ordinal principal modes of the precipitation over the Iberian peninsula and North Atlantic Oscillation index. In this paper it was emphasized, that “. . . when two time series have significant peaks at particular frequencies and the peaks are coherent, the local and global information constitutes a true climate signal” (citation from: Rodriguez-Puebla et al., 2001). In this study we used the approach of the paper
(Rodriguez-10
Puebla et al., 2001), to analyze the dominant complex principal modes of the anomaly time series and its relationship to the North-Pacific index and Arctic Oscillation index.
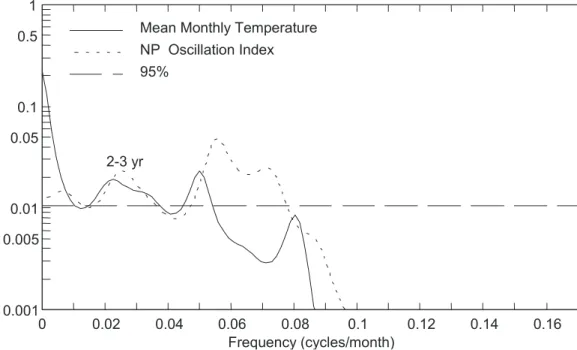
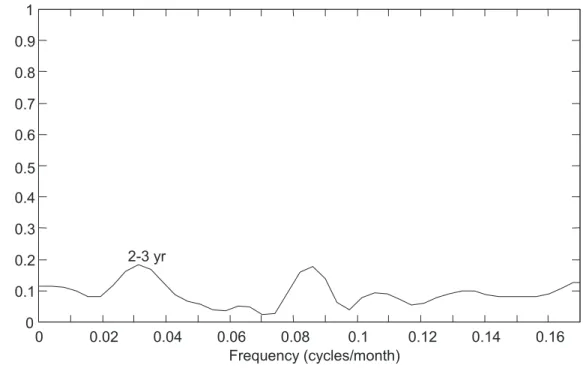
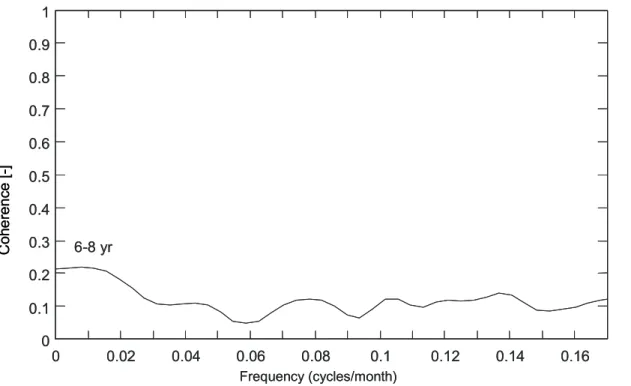
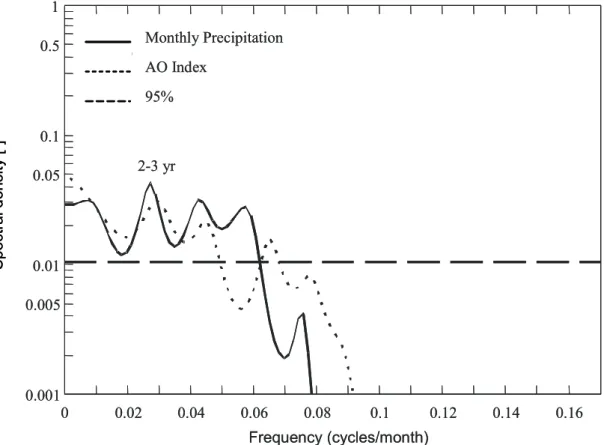
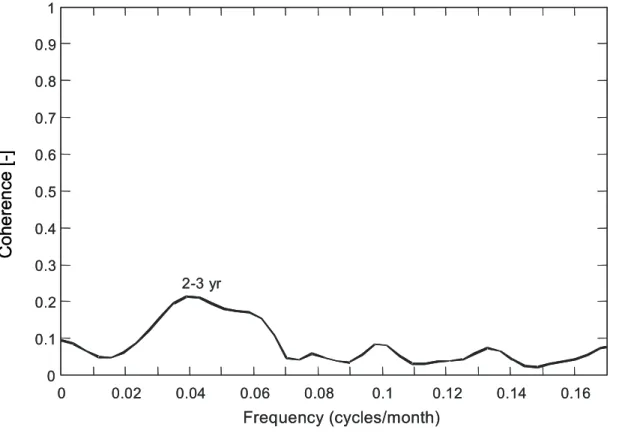
The dominant complex principal modes of temperature and precipitation anomalies reveal two significant spectral peaks with the period of ≈6–8 yr (72–96 mo) and the quasi-biennial oscillation with the period of 2–3 yr (≈23–34 mo) (Figs. 5a, 6a, 7a). The
15
coherence between the dominant complex principal modes of temperatures and pre-cipitation anomalies and the Arctic and North Pacific Oscillations suggest, in general, that the presence of these oscillations at 6–8 yr and 2–3 yr must be signals of variations because they are coherent at about 0.21 squared correlation. The critical value for co-herency estimates is 0.16 at 95% significance level (Brillinger, 1981) (Figs. 5b, 6b, 7b).
20
It is remarkable, that, interconnections are more stable for the dominant complex princi-pal mode of precipitation anomalies, than temperature anomalies (the variant “complex principal mode of precipitation anomalies and arctic oscillation” is not shown).
HESSD
3, 1915–1942, 2006
Longterm variability and its links to teleconnection indices V. V. Krokhin and W. M. J. Luxemburg Title Page Abstract Introduction Conclusions References Tables Figures J I J I Back Close
Full Screen / Esc
Printer-friendly Version
6 Discussion
The results in the present study possibly suggest that the Far Eastern mean monthly temperature and monthly precipitation anomaly time series can be associated with the biennial oscillation and are coherent with the stratospheric extra-tropical quasi-biennial oscillation and “El Nino-Southern Oscillation”. The Southern Oscillation is the
5
strongest climatic signal in the tropics. El Nino and La Nina are opposite phases of the “El Nino-Southern Oscillation” cycle (Troup, 1965; Philander, 1990). The stratospheric extra-tropical quasi-biennial oscillation is most easily identified as an alternation of de-scending westerly and easterly wind regimes in the lower stratosphere with a period varying from 22 to 34 months (Reed et al., 1961).
10
Earlier, the analogous results were found in surface temperature over the United States (Rasmusson et al., 1981), in annual precipitation over Far East (Eremin, 1982), for African rainfall time series (Ropelewski and Halpert, 1987), for Indian rainfall time series (Mooley and Parthasarathy, 1984). Shen and Lau (1995) found a quasi-biennial oscillation mode in East Asian summer monsoon rainfall. Lu (2003) found the
bien-15
nial oscillation signal in monthly station pressure, temperature and precipitation data in Taiwan. A midlatitude quasi-biennial oscillation was clearly identified by an in sur-face level pressure field over the northern hemisphere (Trenberth, 1975; Trenberth and Shin, 1984). It was found that the quasi-biennial oscillation of sea level pressure corre-sponds to the fluctuations of the midlatitude wavenumber-3 planetary wave. Gong and
20
Ho (2003) showed that Arctic Circumpolar Wave statistically significant influences upon East Asian Monsoon by way of north-south movement of the middle latitude zonal jet over East Asia.
The decadal oscillation (≈8 yr) is less revealed than the quasi-biennial oscillation. Nevertheless, the existence of this oscillation is also confirmed by many investigators.
25
For the European region, e.g., Rodriguez-Puebla et al. (2001) registered the oscillation with the period of 8-yr between the North Atlantic Oscillation Index and winter precipi-tation over the Iberian Peninsula.
HESSD
3, 1915–1942, 2006
Longterm variability and its links to teleconnection indices V. V. Krokhin and W. M. J. Luxemburg Title Page Abstract Introduction Conclusions References Tables Figures J I J I Back Close
Full Screen / Esc
Printer-friendly Version
Interactive Discussion For our geographical domain, Hanawa (1995) found that the Sverdrup transport and
Far East Zonal Index fluctuate with the 6–8 yr. periodicity over the Northwest Pacific. Tourre et al. (1999) emphasized 6–8 yr. periodicity in surface level pressure and sea surface temperature anomalies over North Pacific. Ponomarev et al. (1999) also esti-mated the oscillation period of sea surface temperature anomalies over North Pacific
5
as 6–8 yr. Wang et al. (2004) examined variability of temperature and precipitation over China and found that quasi-biennial oscillations are stronger in East China, than in West China.
The anomalies in atmospheric pressure, temperature and rainfall have similar sta-tistically significant periodicity on the different interannual timescales in different East
10
Asian regions. The present study does not pursue the purpose to analyze the physical nature of these interrelations. Different assumptions were suggested by many investi-gators. For example, Nakamura (2002) accentuated the main role of the storm activity for the East Asian monsoon intensity. We shall note only, that it is necessary to search for possible explanations, apparently, in the nature of climatic fluctuations, in the
so-15
called mechanism of long time memory in climatic system (von Storch and Zweirs, 1999). Research of the mechanism of long time memory is the further basis for climate modeling and, subsequently, forecasting.
7 Conclusions
We examined the spatial-temporal regime of the mean monthly temperature and
20
monthly precipitation totals anomalies over Russian Eastern Siberia and the Russian Far East for the period 1949–2003. We found that interannual variability in Eastern Siberian and Far Eastern time series of temperature and precipitation anomalies can be represented by the single or two dominant complex principal modes. It has been suggested that these modes have similar statistically significant periodicity on the
dif-25
ferent interannual timescales in different East Asian regions. Whether these modes are likely to be physically important in the earth’s atmosphere is an open question,
HESSD
3, 1915–1942, 2006
Longterm variability and its links to teleconnection indices V. V. Krokhin and W. M. J. Luxemburg Title Page Abstract Introduction Conclusions References Tables Figures J I J I Back Close
Full Screen / Esc
Printer-friendly Version however.
Thus, the further studies of climate of Eastern Siberia and the Far East must be closely joined with studies of the West Pacific monsoon, El Nino–Southern Oscilla-tion, surface air temperature and precipitation variations in the western Pacific and surrounding oceans, the tropospheric/stratospheric biennial oscillation, and the South
5
Asian Monsoon.
Acknowledgements. The authors are pleased to acknowledge the support of Netherlands
Or-ganization for Scientific Research Grant 047.014.011 “Statistical Properties of Flood Runoff of North Eurasia Rivers under Conditions of Climate Change” and Russian Foundation of Basic Research 01-05-65128.
10
References
Ambaum, M. H. P., Hoskins, B. J., and Stephenson, D. B.: Arctic Oscillation or North Atlantic Oscillation?, J. Climate, 14, 3495–3507, 1–4, 2001.
Barnston, A. G. and Livezey, R. E.: Classification, seasonality and persistence of lowfrequency atmospheric circulation patterns, Mon. Wea. Rev., 115, 1083–1126, 1987.
15
Bell, G. D. and Halpert, M. S.: NOAA Atlas N0 12. Interseasonal and interannual variability: 1986 to 1993, Climate Analysis Center, US, NOAA, 256, 1995.
Benner, T. C.: Central England temperatures: long-term variability and teleconnections, Int. J. Climatol., 19, 391–403, 1999.
Biondi, F., Gershunov, A., and Cayan, D. R.: North Pacific decadal climate variability since
20
1661, J. Climate, 14, 5–10, 2001.
Bloomfield, P.: Fourier analysis of time series: an introduction, John Wiley & Sons Inc., New York, 288 pp., 2000.
Bloomfield, P. and Davis, J. M.: Orthogonal rotation of complex principal components, Int. J. Climatol., 14, 759–775, 1994.
25
Brillinger, D. R.: Time series: data analysis and theory, Holden-Day, San Francisco, 500 pp., 1981.
Davis, J. M., Estis, F. L., Bloomfield, P., and Monahan, J. F.: Complex principal component analysis of sea-level pressure over the eastern USA, Int. J. Climatol., 11, 27–54, 1991.
HESSD
3, 1915–1942, 2006
Longterm variability and its links to teleconnection indices V. V. Krokhin and W. M. J. Luxemburg Title Page Abstract Introduction Conclusions References Tables Figures J I J I Back Close
Full Screen / Esc
Printer-friendly Version
Interactive Discussion
Domroes, M., Kaviani, M., and Schaefer, D.: An analysis of regional and intra-annual pre-cipitation variability over Iran using multivariate statistical methods, Theor. Appl. Climatol., 61(3–4), 151–159, 1998.
Eremin, P. G.: Quasi-biennial fluctuations in annual precipitation totals over the Far East, Works of FERHRI, St. Petersburg, (in Russian), Hydrometeorological Press, 101, 26–32, 1982.
5
Cavazos, T.: Using self-organizing maps to investigate extreme climate events: an application to wintertime precipitation in the Balkans, J. Climate, 13, 1718–1732, 2000.
Genthon, C., Krinner, G., and Sacchettini, M.: Interannual Antarctic tropospheric circulation and precipitation variability, Clim. Dyn., 21(3–4), 289–307, 2003.
Gershunov, A. and Barnett, T. P.: Interdecadal modulation of ENSO teleconnections, Bull. Amer.
10
Meteorol. Soc., 79, 2715–2725, 1998.
Ghil, M. and Yiou, P.: Spectral methods: what they can and cannot do for climatic time series, in: Decadal climate variability: dynamics and predictability, edited by: Anderson, D. and Willebrand, J., Elsevier, Amsterdam, 445–482, 1996.
Gong, D.-Y. and Ho, C.-H.: Arctic Oscillation signals in the East Asian summer monsoon, J.
15
Geophys. Res., 108(D2), 4066, 2003.
Hanawa, K.: Southward penetration of the Oyashio water system and the wintertime condition of midlatitude westerlies over the North Pacific, B. Hokkaido Natl. Fish. Res. Inst., 59, 103– 115, 1995.
Hancock, D. J. and Yarger, D. N.: Cross-spectral analysis of sunspots and monthly mean
tem-20
perature and precipitation for the contiguous United States, J. Atmos. Sci., 36, 746–753, 1979.
Herrmann, O.: Transversalfilter zur Hilbert-transformation, Arch. Elektr. Ubertragung, 23, 581– 587, 1969.
Horel, J. D.: Complex principal component analysis: theory and examples, J. Clim. Appl.
Mete-25
orol., 23, 1660–1673, 1984.
Hulme, M. and Jones, P. D.: A historical monthly precipitation data set for global land areas: Applications for climate monitoring and climate model evolution, Analysis methods of precip-itation on a global scale, WMO/TD-No. 558, Geneva, 1993.
Jenkins, G. M. and Watts, D. G.: Spectral analysis and its applications, Holden-Day, 525 p.,
30
1968.
Kaiser, H. F.: The varimax criterion for analytic rotation in factor analysis, Psychometrika, 23, 187–200, 1958.
HESSD
3, 1915–1942, 2006
Longterm variability and its links to teleconnection indices V. V. Krokhin and W. M. J. Luxemburg Title Page Abstract Introduction Conclusions References Tables Figures J I J I Back Close
Full Screen / Esc
Printer-friendly Version
King, J. R., Ivanov, V. V., Kurashov, V., Beamish, R. J., and McFarlane, G. A.: General circulation of the atmosphere over the North Pacific and its relationship to the Aleutian Low, NPAFC Doc. No. 318. 18 p., Dept. of Fisheries and Oceans, Sciences Branch – Pacific Region, Pacific Biological Station, Nanaimo, BC, Canada, V9R 5K6. Arctic and Antarctic Research Institute, 38 Bering Street, St.Petersburg, Russia, 199 397, 1998.
5
Krokhin, V. V.: About some methods of statistical data processing of the monthly precipitation totals, Works of FERHRI, St. Petersburg, (in Russian), Hydrometeorological Press., 148, no. 116–127, 2000.
Lu, M.-M.: The Biennial Oscillations in Taiwan, Terr. Atmos. Ocean. Sci., 13(4), 469–498, 2003.
10
Majda, A. I., Timofeyev, I., and Van Eijden, E.: A mathematical framework for stochastic climate models, Communications on pure and applied mathematics, vol. LIV, 0891–0974, 2001. Merrifield, M. A. and Guza, R. T.: Detecting propagating signals with complex empirical
orthog-onal functions: a cautionary note, J. Phys. Oceanogr., 20(10), 1628–1633, 1990.
Mooley, D. A. and Parthasarathy, B.: Fluctuations in All-India summer monsoon rainfall during
15
1871–1978, Climatic Change, 6, 287–301, 1984.
Nakamura, H., Izumi , T., and Sampe, T.: Interannual and decadal modulations recently ob-served in the Pacific storm track activity and East Asian winter monsoon, J. Climate, 15, 1855–1874, 2002.
Percival, D. B. and Walden, A. T.: Spectral analysis for physical applications. multitaper and
20
conventional univariate techniques, Cambridge University Press, Cambridge, United King-dom, 583 pp., 1993.
Philander, S. G.: El Nino, La Nina, and the Southern Oscillation, Academic Press, San Diego, CA, 289 pp., 1990.
Ponomarev, V. I., Trusenkova, O. O., Trusenkov, S. T., Kaplunenko, D. D., Ustinova, E. I., and
25
Polyakova, A. M.: The ENSO signal in the Northwestern Pacific, Impacts of the 1997/98 El Nino Event on the North Pacific Ocean and its marginal seas, PICES Sci. Rep., 10, 9–32, 1999.
Press, W. H., Flannery, B. P., Teukolsky, S. A., and Vetterling, W. T.: Numerical recipes in FORTRAN 77: the art of scientific computing, Second Edition, Cambridge University Press,
30
Cambridge, UK, 933 pp., 1992.
Rabiner, L. R. and Gold, B,: Theory and application of digital signal processing, Prentice-Hall, Englewood Cliffs, New Jersey, 762 pp., 1975.
HESSD
3, 1915–1942, 2006
Longterm variability and its links to teleconnection indices V. V. Krokhin and W. M. J. Luxemburg Title Page Abstract Introduction Conclusions References Tables Figures J I J I Back Close
Full Screen / Esc
Printer-friendly Version
Interactive Discussion
Rasmusson, E. M., Arkin, P. A., Chen, W.-Y., and Jalickee, J. B.: Biennial variations in surface temperature over the United States as revealed by singular decomposition, Mon. Wea. Rev., 109, 587–598, 1981.
Reed, R. J., Campbell, W. J., Rasmussen, L. A., and Rogers, D. G.: Evidence of the downward-propagating annual wind reversal in the equatorial stratosphere, J. Geophys. Res., 66, 813–
5
818, 1961.
Rodriguez-Puebla, C., Encinas, A. H., and Saenz, J.: Winter precipitation over the Iberian peninsula and its relationship to circulation indices, Hydrol. Earth Syst. Sci., 5, 233–244, 2001.
Ropelewski, C. F. and Halpert, M. S.: Global and regional scale precipitation patterns
associ-10
ated with El Nino/Southern Oscillation, Mon. Wea. Rev., 115, 1606–1626, 1987.
Salinger, M. J.: New Zealand climate: I. Precipitation patterns, Mon. Wea. Rev., 108, 1892– 1904, 1980a.
Salinger, M. J.: New Zealand climate: II. Temperature patterns, Mon. Wea. Rev., 108, 1905– 1912, 1980b.
15
Schafer, J. L.: Analysis of incomplete multivariate data, Chapman & Hall, London, 448 pp., 1997.
Schonwiese, C. D.: Moving spectral variance and coherence analysis and some applications on long air temperature series, J. Clim. Appl. Meteorol., 26, 1723–1730, 1987.
Shen A. and Lau, K.: Biennial oscillation associated with the East-Asian summer monsoon and
20
tropical sea-surface temperature, J. Meteorol. Soc. Japan, 73, 105–124, 1995.
Thompson, D. W. J. and Wallace, J. M.: Annular modes in the extratropical circulation, Part I: Month-to-month variability, J. Climate, 13, 1000–1016, 2000.
Thompson, D. W. J., Wallace, J. M., and Hegerl, G. C.: Annular modes in the extratropical circulation, Part II: Trends, J. Climate, 13, 1018–1036, 2000.
25
Tourre, Y. M., Kushnir, Y., and White, W. B.: Evolution of interdecadal variability in sea level pressure, sea surface temperature, and upper ocean temperature over the Pacific Ocean, J. Phys. Oceanogr., 29, 1528–1541, 1999.
Trenberth, K. E.: A quasi-biennial standing wave in the Southern Hemisphere and interrelations with sea surface temperature, Quart. J. Roy. Meteorol. Soc., 101, 55–74, 1975.
30
Trenberth, K. E. and Shin, W. K.: Quasi-biennial fluctuations in sea level pressures over the northern hemisphere, Mon. Wea. Rev., 112, 761–777, 1984.
HESSD
3, 1915–1942, 2006
Longterm variability and its links to teleconnection indices V. V. Krokhin and W. M. J. Luxemburg Title Page Abstract Introduction Conclusions References Tables Figures J I J I Back Close
Full Screen / Esc
Printer-friendly Version
Varlamov, S. M., Kim, Y.-S., and Han, Y.-H.: Recent variations of temperature in Eastern Siberia and the Russian Far East, Meteorology and Hydrology, 1, 19–28, 1998.
Venegas, S. A., Musak, L. A., and Straub, D. N.: An interdecadal climate cycle in the South Atlantic and its links to other ocean basins, J. Geophys. Res., 103(C11), 24 723–24 736, 1998.
5
Von Storch, H. and Zwiers, F. W.: Statistical Analysis in Climate Research, Cambridge Univer-sity Press, 484 pp., 1999.
Wang S., Jinhong, Z., and Jingning, C.: Interdecadal variability of temperature and precipitation in China since 1880, Adv. Atmos. Sci., 21(3), 307–313, 2004.
Watson, R. T., Dokken, D. J., Noguer, M., van der Linden, P., Johnson, C., and Pan, J. (Eds.):
10
IPCC (Intergovernmental Panel on Climate Change), Climate Change 2001: Synthesis re-port – A contribution of Working Groups I, II and III to the Third Assessment Rere-port of the Intergovernmental Panel on Climate Change, Cambridge University Press, UK, 398 pp., 2001.
Welch, P. D.: The use of fast Fourier transform for the estimation of power spectra: a method
15
based on time averaging over short modified periodograms, IEEE Trans. Audio and Electroa-coustics, AU-17, 209–215, 1967.
White, W. B.: Influence of the Antarctic circumpolar wave on Australian precipitation from 1958 to 1997, J. Climate, 13, 2125–2141, 2000:
White, W. B. and Cherry, N. J.: Influence of the Antarctic Circumpolar Wave upon New Zealand
20
temperature and precipitation during autumn–winter, J. Climate, 12, 960–976, 1999.
Yuan, X. and Martinson, D. G.: Antarctic sea ice extent variability and its global connectivity, J. Climate, 13, 1697–1717, 2000.
HESSD
3, 1915–1942, 2006
Longterm variability and its links to teleconnection indices V. V. Krokhin and W. M. J. Luxemburg Title Page Abstract Introduction Conclusions References Tables Figures J I J I Back Close
Full Screen / Esc
Printer-friendly Version
Interactive Discussion
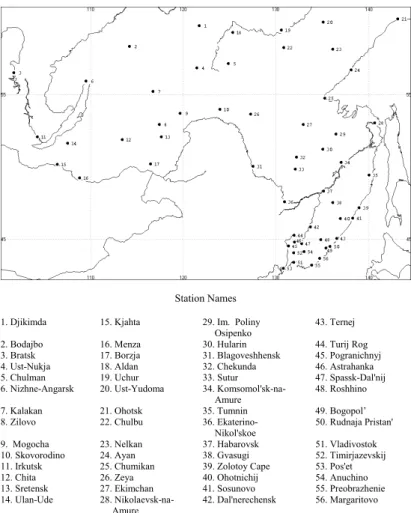
Station Distribution
Station Names
1. Djikimda 15. Kjahta 29. Im. Poliny
Osipenko 43. Ternej 2. Bodajbo 16. Menza 30. Hularin 44. Turij Rog 3. Bratsk 17. Borzja 31. Blagoveshhensk 45. Pogranichnyj 4. Ust-Nukja 18. Aldan 32. Chekunda 46. Astrahanka 5. Chulman 19. Uchur 33. Sutur 47. Spassk-Dal'nij 6. Nizhne-Angarsk 20. Ust-Yudoma 34. Komsomol'sk-na-
Amure 48. Roshhino 7. Kalakan 21. Ohotsk 35. Tumnin 49. Bogopol’ 8. Zilovo 22. Chulbu 36. Ekaterino-
Nikol'skoe
50. Rudnaja Pristan' 9. Mogocha 23. Nelkan 37. Habarovsk 51. Vladivostok 10. Skovorodino 24. Ayan 38. Gvasugi 52. Timirjazevskij 11. Irkutsk 25. Chumikan 39. Zolotoy Cape 53. Pos'et 12. Chita 26. Zeya 40. Ohotnichij 54. Anuchino 13. Sretensk 27. Ekimchan 41. Sosunovo 55. Preobrazhenie 14. Ulan-Ude 28. Nikolaevsk-na-
Amure 42. Dal'nerechensk 56. Margaritovo
Fig. 1. The locations of 56 stations where temperature and precipitation was measured over Eastern Siberia and the Far East from 1949 to 2003.
HESSD
3, 1915–1942, 2006
Longterm variability and its links to teleconnection indices V. V. Krokhin and W. M. J. Luxemburg Title Page Abstract Introduction Conclusions References Tables Figures J I J I Back Close
Full Screen / Esc
Printer-friendly Version
Interactive Discussion
EGU
Fig. 2a. First complex principal pattern (55% of total variance) of the Mean Monthly Tempera-ture anomalies.
HESSD
3, 1915–1942, 2006
Longterm variability and its links to teleconnection indices V. V. Krokhin and W. M. J. Luxemburg Title Page Abstract Introduction Conclusions References Tables Figures J I J I Back Close
Full Screen / Esc
Printer-friendly Version
Interactive Discussion
EGU
Fig. 2b. Spatial phase (in degrees) of the complex principal component of the Mean Monthly Temperature anomalies.
HESSD
3, 1915–1942, 2006
Longterm variability and its links to teleconnection indices V. V. Krokhin and W. M. J. Luxemburg Title Page Abstract Introduction Conclusions References Tables Figures J I J I Back Close
Full Screen / Esc
Printer-friendly Version
Interactive Discussion
EGU
Fig. 3a. First complex principal pattern (22% of total variance) of the Monthly Precipitation anomalies.
HESSD
3, 1915–1942, 2006
Longterm variability and its links to teleconnection indices V. V. Krokhin and W. M. J. Luxemburg Title Page Abstract Introduction Conclusions References Tables Figures J I J I Back Close
Full Screen / Esc
Printer-friendly Version
Interactive Discussion
EGU
Fig. 3b. Spatial phase (in degrees) of the complex principal component of the Monthly Precip-itation anomalies.
HESSD
3, 1915–1942, 2006
Longterm variability and its links to teleconnection indices V. V. Krokhin and W. M. J. Luxemburg Title Page Abstract Introduction Conclusions References Tables Figures J I J I Back Close
Full Screen / Esc
Printer-friendly Version Interactive Discussion EGU Frequency (cycles/month) 0 0.05 0.1 0.15 0.2 0.25 0.3 0.35 0.4 0.45 0.5 0 0.1 0.2 0.3 0.4 0.5 0.6 0.7 0.8 0.9 1
2-3 yr Mean Monthly Temperature
Monthly Precipitation
Coherenc
e
[-]
Fig. 4. Coherence between the real and imaginary parts of the temporal coefficients of the dominant principal components for the Mean Monthly Temperatures and Monthly Precipitation time series.
HESSD
3, 1915–1942, 2006
Longterm variability and its links to teleconnection indices V. V. Krokhin and W. M. J. Luxemburg Title Page Abstract Introduction Conclusions References Tables Figures J I J I Back Close
Full Screen / Esc
Printer-friendly Version Interactive Discussion EGU Frequency (cycles/month) 0 0.02 0.04 0.06 0.08 0.1 0.12 0.14 0.16 0.001 0.005 0.01 0.05 0.1 0.5 1 2-3 yr
Mean Monthly Temperature NP Oscillation Index 95% S pe ctra l d en si ty [-]
Fig. 5a. Spectra of the dominant complex principal mode of Mean Monthly Temperatures and the NP Oscillation Index.
HESSD
3, 1915–1942, 2006
Longterm variability and its links to teleconnection indices V. V. Krokhin and W. M. J. Luxemburg Title Page Abstract Introduction Conclusions References Tables Figures J I J I Back Close
Full Screen / Esc
Printer-friendly Version Interactive Discussion EGU Frequency (cycles/month) 0
0.02
0.04 0.06 0.08 0.1 0.12
0.14
0.16 0 0.1 0.2 0.3 0.4 0.6 0.7 0.8 0.9 1 2-3 yr 0.5 C ohe re nc e [ -]
Fig. 5b. Coherence between the dominant complex principal mode of Mean Monthly Temper-atures and the NP Oscillation Index.
HESSD
3, 1915–1942, 2006
Longterm variability and its links to teleconnection indices V. V. Krokhin and W. M. J. Luxemburg Title Page Abstract Introduction Conclusions References Tables Figures J I J I Back Close
Full Screen / Esc
Printer-friendly Version Interactive Discussion EGU Frequency (cycles/month) 0 0.02 0.04 0.06 0.08 0.1 0.12 0.14 0.16 0.001 0.005 0.01 0.05 0.1 0.5 1 6-8 yr 2-3 yr Monthly Precipitation NP Oscillation Index 95% Sp ectr al d en si ty [-] Frequency (cycles/month) 0 0.02 0.04 0.06 0.08 0.1 0.12 0.14 0.16 0.001 0.005 0.01 0.05 0.1 0.5 1 6-8 yr 2-3 yr Monthly Precipitation NP Oscillation Index 95% Sp ectr al d en si ty [-]
Fig. 6a. Spectra of the dominant complex principal mode of the Monthly Precipitation and the NP Oscillation Index.
HESSD
3, 1915–1942, 2006
Longterm variability and its links to teleconnection indices V. V. Krokhin and W. M. J. Luxemburg Title Page Abstract Introduction Conclusions References Tables Figures J I J I Back Close
Full Screen / Esc
Printer-friendly Version Interactive Discussion EGU Frequency (cycles/month) 0 0.02 0.04 0.06 0.08 0.1 0.12 0.14 0.16 0 0.1 0.2 0.3 0.4 0.5 0.6 0.7 0.8 0.9 1 6-8 yr Co he renc e [-] Frequency (cycles/month) 0 0.02 0.04 0.06 0.08 0.1 0.12 0.14 0.16 0 0.1 0.2 0.3 0.4 0.5 0.6 0.7 0.8 0.9 1 6-8 yr Co he renc e [-]
Fig. 6b. Coherence between the dominant complex principal mode of the Monthly Precipitation and the NP Oscillation Index.
HESSD
3, 1915–1942, 2006
Longterm variability and its links to teleconnection indices V. V. Krokhin and W. M. J. Luxemburg Title Page Abstract Introduction Conclusions References Tables Figures J I J I Back Close
Full Screen / Esc
Printer-friendly Version Interactive Discussion EGU
Frequency (cycles/month) 0 0.02 0.04 0.06 0.08 0.1 0.12 0.14 0.16 0.001 0.005 0.01 0.05 0.1 0.5 1 2-3 yr Monthly Precipitation AO Index 95% S pec tra l dens ity [-] Frequency (cycles/month) 0 0.02 0.04 0.06 0.08 0.1 0.12 0.14 0.16 0.001 0.005 0.01 0.05 0.1 0.5 1 2-3 yr Monthly Precipitation AO Index 95% S pec tra l dens ity [-]
Fig. 7a. Spectra of the dominant complex principal mode of the Monthly Precipitation and the AO Index.
HESSD
3, 1915–1942, 2006
Longterm variability and its links to teleconnection indices V. V. Krokhin and W. M. J. Luxemburg Title Page Abstract Introduction Conclusions References Tables Figures J I J I Back Close
Full Screen / Esc
Printer-friendly Version
Interactive Discussion
EGU
Fig.7a. : Spectra of the dominant complex principal mode of the Monthly Precipitation and
the AO Index.
Fig.7b. : Coherence between the dominant complex principal mode of the Monthly Precipitation
and the AO Index
Frequency (cycles/month) 0 0.02 0.04 0.06 0.08 0.1 0.12 0.14 0.16 0 0.1 0.2 0.3 0.4 0.5 0.6 0.7 0.8 0.9 1 2-3 yr C oh e re nc e [-] Frequency (cycles/month) 0 0.02 0.04 0.06 0.08 0.1 0.12 0.14 0.16 0 0.1 0.2 0.3 0.4 0.5 0.6 0.7 0.8 0.9 1 2-3 yr C oh e re nc e [-]
Fig. 7b. Coherence between the dominant complex principal mode of the Monthly Precipitation and the AO Index.