HAL Id: hal-00297032
https://hal.archives-ouvertes.fr/hal-00297032
Submitted on 28 Aug 2007
HAL is a multi-disciplinary open access
archive for the deposit and dissemination of
sci-entific research documents, whether they are
pub-lished or not. The documents may come from
teaching and research institutions in France or
abroad, or from public or private research centers.
L’archive ouverte pluridisciplinaire HAL, est
destinée au dépôt et à la diffusion de documents
scientifiques de niveau recherche, publiés ou non,
émanant des établissements d’enseignement et de
recherche français ou étrangers, des laboratoires
publics ou privés.
Studying the extremes: hydrometeorological
investigation of a flood-causing rainstorm over Israel
E. Morin, N. Harats, Y. Jacoby, S. Arbel, M. Getker, A. Arazi, T. Grodek, B.
Ziv, U. Dayan
To cite this version:
E. Morin, N. Harats, Y. Jacoby, S. Arbel, M. Getker, et al.. Studying the extremes:
hydrometeo-rological investigation of a flood-causing rainstorm over Israel. Advances in Geosciences, European
Geosciences Union, 2007, 12, pp.107-114. �hal-00297032�
www.adv-geosci.net/12/107/2007/ © Author(s) 2007. This work is licensed under a Creative Commons License.
Geosciences
Studying the extremes: hydrometeorological investigation of a
flood-causing rainstorm over Israel
E. Morin1, N. Harats1, Y. Jacoby1, S. Arbel2, M. Getker2, A. Arazi2, T. Grodek1, B. Ziv3, and U. Dayan1
1Department of Geography, Hebrew University of Jerusalem, Jerusalem, Israel 2Soil Erosion Research Station, Ministry of Agriculture and Rural Development, Israel 3The Open University of Israel, Raanana, Israel
Received: 1 March 2007 – Revised: 12 August 2007 – Accepted: 23 August 2007 – Published: 28 August 2007
Abstract. Analysis of extreme hydrometeorological events
is important for characterizing and better understanding the meteorological conditions that can generate severe rain-storms and the consequent catastrophic flooding. According to several studies (e.g., Alpert et al., 2004; Wittenberg et al., 2007), the occurrence of such extreme events is increasing over the eastern Mediterranean although total rain amounts are generally decreasing. The current study presents an anal-ysis of an extreme event utilizing different methodologies: (a) synoptic maps and high resolution satellite imagery for atmospheric condition analysis; (b) rainfall analysis by rain gauges data; (c) meteorological radar rainfall calibration and analysis; (d) field measurements for estimating maximum peak discharges; and, (e) high resolution aerial photographs together with field surveying for quantifying the geomorphic impacts. The unusual storm occurred over Israel between 30 March and 2 April, 2006. Heavy rainfall produced more than 100 mm in some locations in only few hours and more than 200 mm in the major core area. Extreme rain intensities with recurrence intervals of more than 100 years were found for durations of 1 h and more as well as for the daily rain depth values. In the most severely affected area, Wadi Ara, extreme flash floods caused damages and casualties. Specific peak discharges were as high as 10–30 m3/s/km2for catchments of the size of 1–10 km2, values larger than any recorded floods in similar climatic regions in Israel.
1 Introduction
Extreme hydrometeorological events over Mediterranean countries have enormous impact on nature and human ac-tivities (Schick, 1988; Benito et al., 1998). Such events are responsible for massive soil erosion from natural and
culti-Correspondence to: E. Morin
vated fields, landslides, morphological changes in rivers and catastrophic impacts on human activities. Recent studies in-dicate an increase of such extremes over the east Mediter-ranean (Alpert et al., 2004; Wittenberg et al., 2007) although the evidence on changes in total rainfall is mixed (Ben-Gai et al., 1998; Alpert et al., 2002). In other regions of the Mediter-ranean an increase of extremes and a decrease in total rainfall has been reported (Alpert et al., 2002).
In this study, different methodologies, that were developed and individually applied by several investigators, are used to assess and understand the nature and ground effects of an ex-treme storm that occurred over Israel in the spring of 2006. Synoptic storm analysis and high resolution satellite imagery are used for identifying the atmospheric conditions and the source of moisture (Dayan et al., 2001; Ziv et al., 2005); rain gauge data are analyzed to determine the frequency of daily and intensity maximums (Garti et al., 1999); radar rainfall analysis is used to determine the spatial rainfall distribution between the rain gauges and in remote areas (Greenbaum et al., 1998); field measurements are used for estimating maximum peak discharges, and high resolution aerial pho-tographs together with field surveying are used for quantify-ing the geomorphic impact (Garti et al., 1999; Greenbaum and Bergman, 2006).
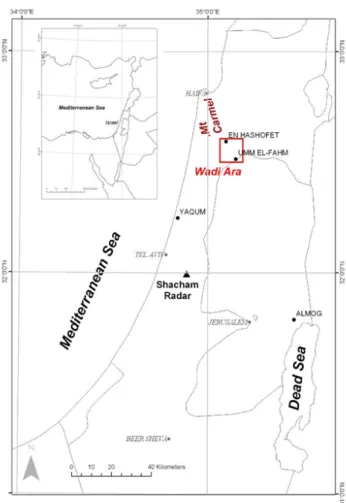
The extreme rainstorm event occurred between 30 March and 2 April 2006. The rainstorm produced heavy rainfall that lasted for several hours over small areas of a few km2 and caused severe flash floods, casualties and heavy dam-ages. Two main areas were exposed to the extreme rainfall (Fig. 1): (1) the Wadi Ara region located in central Israel, and (2) Jerusalem and the northern Dead Sea region. The flood in Wadi Ara was the most severe and damaging although a considerably high flow was also observed in the Nahal Og catchment located in the northern Dead Sea. This investi-gation focuses on the following aspects of the event: atmo-spheric conditions (Sect. 3); hydrometeorology outcome in terms of rainfall analysis (Sect. 4) and floods in Wadi Ara
108 E. Morin et al.: Hydrometeorological investigation of a flood-causing rainstorm
Fig. 1. Central and northern Israel. Main locations of interest are
marked.
(Sect. 5) and the geomorphologic impacts in the flooded re-gion (Sect. 6).
2 Methods
Several sources of information were utilized to analyze this event. Atmospheric conditions and air-back trajectory anal-ysis were based mainly on NCEP-NCAR reanalanal-ysis data (Kalnay et al., 1996; Kistler et al., 2001) and the Meteosat Second Generation (MSG) satellite imagery. Rainfall fre-quency analysis and annual data series were obtained from rain gauges measuring daily and intensity data that have long records (30–60 years). High space-time resolution (about 5 min and 1 km2)rain intensity data were obtained from a meteorological radar system (Shacham, Ben-Gurion airport, Fig. 1). Different radar elevation angles were used for differ-ent locations in order to match as much as possible an altitude of 500 m above ground and to minimize radar beam blockage (Morin and Gabella, in press). Radar reflectivity measure-ments (Z, mm6/m3) were transformed into rain intensities (R, mm/h) applying the power law relationship Z=108 R1.5.
The multiplicative parameter in this relation was found by the gauge bulk adjustment method (Krajewski and Smith, 2002). In this approach, an adjustment factor is applied to the initial radar estimates. The factor is equal to the sum of observed rain depth in gauges divided by the sum of radar rainfall ac-cumulations in pixels above the gauges. It was computed based on 170 rain gauges located within a distance of 10 to 100 km from the radar site. The mean rainfall estimation ference (i.e., the root mean square of the radar to gauge dif-ference) after calibration was 16 mm (34% of the gauge mean rain depth). The analysis of radar and gauge data indicated a spatial shift of about 5 km. Such a shift was not found in previous storm analysis and its cause is not yet absolutely clear, although it can be partly attributed to a vertical precip-itation gradient. The radar data were corrected accordingly. The hydro-morphological aspects of the storm were obtained from intensive field measurements, observations and aerial photographs interpretation, conducted immediately after the flood. Flood peak discharge values were estimated by ap-plying hydraulic analysis using high watermarks along the flooded channels. Channel cross sections were processed in the HEC-RAS hydraulic program (U.S. Army Corps of En-gineers, 2002) and flow discharge values that best matched the observed maximal water levels were selected for each lo-cation. Possible channel changes during the flow (mainly channel scour) had to be taken into account in the analysis.
3 Atmospheric conditions
During 30 March 2006 an upper trough developed over East-ern Europe and deepened toward Egypt (Fig. 2a), while mov-ing eastward at a rate of 5–10 m/s. As soon as the trough approached the eastern part of the Mediterranean a surface Red Sea Trough (RST) developed along the Red Sea and northward, to the Levant Region. On 1 April a closed cy-clone was formed within the upper trough and at the same time a closed surface cyclone was formed within the RST in north Saudi Arabia (Fig. 2b). On 2 April, the upper-level cyclone slowed its movement and the surface cyclone prop-agated slowly northward, so that in 12:00 UTC the distance between both cyclones (at 500 and 1000 hPa levels) was re-duced to ∼250 km.
On 1 April the cyclonic system was characterized by medium clouds with two main features. The first manifested itself as a long strip (100 km width and 1000 km length) that extended from central Saudi Arabia (26◦N, 40◦E, Fig. 3)
through Jordan, to eastern Turkey, coinciding with the warm conveyor belt of the cyclone (Fig. 4). The second feature of the vortex, corresponding to the convergence near the upper cyclone center, covered the north of Israel and the adjacent Mediterranean. Heavy rain were generated by this vortex over the northernmost part of Israel, in spite of the arid origin of the air (Saudi Arabia, as found by air-trajectory analysis). The intensity of the rains can be explained by the intensive
Fig. 2. Geopotential height at 1000 hPa and 500 hPa (bold) for (a) 31 March 2006 12:00 UTC and (b) 1 April 2006 12:00 UTC.
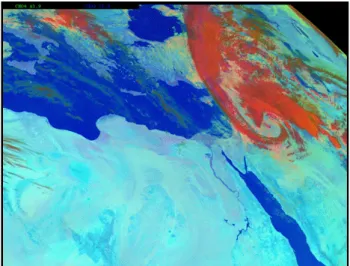
Fig. 3. MSG imagery for 1 April 2006 09:00 UTC, showing a vortex
of clouds surrounding the cyclone center and a long strip extending from Saudi Arabia towards Turkey.
upward motion, reaching 4 cm/s at 700 hPa level, quite high in synoptic scale terms. In the evening, between 12:00 and 22:00 UTC, the two cloud patterns veered cyclonically geared by the flow encircling the cyclone through its north-west sector and entered Israel from north-west. While approaching Israel they produced moderate and continuous rain, which in-tensified to showers accompanied by intense thunderstorms after 00:00 UTC over the central part of the country, reaching more than 100 mm within a few hours in several locations (as specified in Sect. 4 below).
It is noteworthy to mention the anomalies in the dynamic atmospheric conditions featuring this extreme event. The most intense showers were recorded while the study region was situated to the west of the center of the cyclonic sys-tem, where negative vorticity advection is expected, with its implied upper-level convergence and mid-level subsidence. However, the vertical velocity at the lower-levels in central
Fig. 4. Wind field (streamlines, relative to the cyclone) and height of
306 K isentropic surface for 1 April 12:00 UTC. The warm conveyor belt is represented by a thick arrow.
Fig. 5. Satellite imagery for 2 April 2006 10:40 UTC showing the
110 E. Morin et al.: Hydrometeorological investigation of a flood-causing rainstorm
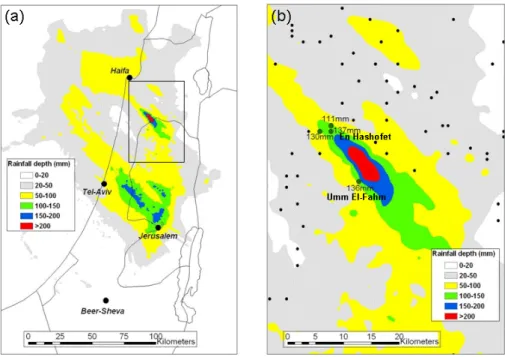
Fig. 6. Storm rain depth map based on calibrated radar data. (a) entire radar coverage, (b) enlargement of the flooded area (Wadi Ara). Rain
gauges are indicated by circles. Values are indicated for rain gauge with more than 100 mm.
Israel (not shown), where the most intense rain occurred, was
∼1 cm/s. The ascent can be explained by a positive vorticity
advection associated with an 850 hPa trough that extended from the cyclone core toward Cyprus (not shown) and by the interaction between the northwesterly winds and the sloping terrain of a normal orientation to the wind flow (Kahana et al., 2002). Moreover, convective rains are not necessarily dominated by the dynamics in the synoptic scale, but rather by meso-scale dynamics and the thermodynamic features of the air mass within which they occur. The meso-scale factor that seems to play a major role in this case is manifested by the spiral structure and motion of the cloudiness during the storm’s most active phase, as deduced from the animation of satellite imagery (exemplified in Fig. 5). The intensity of the convection can be attributed to the instability of the air which was the result of the cold air that penetrated the region to-gether with the deepening of the upper-trough. Another fac-tor that may further enhance convection is the combination of moisture flux from the Mediterranean Sea with the north-westerly air currents that enter the Israeli coastline. Such a situation is common for the winter cyclones (e.g., Shay-El and Alpert, 1991). But in contrast to the common situation, in which the air mass is originally dry, the air in this case was moist, at least at medium-levels.
4 Rainfall analysis
Convective rain cells forming a structure of narrow strips crossed the region moving in the band axis direction, from
northwest to southeast, precipitating high rain amounts over relatively small areas (Fig. 6a), a phenomenon often referred to as a “train effect”. This phenomenon is rare over the Eastern Mediterranean in which the precipitating elements move along a longitudinal axis rather than their usual zonal advance eastwards. The core of the most severely affected area (Wadi Ara, see Fig. 1) was not covered by rain gauges, although gauges located in the neighbouring areas recorded rain depths of 100–150 mm for the entire storm. High resolu-tion radar rainfall data revealed that at the storm core area to-tal rain depth of more than 200 mm covered an area of 17 km2 with a maximal value of 263 mm (Fig. 6b).
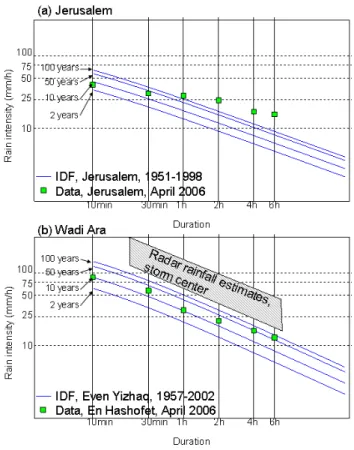
Two main areas with extreme rainfall were identified: (1) Jerusalem and the northern Dead Sea and (2) Wadi Ara (Fig. 1). Recurrence intervals for daily rain depth and max-imal rain intensity for different durations were obtained by frequency analysis for several representative rain gauges with long records (Table 1 and Fig. 7). In all cases, the Log-Pearson III probability distribution was fitted to the annual series and extrapolation was applied for up to 100 years re-currence intervals. The Log-Pearson III distribution is com-monly used for computing frequencies of maximal rain in-tensities and floods (e.g., Haan, 2002). Intensity-duration-frequency (IDF) curves were computed for the Jerusalem and Even Yizhaq (representing Wadi Ara) stations (Fig. 7). Long recurrence intervals (>100 years) were found for rain dura-tions longer than 1 hour and for daily depth in the two ar-eas mentioned above. Rain intensities for durations shorter than 1 h are considerably less extreme. The observed rain depth and rain intensity data at the En-Hashofet rain station,
Table 1. Daily rain depth for the storm at selected stations or radar pixel and associated recurrence intervals based on the same or nearby
rain station.
Data rain station Daily rain depth (mm) Recurrence interval (years) Frequency rain station Region
Jerusalem 112 >100 Jerusalem Jerusalem
Yaqum 110 25 Yaqum Coastal plain
Almog 38 >100 Kalia Northern Dead Sea
En Hashofet 119 43 En Hashofet Wadi Ara
Storm Core (radar) 263 >100 En Hashofet Wadi Ara
Fig. 7. Intensity-duration-frequency (IDF) curves computed for
Jerusalem (a) and Even Yizhaq (in Wadi Ara) (b) stations and max-imal rain intensity for the event for Jerusalem (a) and En Hashofet (b) stations. Radar-based rain intensities at the storm center in Wadi Ara are also indicated (shaded area in b).
located 10 km from the storm center in the Wadi Ara region, are associated with relatively short recurrence intervals (<50 years). On the other hand, rainfall data (depth and intensity) estimated from the radar at the storm center, are shown to have much longer recurrence intervals (Table 1 and shaded area in Fig. 7b).
A word of caution should be made that at the current stage of knowledge, radar rainfall estimates cannot be simply com-pared with statistics based on point gauge data as the two measuring devices are very different in terms of
uncertain-ties, spatial sampling and pixel size. However, in the analysis of the presented event, since no rain gauge exists at the storm core area, the comparison was done with ground hydrologi-cal and morphologihydrologi-cal evidences, discussed in the next sec-tions. It is interesting to note that daily rain depth values in the range of 110–120 mm near the coast occur on aver-age once in 25 years (e.g., Yaqum station), once in 43 years 20 km east of the coast inland (En-Hashofet, 250 m a.s.l.) and only once in more than 100 years in the mountainous region (Jerusalem, 750 m a.s.l.), 50 km east of the coast.
5 The Flash flood in Wadi Ara
The intense storm caused severe flash floods in a relatively small rural area in the Wadi Ara region (about 100 km2; Fig. 1). The region is characterized by traditional Middle-Eastern type villages: family-based neighbourhoods, adja-cent small cultivated terraces and natural slopes composed of bare rocky slopes with patches of soils of various depths. The area is relatively steep and includes several mountain ridges. It is situated southeast of the Ramot Menashe syncline. The lithology is characterized by chalk and marl from the upper Senon to the lower Eocene. The soils are brown and light Rendzina, with their thickness ranging between 0.5 m on the hillslopes and up to 2.5 m deep accumulation in the stream valleys. The land is mainly covered by Mediterranean dwarf-shrub steppe, small planted pine forest and active cultivated terraces. Land use is mainly for pasture.
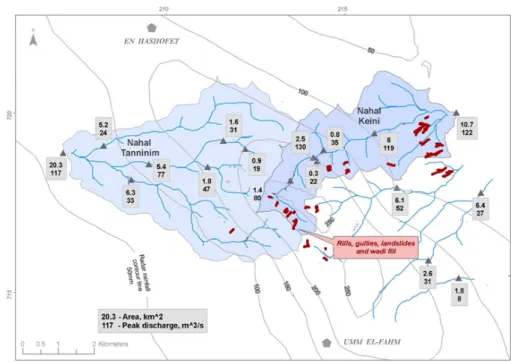
The core of the extreme flash flood in Wadi Ara, as de-scribed previously, was observed over the Keini and the Tan-ninim catchments (Fig. 8). No flash floods were generated in other areas. The peak discharges were identified by the high watermark left by the flood in the form of woody de-bris and sediment deposition on the channel banks. Ex-tremely high specific peak discharge values were measured (e.g., 27 m3/s/km2, 19 m3/s/km2and 11 m3/s/km2for catch-ments in the size of 1.8 km2, 6.3 km2and 10.7 km2, respec-tively). It should be noted that these values are higher than any previously recorded flood in similar regions in Israel. Figure 9 presents the maximal peak discharges observed for the current event at different catchment sizes in Wadi Ara. Comparison of this flood event with other floods previously
112 E. Morin et al.: Hydrometeorological investigation of a flood-causing rainstorm
Fig. 8. The main storm core in Wadi Ara. Radar rainfall contour lines, peak discharges, and geomorphologic impacts.
Fig. 9. Maximal peak discharge for catchments in sizes up to 30 km2 observed in central and northern Israel (empty squares), Mt. Carmel catchments (stars) and for the current analyzed event in Wadi Ara (red squares).
investigated in the Mt. Carmel region (about 30 km north of Wadi Ara, Fig. 1; Garti et al., 1999; Arbel et al., 2006), shows higher peak discharge values for the current flood for differ-ent catchmdiffer-ent sizes. Furthermore, it can be seen that these values are generally higher than the current envelope curve, i.e., higher than any past observed discharge in similar size catchments in central and northern Israel, both from regular stations and from estimations at ungauged locations after the flood (Fig. 9).
In terms of flood frequencies, the event runoff peaks were found to have long recurrence intervals as observed for the
Fig. 10. Empirical and analytical frequency function for peak
dis-charge in 10 km2catchments in the Mt. Carmel region. Red square indicates peak discharge value for the current event estimated for the 10.7 km2Keini catchment in Wadi Ara.
rain intensities and rain depth in this area. Since there is no runoff station in the flooded region, frequencies were computed for representative 10 km2catchments with similar soil and land use, located 20–30 km west-northwest of Wadi Ara in the Mt. Carmel region (Fig. 10). The Log-Pearson III probability distribution was fitted to a series of annual peak discharge values combined for several stations with a drainage area of about 10 km2. The estimated 122 m3/s event peak discharge for the Keini sub-catchment (10.7 km2)was much higher than the 68 m3/s computed peak discharge for a recurrence interval of 100 years.
Fig. 11. Geomorphic effects in the flooded area of Wadi Ara: (a) Deep incision in olive tree terrace; (b) Large scale landslide (100 m3); (c) Deep first-order tributary incision; (d) Headwater retreat; (e) Medium scale landslide (15 m3); (f) Deep rills incision below cultivated area.
6 Geomorphologic effects in Wadi Ara
Impressive geomorphic impacts on a distinct area were well distinguished in natural, forested and cultivated terrains. The following physical changes were observed and investigated: (a) landslides and debris flow adjacent to them (Fig. 11b; 11e); (b) deep rills incision in natural slopes and olive cul-tivated terraces (Fig. 11a; 11f); (c) headwater retreat down to the bedrock (Fig. 11d); (d) deep scour of small tributaries (Fig. 11c). In all cases, well developed soil was eroded indi-cating long term system stability.
As mentioned above, the storm core was over the Keini and the Tanninim catchments near their shared water divide. Both of the streams at this point were subjected to major ero-sion: channel incision till the bedrock up to 2.5 m deep in first-order tributaries (0.25–0.75 km2); channel widening in the main reaches and deeper erosion in cultivated terraces. The washed out soil, rocks and fluvial sediments, including large boulders of 40 cm, accumulated in fan-shape features in the tributary mouth, about 0.5 m higher than the pre-flood surfaces. As a result of high sediment concentration in the floodwaters, the alluvial fans built up partly by fluvial flow and partly by debris flows. Downstream, outside the core of the storm, the washed sediments accumulated in the main channels, changing the channel shapes and blocking engi-neering constructions.
Along natural slopes, well developed landslides, down to the bedrock, occurred at different slopes, between 20% and 60%. The landslides can be divided into three subgroups:
1 m3, 15 m3and 100 m3. The large and medium scale land-slides were usually found at about 2/3 of the slope with their scar along the exposed bedrock step (Fig. 11a); small scale landslides developed mainly in higher parts of the hill slope (Fig. 11b).
Outside the core of the storm, the above geomorphic fea-tures were not found.
7 Conclusions
The April 2006 rainstorm over Israel was an extreme event from many aspects. The storm was characterized by en-hanced convection resulting from meso-scale features, rela-tively high moisture at mid-atmospheric layers and intensive upward motion coinciding with the warm conveyor belt of the cyclone which originated from central Saudi-Arabia, with additional supplement from the Mediterranean Sea. These atmospheric conditions caused high rain amounts over rel-atively small areas. From the hydrometeorological aspect, such high rain amounts were found to be very rare, with recurrence intervals of more than 100 years for durations longer than 1 h as well as for daily rain depth. Radar rainfall data were calibrated and effectively used to identify the storm core in the Wadi Ara area where no rain gauges are located. The extreme rainfall caused severe flooding with estimated specific peak discharges, higher than any value previously observed in central and northern Israel (e.g., 27 m3/s/km2, 19 m3/s/km2and 11 m3/s/km2 for catchments in the size of
114 E. Morin et al.: Hydrometeorological investigation of a flood-causing rainstorm
1.8 km2, 6.3 km2 and 10.7 km2, respectively). Finally, the geomorphologic aspect of this study revealed very significant impacts of this event on hillslopes and channels. In Wadi Ara landslides, channel scours and other effects were found, well associated with the storm core area.
Acknowledgements. The authors would like to thank the dedicated staff of the Soil Erosion Research Station for their extensive field work after the flood. We thank Shacham (Mekorot) for the radar data and the Israel Meteorological Service for the rain gauge data. The investigation was partly supported by GLOWA – Jordan River Project funded by the German Ministry of Science and Education (BMBF), in collaboration with the Israeli Ministry of Science and Technology (MOST).
Edited by: P. Alpert, H. Saaroni, and E. Heifetz Reviewed by: two anonymous referees
References
Alpert, P., Ben-Gai, T., Baharad, A., Benjamini, Y., Yekutieli, D., Colacino, M., Diodato, L., Ramis, C., Homar, V., Romero, R., Michaelides, S., and Manes, A.: The paradoxical increase of Mediterranean extreme daily rainfall in spite of decrease in to-tal values, Geophys. Res. Let., 29(11), 31-1–31-4, 2002. Alpert, P., Osetinsky, I., Ziv, B., and Shafir, H.: Semi-objective
clas-sification for daily synoptic systems: Application to the Eastern Mediterranean climate change, Int. J. Climatol., 24(8), 1001– 1011, 2004.
Arbel, S., Getker, M., and Arazi, A.: The rare rainstorm of the 4– 6 December 2001 and the associated floods in the Mt. Carmel catchments, Special Report M-70, Soil Conservation Station, Ministry of Agriculture (in Hebrew), 2006.
Ben-Gai, T., Bitan, A., Manes, A., Alpert, P., and Rubin, S.: Spatial and temporal changes in annual rainfall frequency distribution patterns in Israel, Theor. Appl. Climatol., 61, 177–190, 1998. Benito, G., Grodek, T., and Enzel, Y.: The geomorphic and
hydro-logic impacts of catastrophic failure of flood-control-dams dur-ing the 1996 Biescas flood (Central Pyrenees, Spain), Zeitschrift fur Geomorphologie, N.F., 42, 417–437, 1998.
Dayan, U., Ziv, B., Margalit, A., Morin, E., and Sharon, D.: A se-vere autumn storm over the middle-east: synoptic and mesoscale convection analysis, Theor. Appl. Climatol., 69, 103–122, 2001. Garti, R., Morin, E., Getker, M., Arbel, S., Gefen, O., Tamir, M., Gotesman, M., Farhi, R., and Fisik, E.: The rare rainstorm of the 31 December 1998 and the associated floods in the Mt. Carmel catchments, Special Report M-65, Soil Conservation Station, Ministry of Agriculture (in Hebrew), 1999.
Greenbaum, N., Margalit, A., Schick, A. P., Sharon, D., and Baker, V. R.: A high magnitude storm and flood in a hyperarid catch-ment, Nahal Zin, Negev Desert, Israel, Hydrol. Process., 12, 1– 23, 1998.
Greenbaum, N. and Bergman, N.: Formation and evacuation of a large gravel-bar deposited during a major flood in a Mediter-ranean ephemeral stream, Nahal Me’arot, NW Israel, Geomor-phology, 77(1–2), 169–186, 2006.
Haan, C. T.: Statistical Methods in Hydrology, 2nd edition, Iowa State Press, 2002.
Kahana, R., Ziv, B., Enzel, Y., and Dayan, U.: Synoptic climatology of major floods in the Negev Desert, Israel, Int. J. Climatol., 22, 867–882, 2002.
Kalnay, E., Kanamitsu, M., Kistler, R., Collins, W., Deaven, D., Gandin, L., Iredell, M., Saha, S., White, G., Woollen, J., Zhu, Y., Chelliah, M., Ebisuzaki, W., Higgins, W., Janowiak, J., Mo, K. C., Ropelewski, C., Wang, J., Leetmaa, A., Reynolds, R., Jenne, R., and Joseph, D.: The NCEP/NCAR 40-year reanalysis project, B. Am. Meteorol. Soc., 77(3), 437–471, 1996.
Kistler, R., Kalnay, E., Collins, W., Saha, S., White, G., Woollen, J., Chelliah, M., Ebisuzaki, W., Kanamitsu, M., Kousky, V., van den Dool, H., Jenne, R., and Fiorino, M.: The NCEP/NCAR 50-year reanalysis: monthly means CD-ROM and documentation, B. Am. Meteorol. Soc., 82(2), 247–267, 2001.
Krajewski, W. F. and Smith, J. A.: Radar hydrology: rainfall esti-mation, Adv. Water Resour., 25, 1387–1394, 2002.
Morin, E. and Gabella, M.: Radar-based quantitative precipitation estimation over Mediterranean and dry climate regimes, J. Geo-phys. Res., in press, 2007.
Shay-El, Y. and Alpert, P.: A diagnostic study of winter diabatic heating in the Mediterranean in relation to cyclones, Q. J. Roy. Meteor. Soc., 117, 715–747. 1991.
Schick, A. P.: Hydrologic aspects of floods in hyper-arid envi-ronments, in: Flood Geomorphology, edited by: Baker, V. R., Kochel, R. C., Patton, P. C., Wiley, New York, 189–203, 1988. U.S. Army Corps of Engineers: HEC-RAS River Analysis System
Hydraulic Reference Manual, Version 3.1, Rep. CPD-69, Davis, California, 2002.
Wittenberg, L., Kutiel, H., Greenbaum, N., and Inbar, M.: Short-term changes in the magnitude, frequency and temporal distribu-tion of floods in the Eastern Mediterranean region during the last 45 years — Nahal Oren, Mt. Carmel, Israel, Geomorphology, 84, 181–191, 2007.
Ziv, B., Dayan, U., and Sharon, D.: A mid-winter, tropical extreme flood-producing storm in southern Israel: Synoptic scale analy-sis, Meteorol. Atmos. Phys., 88(1–2), 53–63, 2005.