ARCHIVES
Data Collection Framework for Vehicular
On-Board-Diagnostic Systems
by
Chenxia Liu
Submitted to the Department of Electrical Engineering and Computer
Science
in partial fulfillment of the requirements for the degree of
Master of Engineering in Electrical Engineering and Computer Science
at the
MASSACHUSETTS INSTITUTE OF TECHNOLOGY
September 2011
@
Chenxia Liu, MMXI. All rights reserved.
The author hereby grants to M.I.T. permission to reproduce and to
distribute publicly paper and electronic copies of this thesis document
in whole or in part in any medium now known or hereafter created.
Author ...
...
Department of Electrical Engineering and Computer Science
Cb
Certified
by..
4,
'(7
/
Certified by.
6
August 19, 2011
Hari Balakrishnan, Professor
Thesis Supervisor
August 19, 2011
... ....
... ....
....
....
Lewis Girod, Researcher
Thesis Co-Supervisor
August 19, 2011
Accepted by ...
Prof. Dennis M. Freeman
Chairman, Masters of Engineering Thesis Committee
Data Collection Framework for Vehicular
On-Board-Diagnostic Systems
by
Chenxia Liu
Submitted to the Department of Electrical Engineering and Computer Science on August 19, 2011, in partial fulfillment of the
requirements for the degree of
Master of Engineering in Electrical Engineering and Computer Science
Abstract
Most modern vehicles contain an On-Board-Diagnostic (OBD) system that can col-lect a wide range of system data from the vehicle. In aggregation, such data could be applied towards solving the problems of accident prevention, vehicular safety, and driving efficiency. In this paper, we describe our design and implementation of a dis-tributed vehicular data collection framework for running applications that aggregate customized OBD data on demand.
Our framework is low-capital, low-maintenance, and flexible enough to handle several types of data requests. In our evaluation, the framework achieves within 2% accuracy for data collection at 1-second interval when compared to an externally calculated benchmark. We also simulate data collection under non-ideal conditions and methodically characterize the drift of accuracy as total percentage of packet loss rises for different patterns of data loss; in our experiment, we conclude that for our sampled data, dropped blocks have the greatest impact on accuracy.
Thesis Supervisor: Hari Balakrishnan Title: Professor
Thesis Co-Supervisor: Lewis Girod Title: Researcher
Acknowledgments
I would like to express my thanks to my supervisor, Hari Balakrishnan, for getting me interested in this project by providing lots of initial ideas and applications to focus on. His interest in this field and openess to giving and expounding on ideas has been a great inspiration to me.
I would also like to thank Lewis Girod, for getting me up to speed on this the background of this project, helping me hash out my designs at the beginning of the project, and providing constant feedback and ideas when I hit difficult parts of the project.
Finally, I would like to thank Calvin Newport for discussing project ideas and providing insightful feedback and interesting perspectives on this project, as well as helping me build up the background for working on this project right from the start.
Contents
1 Introduction 1.1 Goals . . . . 1.2 On-Board-Diagnostics 1.3 Bluetooth ... 1.4 Outline. . . . . 2 Related Work 3 Design 3.1 Design Goals . . . . 3.2 Operational Overview . . . 3.3 Architecture . . . . 3.3.1 Remote Server . . . . 3.3.2 Smartphone . . . . . 3.3.3 Cap Device . . . . . 3.4 Security . . . . 4 Implementation 4.1 Pre-Collected Data . . . . . 4.2 Cap-Device Code Structure4.2.1
Query
Thread . . . 4.2.2 Bluetooth Thread . 4.2.3 Application Threads 13 14 14 15 16 17 19 19 20 21 21 22 23 24 26 27 27 28 29 31. . . .
.-. .-. .-. .-. .-. .-. .-. .-. .-. .-. .-. .-. .-. .-. .-. .-. .-. .-. .-. .-. .-. .-. .-. .-. .-. .-.
... ...
..
.... ... ...
..
. . . .
4.3 Smartphone "Mid-Client" Application . . . . 34 4.3.1 Threads . . . . 34 4.3.2 Operation . . . . 34 5 Evaluation 36 5.1 Data Logs ... ... .. ... .. 37 5.2 Framework Accuracy . . . . 38 5.2.1 Methodology . . . . 38
5.2.2 Results and Analysis . . . . 38
5.3 Non-Ideal Data Collection . . . . 39
5.3.1 Methodology and Results . . . . 41
5.3.2 Discontinuous Connection . . . . 43
5.3.3 Lack of Connectivity . . . . 44
6 Conclusions 46 7 Future Work 50 7.1 A pplications . . . . 50
List of Figures
1-1 Sample OBD protocol response. . . . . 3-1 Design Overview . . . .
4-1 Prototype Implementation. . . . . 4-2 Cap-device Code Structure. . . . . 4-3 Format of message protocol from phone to cap-device .. . . . . 5-1 Logged Speed Traces . . . . 5-2 Lossy Collection . . . . 5-3 Discontinuous Collection . . . . 5-4 Downsampled Collection . . . . 5-5 Lossy Collection: Mileage % Difference Standard Deviation . . . . . 5-6 Discontinuous Collection: Mileage % Difference Standard Deviation 5-7 Downsampled Collection: Mileage % Difference . . . . 6-1 Tolerated Data Loss Percentage . . . .
15 20 . 26 . 28 . 31 37 40 40 41 42 44 45 47
List of Tables
Chapter 1
Introduction
Many modern vehicles now have the capability to measure and monitor an extensive set of their functions through On-Board-Diagnostics system. On-Board-Diagnostics, or OBD for short, can be used to collect real-time data from a vehicle, such as fuel pressure or current speed. More commonly, it is used in checking the Diagnostic Trouble Codes (DTC) after something goes wrong; these DTCs store snapshots of problem-causing states for later diagnosis.
As mentioned, the predominant use of OBD is in diagnosing problems with a vehicle after a malfunction. However, this is a very limited use of such data, and our goal is to increase the availability and accessibility of OBD data, so that it can be used more easily beyond the scope of diagnosing problems that have already occurred. In terms of prevention, statistical trends of driving or usage trends could be very applicable in guiding prevention and safety measures. Data such as fuel consumption could even be correlated with GPS to help determine route fuel efficiency.
To this end, we have designed a low-capital, low-maintenance framework that can collect a flexible range of OBD data from vehicles. Via this framework, the remote server can send data requests to our low-cost device physically plugged into a vehicle's OBD port and receive logs of custom-requested data. A smartphone acts as a proxy for the server to carry out lower level requests, so a continuous connection between server and OBD device is not necessary.
1.1
Goals
Although projects using and collecting OBD data from vehicles are not uncommon, our goals are specifically to define a low-cost, low-capital model for running vehicular sensor applications.
In this project, we incorporate a custom-designed OBD interface device, a small unobtrusive "cap" that plugs into the vehicle OBD port for collecting OBD data. This "cap-device" communicates its data through bluetooth, and can provide sensor data beyond OBD, such as accelerometer data, and possibly GPS depending on cost and design. This device is small and inexpensive, and its main functions are running simple calculations and querying the OBD system.
In this framework, our cap-device uses cheap bluetooth networking to offload data, and the system works in the face of discontinuous network availability. The cap-device fulfills its basic duties of collecting sensor data, but offloads more expensive functions such as GPS readings and user interface to the phone. We leverage existing networks and available resources to keep the system simple, general, and modular, and the result is a framework flexible enough to run various data mining applications.
1.2
On-Board-Diagnostics
On-Board-Diagnostics (OBD) is a standardized system of data codes and communi-cation protocols for collecting data on different vehicular functions from the vehicle's computer systems and data-logging sensors.
Accessing a vehicle's functions via OBD can be done by sending requests through a 16-pin connector in the vehicle. A request is comprised of a mode specification and a "parameter identification number" (PID). The mode can be one of nine different modes, the two most common being current data mode (for data logging) and freeze-frame mode (for data on an error-causing state). The PID is a two-byte code that specifies what type of data to collect, for example vehicle speed, air flow, throttle position. The OBD standardization only extends to a certain set of PIDs, however,
and different manufacturers often have their own PID assignments for many other PIDs.
Figure 1-1 shows a byte-level OBD response returned by an OBD system data logs that we collected from a hybrid Prius.
7EA 03 41 GD 23 00 00 00 00 7E8 03 41 GD 23 00 00 00 00
Figure 1-1: Sample OBD protocol response that includes the OBD data from both the engine powertrain unit (7E8) and the hybrid engine unit (7EA) in a single OBD response. For each of the ECU responses, each byte after the ECU type identifies the following, respectively: number of bytes of data, mode (4 signifies a response, and 1 requests current data), PID, four bytes of space for data, and an unused byte. [5]
Most modern vehicles have On-Board-Diagnostics systems. Originally, these diag-nostic systems were designed and implemented by manufacturers themselves to test their vehicles for conformity to the Environmental Protection Agency (EPA) emission standards, and consequently, the signalling protocols and the codes specifying data varied greatly between vehicle brands. However, in the past few years, many com-ponents of the on-board-diagnostic systems have been greatly standardized: physical connectors and pin outputs, signalling protocols to and from the vehicle's OBD port, and messaging format of data requests and responses. In fact, all US vehicles built after 1996 are required to implement the OBD-II system, which specifies a set of the aforementioned standards, for monitoring emission control components. In 2005, the Environmental Protection Agency passed regulations requiring commercial ve-hicles of model year 2008 (and onwards) to support the OBD-compliant Controller Area Network (CAN) signalling protocol defined by ISO15756-4.3 [1], There are still many proprietary manufacturer codes, but the benefit of these standardizations is that many types of vehicle system data are now easily and publicly accessible.
1.3
Bluetooth
Our design uses a bluetooth connection to send data from a powered device in the vehicle to a smartphone, and we chose to use bluetooth because it requires little power and operates based on proximity.
Bluetooth is a communication protocol standard for connecting devices, specifi-cally those within close range. In the bluetooth protocol, devices can be connected as slaves or masters; a master initiates a connection by sending a paging request to the slave's address, and the slave responds to the request. Bluetooth was designed for short-range, limited-battery-powered devices, and it consumes on average 1-35mA, as opposed to Wi-Fi, which requires between 100-350mA.
In terms of adapting to noise, Bluetooth uses a fixed signal rate and several coding rates. It does suffer from interference when sharing bands with other RF devices; to cope with this, the Bluetooth protocol involves frequency hopping, to find unused frequency bands. [6].
1.4
Outline
Chapter 2 discusses the highlights of previous work done in the area of OBD data collection. Chapter 3 describes the design and the main components of the frame-work, as well as the authenticity issues related to deployment and the extensibility of the system. Chapter 4 details the implementation of the framework as well as the applications that we deployed on the framework. Chapter 5 analyzes the data col-lected by the applications and discusses the effectiveness of data collection methods on the framework, and we present our conclusions in Chapter 6. Chapter 7 suggests improvements and possible future directions for the framework.
Chapter 2
Related Work
Using OBD to collect data from a vehicle's internal sensors is by no means new. Manufacturers used built-in diagnostics tools to test their vehicles before the 1990 Clean Air Act Amendments mandated the OBD standard [2]. Commercially, de-vices are available for reading OBD data from vehicles, including hand-held dede-vices with displays that allow users to read Diagnostic Trouble Codes from their vehicles. ScanTool is another product that can be plugged into the OBD port of a vehicle and then connected to a laptop, at which point users can log or view values calculated from the car's OBD responses using open-source or commercial software.
Research groups using OBD data have often used commercial devices to collect readings; for example, a 2005 dynamic speedometer project used a commercial ScanT-ool device to collect real-time velocity of cars, which was then used in a redesigned version of the dashboard and speedometer [9].
Another project, VEDAS, implemented a distributed data stream mining system designed to monitor the health of fleets of vehicles for maintenance [8]. In the VEDAS project, PDA-like handheld devices with "appropriate middleware" were connected as "scantools" to the vechicle's OBD port to collect and stream data. One main goal of the project was to collect and analyze vehicle data while remaining within certain resource constraints. Specifically, the data mining system design focused heavily on optimizing data stream analysis and minimizing data storage and mining software footprint. A lot of attention was paid to local data clustering and filtering methods;
these allowed bandwidth to be saved by only sending "atypical" results. Alternatively, some data was simply analyzed on board the device.
The VEDAS project also used OBD data to profile human driving behavior, using speed and acceleration, for example, to detect possible drunk driving.
The CarTel project [4], as a distributed vehicular sensor network, was a major motivation for this project. The CarTel network consists of a fleet of vehicles that are equipped to collect GPS, OBD, WiFi, image and other sensor data. Queries for data collection are sent from a central location, and the individual nodes handle the heterogenous data and delivers it back through intermittently available networks. CarTel handles and collects a huge range and quantity of sensor data, and uses a variety of methods to send it back to the server.
Our project covers a much smaller scope than the CarTel project, but our goals are a different: we wanted a remote sensor system that is simple, low-cost, and easy to incorporate. This system is very much geared towards collecting vehicular data in an inexpensive and scalable manner. Lowering the cost and complexity of necessary equipment greatly lowers the barrier of entry and promoting adoption of the framework. As part of the project, we also have designed a query system that is simple and flexible, with the goal of making it possible to quickly create customized queries and data mining applications.
Chapter 3
Design
The three main components of the system are a cap-device (described in more detail in 3.3.3), a smartphone running a mid-client app, and the remote server. In general, requests for data flow in the direction of server to cap-device, and data flows in the opposite direction.
In a fully utilized system, the server component might be responsible for storing and/or analyzing the data for every vehicle, so in terms of scalability, it cannot operate on the level of individual OBD requests, sending each request through a smartphone to a cap-device. In our system, the components handle data at different granularity and communicates with their hierarchial neighbor component with different protocols. In the following sections, we describe the design goals, as well as each component in more detail.
3.1
Design Goals
In designing the framework for collecting OBD data, we aimed for a system that was low cost, extensible, and low maintenance. Our query framework for describing requests is also simple but extensible, and is narrowed down to provide support for the three most common types of data requests: requests for single pieces of data (checking a state), continuous requests (monitoring a value over time), and cumulative requests (such as mileage). Additionally, when the phone is present, the model supports
"tagging" of OBD/accelerometer data with location data requested from the phone. This allows framework to collect information-rich data using only simple requests.
3.2
Operational Overview
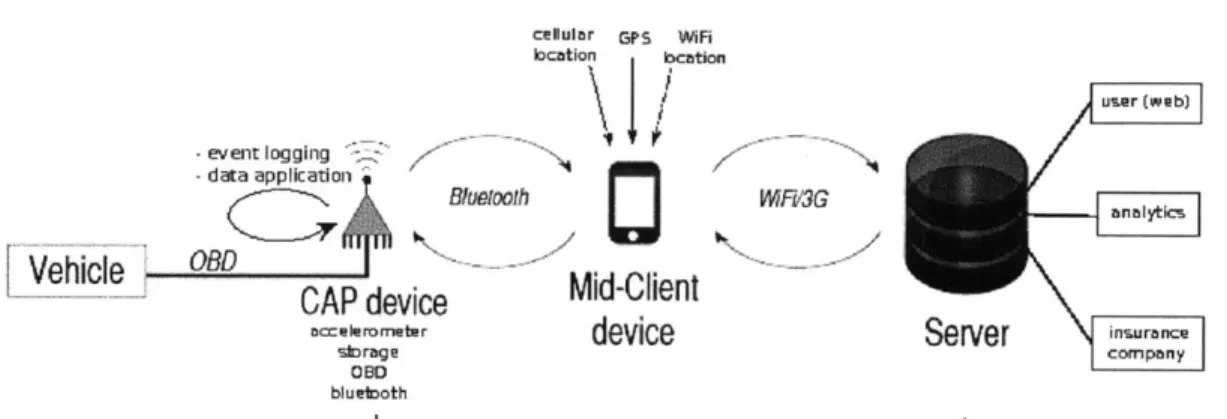
The following is an overview of a how the system works as a whole, and how the components interact with each other. The main components of the design and the communication links are shown in Figure 3-1.
cellular GPS WiFi location bcation user (web) event logging '-data application
j4Buoolh
MF3GVehicle
0-CAP device
Mid-Client
Cce|--
device
Server
in-nc-strage company
08D bluetooth
Query Layer
Figure 3-1: Overview of components in framework design, including available sensor data and communication links.
The server is the origin of remote sensor requests, in addition to running a variety of server-side processes. A server posts request-messages for phones running the "mid-client" application to pull. At the same time, it listens for incoming messages and handles the new data.
Before the first use, the user explicitly gives the cap-device permission to connect to the phone by pairing the phone with the cap-device over bluetooth. After that, the phone needs to have bluetooth enabled, but it need not be discoverable. It will be running the mid-client app, and optionally may have additional sensors, such as
GPS, enabled.
When powered up, such as during vehicle start-up, the cap-device starts up into autoconnect mode and attempts to make bluetooth connections to phones that have
initiate a handshake exchange to verify that it is indeed connected to a "mid-client" application, as opposed to a non-framework device.
After connection, the phone will poll the server for any message-requests that it needs to send, and it will send these to the cap-device over bluetooth. Otherwise, the phone waits for data from the cap-device, which it will store these locally in memory, periodically writing these out to file or sending them to the server.
Once the cap-device is connected, if it receives any message requests, it will send the necessary requests for OBD data to the appropriate application thread, also running on the cap-device. Each application thread handles a different type of data request (single, continuous, or cumulative data), and there may be several requests that an application thread needs to handle, depending on the type of vehicle process or collection interval that is specified. The application threads are responsible to continuously polling for OBD data, and they take turns sending the necessary OBD requests to the vehicle and receive responses.
Depending on the type of application, the thread may modify some local state or pass outgoing messages to the bluetooth thread, which will get sent to the phone. Outgoing messages can be OBD data that the phone has requested or requests to the phone for sensory data for "tagging" that the cap-device cannot collect locally but is available to the phone, such as GPS, WiFi location, or cellular location. In the case that the phone is not available, event logs will be written to file, and data will remain untagged.
If the phone disconnects from the cap-device, the cap-device re-enters the loop where it searches for a paired device to connect to.
3.3
Architecture
3.3.1
Remote Server
The server is the location where data is ultimately stored and then used by various services server-side. For example, the data can be processed by analytics services, or
made available to end users via a web interface, or used by an insurance company for gauging driving safety and then providing incentives for safe driving. The server is also the point of origin for data requests on the framework. Server implementation
can vary as long as it follows the communication protocols.
The server does not operate on the level of individual OBD requests, but rather at the level of describing what type of data is wanted. The protocol of outgoing packets is of the form <PID, mode, collection interval, action, request ID>. The mode refers to one of the three data collection modes of single, continuous, and cumulative; collection interval is the time between collecting data points, which is relevant only for continuous or cumulative collection; an action command details an action to be taken, such as start or stop, for the continuous and cumulative modes; the unique ID is assigned by the server and used by the server to identify the response to a particular request. The data stored on the phone will be dumped to the server when the phone disconnects from the cap-device. Additionally, the packet can be extended to include auxilary phone sensor data that might be desired.
Incoming packets to the server are dumps of data, and the server stores and processes them.
At the moment, there is no capability for a server to target a specific vehicle with a message-request, but this feature could be added by linking the serial number of the OBD cap-device to the vehicle during installation, and using the serial number to uniquely identify the vehicle. Server request-messages would then include a serial number if they were meant for a particular vehicle, and the phone would also selec-tively poll the server for requests specific to the serial number it receives from its paired cap-device.
3.3.2
Smartphone
Since smartphone numbers have been rising dramatically over the past few years, and, according to some sources, are nearing 20% of cellphone sales [10], we decided that the increasing presence of smartphones makes them an appropriate device to use
network access to the cap-device. Another benefit of smartphones is that code and functionality updates are easier to send to smartphone applications, as opposed to the difficulty of deploying new code to a remote microcontroller device.
The smartphone connects to the server via the phone's data connection or through wifi hotspots. It pulls data-requests from the server that will be sent to OBD devices, and it sends data dumps to the server when the server requests it, or when it loses connection to the cap-device. The message sent to the server includes the request ID and vehicle ID in the packet so the server can identify the data.
For connecting to the cap-device, we use bluetooth for two reasons: 1) it is rela-tively low-power for a passive, listening device, and 2) the user will frequently be in close proximity to their vehicle (and the cap-device) during driving trips. Before the first use, the user needs to pair their smartphone to the cap-device, to establish the bluetooth key exchange.
The phone will be running a "mid-client" application in the background, which waits passively for a device to connect via bluetooth. Once it connects to a cap-device, active server requests will periodically be sent to the cap-device. The protocol for packets from phone to cap-device will include a PID, collection mode, the interval between data points, a command (if relevant), and the ID designated by the server for this request. Additionally, the phone will send period requests for the cumulative data points, because those will not automatically be sent by the device.
Data that is sent from the device to the phone is stored in memory, and periodically dumped to file, to be sent to the server on request or after an extended disconnect from the device.
3.3.3
Cap Device
The cap-device is a low-cost device that is small and unobtrusive, and can be plugged into a vehicle's OBD port. A prototype is currently being developed, and the relevant features include a microcontroller, and accelerometer, and a bluetooth antenna; GPS is also being considered, but as mentioned before, the cap-device may utilize the phone's GPS. The primary function of the cap-device is to send queries to the vehicle
OBD and do the minimal calculations required for collecting cumulative data. Since the device is still in development, we decided to use a simulation in place of an actual cap-device. This has the added benefits of simplifying testing and deploy-ment, and allows us to avoid prototyping on a microcontroller. Our substitute for an actual cap-device is a C-code simulation that runs on a laptop and has access to a low-level bluetooth device. The data for the simulation comes from a log of actual data that we collected using an off-the-shelf scantool.
The cap-device component does not have power constraints, because it is powered through pin in the OBD port. To this end, it takes the role of the bluetooth client and periodically attempts to connect to "mid-client" apps that have paired with it and are within bluetooth range.
The cap-device collects data that has been requested by the phone and either stores the result of a cumulative calculation or sends data back across the bluetooth connection to the phone. The response protocol consists of sending the PID, the server-assigned ID, a timestamp, and the data.
3.4
Security
Security in this data-collection framework is not fully implemented, but we feel it is important to point out possible security vulnerabilities, as well as provide at least partial solutions to these problems. Here we provide a list of security issues we believe are important and possible aproaches.
1. Unauthorized removal of cap-device If the framework is used in a setting that involves monitoring of a particular vehicle, such as in an insurance incentive program, it is important to be alerted if the device is removed and plugged into a different vehicle. One approach would be to send the Vehicle Identification Number (VIN) in messages and check server-side that the serial number of the cap-device sending the message is linked to the vehicle VIN in the messages. However, if the cap-device is actually plugged into a device that simulates the
some sort of unique (physical) characteristic of a vehicle for identification; for example, the pattern of vibrations detected by the cap-device accelerometer during ignition might provide a unique fingerprint of a vehicle.
2. Data authentication External sources may try to spoof data, so we need to verify that data is only originating from and being modified by framework components. First, this involves mutual authentication of components when they pair. This can be done through a software handshake, or by requiring the user to have physical access to the device on the first pairing, for example, entering a serial number visible on the cap-device into the mid-client app. Additionally, message authentication codes (MAC) should be used at each step where data is changed. Then server side, the chain of modifications can be verified as being made by trusted components. This also helps with message loss or corruption during transfer.
3. Data encryption Certain cases also exist where data is sensitive and needs to be transmitted with encryption. This data will likely not need to be pro-cessed by the phone, so end-to-end encryption will be used to protect the data in transmission. Should the data need to be tagged, the cap-device can re-quest additional sensor data from the phone, tag the relevant data, encrypt the packets, and then send them back to the phone to transmit back to the server.
In general, the two main areas of security that should be addressed are data privacy and integrity, and authenticity of identity. We have discussed a few possible areas that we think are necessary before commercial use, but these are by no means complete.
Chapter 4
Implementation
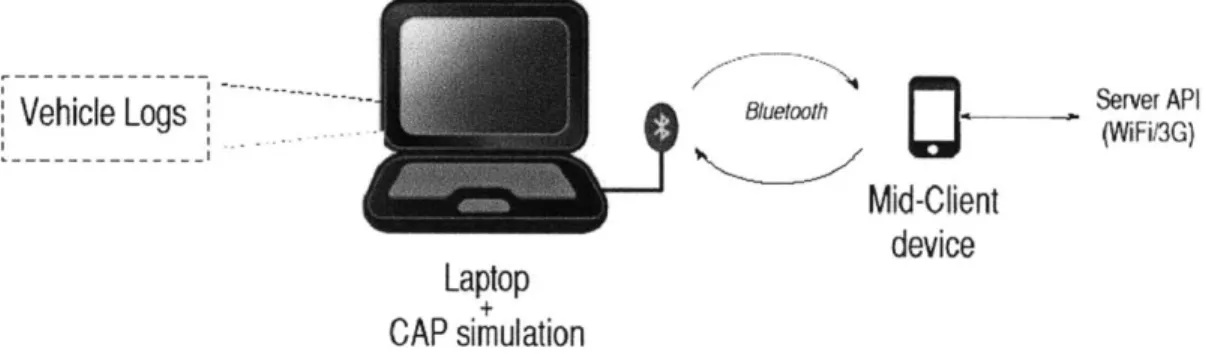
This chapter describes the prototype implementation of our design. In order to speed implementation of a prototype and make it more feasible, our implementation differs somewhat from the design. The prototype we implemented is shown in Figure 4-1.
Vehicle Logs
- Bluetooth , Server APIVeh l L(WiFiI3G)
Mid-Client
device
Laptop
CAP simulation
Figure 4-1: Overview of components in prototype implementation of design.
First of all, we broke the cap-device component down into a few parts. At the time of our implementation, the hardware of the cap-device was still in develpment, and existing versions of it were running legacy code for communicating with OBD that we plan to discontinue using. Instead of testing and deploying cap-device code on the microcontroller of an alpha prototype, we developed cap-device code on a Linux laptop. To simplify the testing further, we collected OBD trace data from several runs in a vehicle and used those traces to drive our testing. In conjunction with a USB bluetooth device, this makes up the cap-device component of our design.
We also implemented a message API between the mid-client and server. In our implementation, we use the smartphone as both the mid-client device as well as a simple server component. This means the smartphone generates the requests for data and handles the endpoint for cap-device data, in addition to communicating with the cap-device component via bluetooth.
In the following sections, we describe our implementation, beginning with the data end of the system.
4.1
Pre-Collected Data
To drive our testing, we collected data beforehand from a vehicle and then used the logged data while running the framework. We used a commercial ScanTool device and OBDWiz software to collect OBD data; the vehicle driven was a Prius. Our data consists of OBD data logs collected while driving in the area around Cambridge, Massachusetts, near MIT. We collected PID 13, velocity, and our sampling rate was several times a second. The data collected was in the OBD format of raw bytes, as previously shown in Figure 1-1, and includes the byte readings from both the engine control units (ECU), hybrid and powertrain.
Before running the data collection framework, we preprocessed the log into a linked list in memory. This linked list was passed to a query thread, which acts as an OBD system black box, returning data when it is requested in real time via an OBD query API. This makes it easy to replace the query thread at some point in the future with an actual thread that queries for and receives OBD data in real time from a vehicle.
4.2
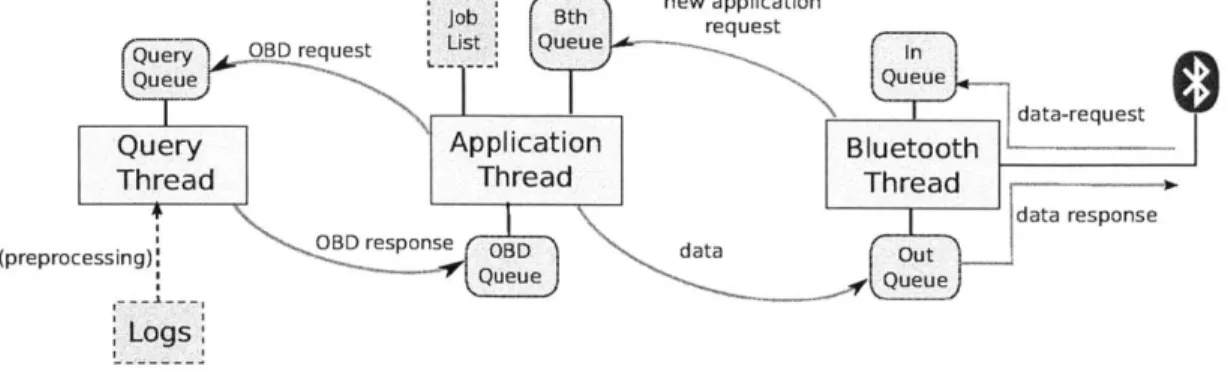
Cap-Device Code Structure
The code that handles the data collection and bluetooth sending of the data is writ-ten in C, and its functionality is broken up into three main modules: the query module, bluetooth module, and the applications module. As mentioned before, the
query thread acts as the black box for requests to the vehicular OBD system. The bluetooth module deals with reading input sent to the bluetooth device and writing out responses as well as data packets through the bluetooth device. The applications module deals with the three types of collection mode: single, continuous, and cumu-lative. Fig 4-2 shows the interactions between the code modules on the cap-device.
new application request
qu data-request
Query Application Bluetooth
Thread Thread Thread
OBD response OBD response (preprocessing) Queu
Logs
Figure 4-2: Code structure of cap-device, detailing data flow for different types of data requests.
4.2.1
Query Thread
The query thread acts as a vehicular OBD system, and has a lock-protected, single-item queue from which it processes requests added by applications module threads, as well as a lock-protected single item response queue. Requests sent to the query thread include a PID and a conditional variable for awakening the requesting thread when a response becomes available. A response contains a timestamp and between one and four one-byte data values.
The query thread starts by pre-processing the logged data from xml form into a linked list of OBD entries. Each entry contains the following data: PID, timestamp, OBD data string.
The goal of the query thread is to stand in for an actual OBD device, so we try to return data that realistically corresponds to real request time, as observed by the app threads that are making requests. To do this, the query thread takes a reading of system time every time it receives a request and calculates the difference in time,
linked list of preprocessed OBD data to the next entry with a timestamp that is at least d after the last entry it returned. The query then responds to the requesting thread with that OBD data entry and advances its data linked list by one.
Requests can be sent to the query thread by first locking the query thread's response queue, then locking the query thread's request queue. Then, the request is copied into the query request queue, and a flag is set to alert the query queue that an item needs to be processed. The requesting thread then conditionally waits on the query thread. When the query thread the query thread has "sent" the OBD request and "received" a response, it clears its alert flag and copies the OBD response into its response queue and wakes the waiting thread.
When the query thread reaches the end of its data, it signals the end of its data by returning -1 in the timestamp field of the response queue.
4.2.2
Bluetooth Thread
The bluetooth thread handles all communications through the bluetooth hardware. Other threads can send messages via the bluetooth thread by adding their message objects to the message queue of the bluetooth thread.
The cap-device is powered by a pin from the OBD port, so it starts up when the vehicle does. Once started, the bluetooth thread handles all bluetooth-related events, such as device pairing and connecting, incoming messages, and sending messages. It has two main states, unconnected and connected, with respect to a mid-client app.
Hardware
The specific bluetooth hardware we use is the Infineon eBMU BlueMoon PMB 8753/2 radio chip [7], which is compliant with standard Bluetooth 2.0. The device implements the Serial Port Profile (SPP) so it can be accessed as a serial port; its communication protocol is the AT command protocol.
The device we chose to use is is fairly standard and many chip components with the same specifications are available; this should make a port of the simulation code
to an actual prototype straightforward.
Functionality
The bluetooth hardware implements the AT command protocol, and after being pow-ered, the device requires some set-up. The initialization AT commands sent to the bluetooth device will reset the device, set up bluetooth PIN security, make the de-vice discoverable, register for the local serial port serde-vice, and set up auto-connect for connection requests. After the hardware is initialized and the cap-device is made bluetooth-discoverable, the bluetooth thread enters the unconnected loop. The thread breaks into the connected loop when it makes a connection with a device. If the blue-tooth device encounters an error state and sends back error messages, the cap-device code will reset the connection to the hardware and re-initialize it; it then enters into the unconnected loop.
In the unconnected loop, the cap-device waits for a phone to pair over bluetooth. If a bluetooth device tries to pair to the cap-device, the unconnected thread will accept the connection and then (optionally) initiate a handshake with the connecting device. The device is then connected to, as well as added to the "paired devices" list of the bluetooth thread.
If no devices pair, the cap-device will periodically pick a bluetooth address of a phone from its list of paired devices and broadcast a bluetooth request to connect to that bluetooth address.
Once a device is connected, the cap-device enters a connected loop during which it listens for messages from the phone and also sends out messages from the queue it shares with the application threads.
The cap-device expects and handles the following types of incoming messages in the connected state:
1. Incoming Request The format of incoming messages from the phone is a 14-byte string as depicted in Figure 4-3. The first three bytes are a header string "MSG". The rest of the bytes in order are a 1-byte collection type ("0"
for single, "1" for continuous, or "2" for cumulative), a 3-byte PID, a 3-byte server-assigned request ID, a 3-byte interval, and a 1-byte command (for the different commands in the continuous and cumulative types of collection). All the numerical values are represented as ASCII strings, as opposed to binary values.
MSG[3] type[1] PID[3] ID[3] interval[3] cmd[1]
Figure 4-3: Format of message protocol from phone to cap-device.
The message could certainly be compressed further in size by using a binary rep-resentation, but for simplicity of this implementation we used ASCII characters for each message component.
2. Pairing Request This request is handled the same way as in the unconnected loop; an optional handshake may occur, and the connecting device's bluetooth address is added to the "paired devices" list.
3. Disconnect The cap-device code will break out of the connected loop and re-enter the disconnected loop, where it will try to initiate connections to paired devices.
4. Error states The PMB 8753/2 bluetooth device will return "-1" through the serial port connection if it encounters an error. At that point, the cap-device will break out of the connected loop and jump to the re-initialization point near start-up.
4.2.3
Application Threads
The cap-device also runs three application threads, one for each data collection mode: single, continuous, and cumulative. Each thread has a lock-protected input message queue where it receives requests to process from the bluetooth thread.
then sleeps until it is woken by the query thread with an answer. The application thread then copies the response and unlocks the request and response queues.
The single-app thread is very simple and its only data structure is an incoming-message queue because the thread only has to collect PID data once for each request. The single-app loops in checking its queue for requests; if it finds a request in its request queue, it sends an OBD request for that PID to the query thread. When it receives a response, the single-app thread enqueues an outgoing message to the bluetooth thread's queue that includes the timestamp, the server-assigned ID, and the data bytes (up to four).
The continuous-app thread collects data for a PID at specified intervals, and it can receive two types of messages: a start request, to begin data collection for a PID, and a stop request, to discontinue data collection for a PID. Unlike the single-app, the continuous-app has to keep track of PIDs that it receives collect requests for. The data structures of the continuous-app are an incoming-message queue, a time counter for handling intervals, and a linked list of continuous-requests. A continuous-request item contains a PID, a server-assigned ID, a frequency interval, and a time stamp of the previous system time data had been requested.
The continuous-app checks its incoming queue at the beginning of each loop. For a start request, it checks its linked list for a duplicate of the requested PID. If the an entry with the same PID exists in the linked list, the entry gets overwritten; otherwise a new entry is added. For a stop request, the matching PID is removed from the linked list.
After checking its queue for new requests, the continuous-app thread traverses the linked list of continuing requests. A item is ready to have data collected if the difference between its previous collection time and the current system time (checked by calling time(NULL)) is greater than the interval specified by the request. If so, the thread updates the collection time of the item and sends a request to the query thread for the item's PID; when it receives a response, it enqueues a message to the bluetooth queue. Otherwise, the thread continues to the next request item.
continuous thread. However, it does not enqueue a response to the bluetooth thread's queue every time it receives an OBD data entry. Also, in addition to start and stop requests, the cumulative application also has a dump request, which requires the thread to respond with the value of the corresponding PID.
Like the continuous-app thread, the cumulative-app thread also starts off by check-ing its queue and addcheck-ing or removcheck-ing items to or from the requests linked list if necessary; the main difference is that the thread does not add a message to the blue-tooth thread's queue every time it sends an OBD query, but rather calculates a new cumulative value and stores that in the PID item's linked list item. The cumulative value calculation and the relevant data structure is presented in the code snippet in Figure 4.1. 1 struct list-item{ 2 int pid; 3 int intv; 4 int id; 5 double time-counter;
6 double cumu-val;
//
for cumulative only7 double data..time;
//
for cumulative only8 struct list-item* next;
9 };
10
11
//
Increments the cumulative value of a list-item by value* difftime12 int calc.cumu(int value, struct list-item* item, double time){ 13 item->cumu-val += value*(time - item- >data..time);
14 return 1; 15 }
Listing 4.1: The struct list-item is used to track active PIDs in cumulative collection, and stores the cumulative value of the PID data in cumuval. The function calc-cumu updates the cumulative value of a list-item.
where item.cumu-value is the item's current cumulative value, item.time.counter is the previous system time at collection; newvalue is the value just returned by the query thread, and time(NULL) is a call to get the current system time.
When a dump request is processed off the queue, the cumulative-app thread tra-verses the linked list to find the appropriate PID item and then adds a message to the bluetooth thread's queue. The message contain the server-assigned id, the timestamp
4.3
Smartphone "Mid-Client" Application
For the phone application, we used a Gi Android device running Android 1.6, with bluetooth capability in the hardware specifications. The original Android 1.6 SDK did not contain support for bluetooth, so we also used a backport of the Android bluetooth library.
4.3.1
Threads
The "Mid-Client" application has the job of sending requests to the cap-device as well as receiving data from the cap-device. The mid-client app has two main threads that correspond to the state of the device: an AcceptThread that waits for bluetooth con-nections, and a ConnectedThread that sends requests to a paired device and receives data. Since we want to conserve power for the user's phone, when unconnected, the phone does not try to run bluetooth device discovery to find the device and connect to it; it simply sits passively while waiting for a cap-device to connect to it. The whole process of connecting to a device is passive for the user's phone, except for the initial bluetooth pairing that the user initiates from the phone, which sets up the auto-connect capability on the cap-device side.
4.3.2
Operation
When the mid-client app starts up, it checks that bluetooth is available, requesting access to turn on the bluetooth if it is not on. Then it starts an AcceptThread, which simply loops while listening for connect requests from paired cap-devices.
When the phone receives a request, it accepts the connection and opens up an RF communication socket and subscribes to the serial port service of the cap-device. Then it spawns a ListenThread a SendThread to deal with the connection. Like the cap-device code, mid-client can optionally respond to a handshake interaction and
authenticate the connecting device.
ListenThread and SendThread to deal with a connection. In our implementation, the ListenThread receives the data messages that need to be sent to the server, and will periodically append them to a local file. The SendThread sends requests to the cap-device using the phone-cap-device protocol, using as the phone-cap-device protocol a message 14-bytes long that starts with a message header "MSG" (see Figure 4-3 for message structure).
The mid-client app continues to listen for incoming data; if the cap-device becomes disconnected from bluetooth, the RF communication socket closes and the Connect-edThread terminates, and the AcceptThread again waits for bluetooth connections.
Chapter 5
Evaluation
In this section, we evaluate our framework experimentally and characterize data in-tegrity under different sampling regimes and different data loss characteristics. For both of these points of evaluation, we use vehicle OBDdata collected from three traces of a Toyota Prius driving around the Cambridge are; a ScanTool device was connected to the OBD port to read data. The data was logged using OBDWiz software running on a laptop in the vehicle, and we received velocity measurements roughly 5 times per second.
Our goal in this evaluation is to assess the performace of this framework, but this can only be done in the context of a specific application, for which the accuracy of an estimate can be computed. For the purposes of this evaluation, we implemented a simple mileage counting application that works by integrating vehicle speed. We evaluate the accuracy of this estimate against the ground truth, from the odometer, across a set of different sampling regimes, and data loss profiling. While this is a very simple application, we believe that this evaluation methodology can apply equally well to other, more complex applications.
5.1
Data Logs
We collected speed traces for three different types of trips, all of duration 10 minutes, but varying in their velocity profiles. The first trip was through residential roads, which was characterized by low speeds (-25 mph), frequent stop signs, and areas of construction; during this trip, we traveled 2.3 miles. The second trip was on a state route, which was characterized by higher speeds (-50 mph) and stoplights; this trip covered 3.7 miles. The third trip was on an interstate highway, characterized by speeds of -70 mph, with no traffic lights, but included patches of construction; the distance traveled was 9.2 miles.
We used these three logs of speed data in our experimentation and analysis, and present the speed traces of the trips in Figure 5-1.
Vehicle Speed Trace per Trip
120
IResidential(2.3 mi) +
State Route (3.7 mi) x
100
-t
Interstate (9.2 ml)
E
-a80
60
40
20
0
0
100
200
300
400
500
Time elapsed (sec)
600
5.2
Framework Accuracy
First, we evaluate the accuracy of data collected through the framework. To do this, we compare data collected through the cumulative app of our framework to externally calculated or measured benchmarks. Specifically, we chose to collect mileage because it can easily be sanity-checked against an odometer reading and can also be simply calculated through velocity measurements. We chose to use data collected by the cumulative app because the functionality of the cumulative app is a superset of the other two methods, and its performance provides implications for the performance of the other two methods.
5.2.1
Methodology
For each trip log, we began by starting the mid-client app running on the phone and the cap-device code (reading from the logged data) on the laptop. Once the system was running, we sent a collection start command from the phone, requesting that the cap-device cumulatively collect PID 13 (velocity), at a frequency of 1/second. The cap-device began to make requests to the query thread and received responses in real-time until the query thread exhausted the available data for the trip (implementation described under "Query Thread" in 4.2.1). The units of the data collected through the OBD protocol are in km/h, and these measurements are kept track of cumulatively on the cap-device in units of km/hr*sec; we convert the final collected cumulative value to distance in miles. Our final value passes a sanity check when compared with the trip odometer reading we collected during data logging. We then compare our cumulative values to the Riemann sum of the data log using all collected points, which is the closest approximation to the actual mileage that we can attain.
5.2.2
Results and Analysis
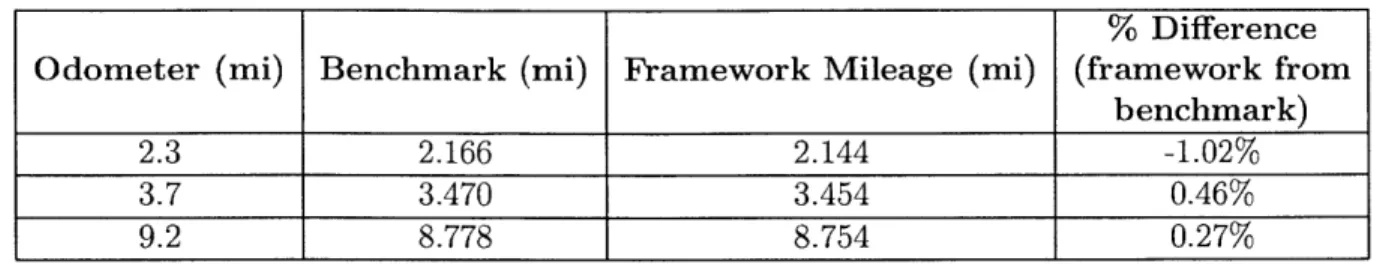
The results of the framework-collected data are presented in Table 5.1.
% Difference Odometer (mi) Benchmark (mi) Framework Mileage (mi) (framework from
benchmark)
2.3 2.166 2.144 -1.02%
3.7 3.470 3.454 0.46%
9.2 8.778 8.754 0.27%
Table 5.1: Cumulative mileage calculated by cap-device from periodically querying velocity readings during several trips. This value is compared to a cumulative calcu-lation over all available data points.
errors for a mileage calculation, demonstrating that our framework is fairly accurate for 1-second interval data collection under ideal conditions.
One thing to note is that these are relatively short traces that we processed in our framework, and actual data traces can easily be an order of magnitude longer, in both time and distance. This trial simply shows that data can be accurately collected for short trips, which we believe can be extrapolated to longer trips, as long as the error is evenly distributed.
5.3
Non-Ideal Data Collection
Our second evaluation point is to characterize data as it might be collected through the framework under non-ideal conditions. In realistic conditions of data collection, data may be lost in transmission from cap-device to phone, or the phone may not even be available to offload data. In order to form an idea of how well the collected data reflects the actual process being measured, we simulated continuous data collection under the three types of non-ideal situations that we considered most probable:
1. Lossy Data Transmission For lossy data, we ignore possible packet loss that might occur between phone and server; data is passed through WiFi or 3G for that connection, and we may rely on the TCP/IP protocol. Data communi-cation between the cap-device and the phone is sent over bluetooth; while the bluetooth protocol also implements reliability measures, such as error correction
Figure 5-2 demonstrates collection with random drops.
Figure 5-2: Example of lossy collection, where packets are randomly dropped with uniform probability. The black lines represent successfully transmitted packets, the gray lines represent lost packets.
2. Cap-Device to Phone Connection The bluetooth connection between phone and cap-device is over RF, and may be disconnected due to interference over the channel. Additionally, in the case of error, the cap-device code will restart, temporarily disconnecting it from other devices until it reconnects. This will result in a brief ga in the data, which can be handled either by dropping the gap completely and underestimating results, or by accounting for the gap by making the assumption that the average is estimated using the last measured value. Figure 5-3 demonstrates discontinuous collection.
Figure 5-3: Example of discontinuous collection, where the connection may be broken for periods of time, and all packets during disconnects are lost. The black lines repre-sent successfully transmitted packets, the gray areas represnet disconnected regions.
3. Long periods of Non-Connectivity One possible use case we wanted to con-sider is the situation where a device lacks phone connectivity for long periods of time (on the scale of months). In this case, the cap-device does not have an upload link, and may need to conserve storage space by decreasing measurement frequency. Although we do not have this sort of dynamic scaling-back imple-mented, code running on the cap-device could begin to decrease measurement
frequency the longer the device lacks phone connectivity. Figure 5-4 demon-strates downsampled collection.
Figure 5-4: Example of downsampled collection, where the frequency of packet trans-missions is decreased; no packets are dropped. The black lines represent successfully transmitted packets.
We again used velocity data in characterizing non-ideal circumstances, but this time we were interested in the continuous collection case, because non-ideal conditions will have the most observable effect on these results. Our goal is to characterize how noisy collection affects the collected results and in order to assess the maximum amount of disruption that would be tolerable. Since all three of our data traces have a duration of 10 minutes, we will compare the different conditions by dropping equal amounts of data, e.g., some percentage of the samples will be dropped. This way, we will be able to observe the normalized effect of different packet loss conditions.
5.3.1
Methodology and Results
Characterizing data collected under a wide range of non-ideal circumstances would be infeasible to run on our framework in real-time, and since we were mainly interested in characterizing endpoint data anyways, we simulated the non-ideal conditions. Using Python scripts, we sampled directly from the each of the logs and applied filtering that would simulate our various models of non-ideal data collection. Additionally, we decided to use 10% as our "acceptable" level of error.
Lossy Data Transmission
packets were randomly distributed, we ran the simulation four times for each drop probability trial to mitigate randomized skewing of the data.
We are specifically interested in how drop probability affects the accuracy of the successfully transmitted data, to the end of characterizing a maximum drop proba-bility that should be tolerated for a trip. For each run of each trip, we calculated the absolute value of percent difference of the cumulative value from the benchmark value. We present this data in Figure 5-5, with the standard deviations of percent
differences for each trial.
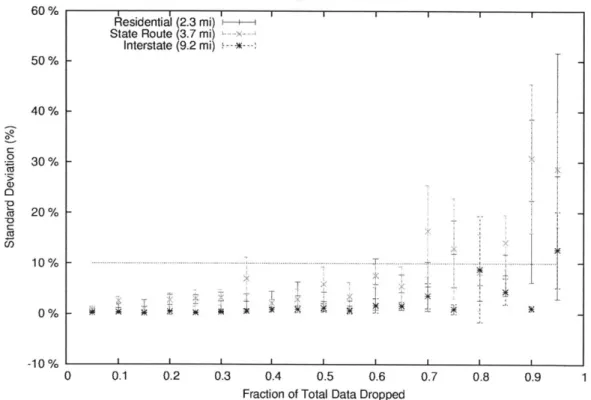
60% 70 70 C (U 50% 40% 30% 20% 10%F 0% - I U 70
Lossy Collection: Mileage % Difference from Benchmark Residential (2.3 mi) I
State Route (3.7 mi) x
Interstate (9.2 mi)
TT
-. -- I -- -0 0.1 0.2 0.3 0.4 0.5 0.6Fraction of Total Data Dropped
0.7 0.8 0.9 1
Figure 5-5: Mean and standard deviation of the absolute value of percent differences of cumulative speed from benchmark, for three types of trips. Plots fraction of data dropped against absolute value of percentage difference.
We can clearly see the general trend of increasing error and increasing standard deviation of error as drop probabilities increase, which is expected. Data collected during interstate travel appears to remain fairly accurate despite large fractions of data dropped, which may be due to the relatively constant speeds during such travel.
The wider spread of percentage differences in residential and state route travel can be attributed to large variations in speed due to stopping, but the cumulative values remain within 10% of the benchmark value until we reach 60% or 70% loss of total data. Past this point of data loss, the standard deviation increases significantly, indicating data loss past this rate yields much less precise and reliable data.
5.3.2
Discontinuous Connection
Our second common case of non-ideal data collection is an inconsistent cap-device to phone connection, leading to dropped chunks of data due to restarts and dis-connections. We simulate these temporarily dropped connections by dropping all measurements in randomly selected 30-second blocks.
For each trial, we chose a total percentage of the 10-minute trip to be "discon-nected," ranging from 5% to 95%. Then, from the range of data points to be col-lected, we randomly selected the necessary number of 30-second blocks to drop. We accounted for the dropped regions in the cumulative calculation by approximating the speed during the dropped regions as as the last speed reading before a disconnect. For each "disconnect" percentage, we ran the simulation four times, again to spread out the effects of the specific traces on the randomly sampled results, and took the average and standard deviation of the results.
Since our interest lies in the accuracy and precision change as collection condi-tions worsen, we again took the cumulative value and calculated the absolute value of its percent difference from the benchmark value for each trial. We present the average percent difference for each "disconnect" percentage with standard deviations in Figure 5-6.
Again, we are looking to estimate a maximum tolerable omount of interruption. From the data, we can see that for state route driving, loss of contiguous speed data points impacts the percent difference of the cumulative value greater than it does for the other two types of trips, which we attribute to driving patterns involving stoplights and longer periods of the vehicle remaining stationary. Interstate and residential
Discontinuous Collection: Mileage % Difference from Benchmark
90% - r- I II1 -
-Residential (2.3 mi)
1----State Route (3.7 mi)80 % Interstate (9.2 mi) --70% 60% -40% 40% 5 -2 30% 20%TI 0% 1' -10% I 0 0.1 0.2 0.3 0.4 0.5 0.6 0.7 0.8 0.9 1
Fraction of Total Data Dropped
Figure 5-6: Standard deviation of the absolute value of percent differences of cumu-lative speed from benchmark, across three types of trips. Plots total fraction of data dropped against absolute value of percent difference, for three trip types.
driving patterns are not as affected by randomly dropped blocks until higher fractions of total data loss. However, to maintain high levels of accuracy (within 10%), only low percentages of total contiguous data drops should be tolerated.
5.3.3
Lack of Connectivity
To simulate data collection during long periods of no connectivity, during which the cap-device might dynamically drop the polling rate to conserve storage, we sampled from the data of a trip at a set interval for each trial, from 5 seconds to 95 seconds, increasing by 1 second for each trial. Data loss fraction is calculated as data lost compared to 5-second interval collection, and corresponded to a range of total loss in data up to 95%. We present the absolute percent differences in Figure 5-7.
Downsampled Collection: Mileage % Difference from Benchmark
50%
ToResidential
(2.3 mi) + xState Route (3.7 mi) x
45% - Interstate (9.2 mi) x x 40% - 35%-x 30% -x x +xx ++ 25% -'N+ + + 4 20% 15% -xxo+ 1 0 % . . ... ...---.---.---.---+.-. A 5% -A 4 ( 0%A I )K 0 0.1 0.2 0.3 0.4 0.5 0.6 0.7 0.8 0.9 1
Fraction of Total Data Dropped
Figure 5-7: The absolute percent differences of cumulative speed from benchmark, across three types of trips when with decreasing sampling rate. Plots total fraction of data loss against absolute percent difference for three trips.
percent error stays low (less than 10%) for all three types of routes until about 60% or 70% of total data loss, which corresponds to an interval of -15 seconds between collections. The high errors in both the residential driving and state route trips are likely due to the frequent variation in speed, as well as their shorter trip length (2.3 and 3.7 miles respectively, as opposed to 9.2 miles for the interstate trip), causing errors to have a larger impact on percentage error. However, even if trip length increased, it is unlikely that the interval between collections could be increased very much, as evidenced by the high error rates in discontinuous collection, when 30-second intervals of data were dropped.