[15:23 12/5/2011 Bioinformatics-btr163.tex] Page: 1573 1573–1574
BIOINFORMATICS
APPLICATIONS NOTE
Vol. 27 no. 11 2011, pages 1573–1574doi:10.1093/bioinformatics/btr163Structural bioinformatics
Advance Access publication April 5, 2011CMView: Interactive contact map visualization and analysis
Corinna Vehlow
1, Henning Stehr
2, Matthias Winkelmann
2, José M. Duarte
3,
Lars Petzold
2, Juliane Dinse
1and Michael Lappe
2,∗1Department of Simulations and Graphics, O.v.G. University Magdeburg,2Max Planck Insitute for Molecular
Genetics, Ihnestr. 63-73, 14195 Berlin, Germany and3Laboratory of Biomolecular Research, Paul Scherrer Institut, 5232 Villigen PSI, Switzerland
Associate Editor: Anna Tramontano
ABSTRACT
Summary: Contact maps are a valuable visualization tool in
structural biology. They are a convenient way to display proteins in two dimensions and to quickly identify structural features such as domain architecture, secondary structure and contact clusters. We developed a tool called CMView which integrates rich contact map analysis with 3D visualization using PyMol. Our tool provides functions for contact map calculation from structure, basic editing, visualization in contact map and 3D space and structural comparison with different built-in alignment methods. A unique feature is the interactive refinement of structural alignments based on user selected substructures.
Availability: CMView is freely available for Linux, Windows and MacOS. The software and a comprehensive manual can be downloaded from http://www.bioinformatics.org/cmview/. The source code is licensed under the GNU General Public License.
Contact: [email protected], [email protected]
Received on December 22, 2010; revised on March 2, 2011; accepted on March 27, 2011
1 INTRODUCTION
The tertiary structure of a protein is determined by non-covalent residue interactions. An all-atom distance map is a lossless representation of the 3D coordinates (save chirality). Distance data can be further reduced to a binary residue contact map while still allowing complete reconstructions within 2Å RMSD (Duarte et al., 2010). The native fold is retained in reconstructions using sparse subsets comprising as low as 10% of native contacts (Sathyapriya
et al., 2009). Contact maps are a convenient way to highlight
structural features like domain architecture, secondary structure and contact clusters and they display unique information about the sequence separation of contacting residues which is not easily visible in 3D representations. The study of contact maps has been a valuable source of insight in experimental and computational protein structure analysis. They have for example been used to measure the dissimilarity of structures (Caprara et al., 2004), to analyze protein–protein interaction patterns (de Melo et al., 2007) and to study protein folding (Vendruscolo and Domany, 2000). Here we present a tool which combines the strengths of contact map and 3D visualization for protein analysis.
∗To whom correspondence should be addressed.
CMView implements several new features while seamlessly
combining the functionality of different contact map visualization programs already developed. Among those, Structer+Dotter (Sonnhammer and Wooton, 1998) contains modules for the generation (Structer) and simple visualization (Dotter) of distance maps and contact maps from PDB files. SeqX (Biro and Fordos, 2005) integrates frequency counts of residue combinations. With
Protmap2D (Pietal et al., 2007) and Con-StructMap (Chung et al.,
2007) contact maps of two conformations can be compared side-by-side. Con-Struct Map also allows to compare non-sequence-identical proteins by loading an alignment from a file.
2 CMVIEW FEATURES
CMView is a stand-alone Java application for interactive
visualization, analysis and manipulation of protein contact maps. It integrates protein analysis in contact map and 3D space via an interface to the molecular viewer PyMol (DeLano, 2002). CMView is open source software licensed under the GNU General Public License (GPL). It is available for Mac OS X, Linux, Windows and other platforms supporting Java 6.
Contact information can be read from various sources and file formats (PDB, CASP TS, CASP RR, native CSV) either from local files or directly from the PDB website. The contact definition can be specified in terms of contact type (all-atom, C-α, C-β) and contact threshold (distance cutoff in Å). The main application window (Fig. 1, right) shows the contact map and the various menu options for editing and analysis. If 3D coordinates are provided, the structure will be shown in a separate PyMol window (Fig. 1, left), making the full set of advanced visualization features of PyMol available. Any selection of (several) contacts can be exported as a corresponding PyMOL selection. In addition, the two views are intimately linked: the current residue pair underneath the crosshair in the 2D map is continuously displayed as an edge annotated with the euclidian distance in the 3D scene. The distance map, contact density and triangle inequality relations (here called common neighborhoods) are available as colored overlays in the contact map window.
2.1 Selecting, editing and export
CMView offers various functions to manipulate the contact map.
Contacts can be selected individually or by using rectangle select, fill select, diagonal select and neighbor select tools that resemble similar functions known from graphics applications. Entire sets of contacts can be deleted or highlighted in different colors and exported to the
[15:23 12/5/2011 Bioinformatics-btr163.tex] Page: 1574 1573–1574
C.Vehlow et al.
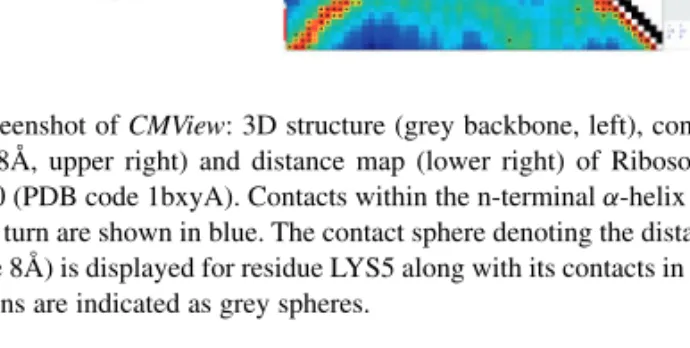
Fig. 1. Screenshot of CMView: 3D structure (grey backbone, left), contact
map (C-α 8Å, upper right) and distance map (lower right) of Ribosomal Protein L30 (PDB code 1bxyA). Contacts within the n-terminalα-helix and subsequent turn are shown in blue. The contact sphere denoting the distance cutoff (here 8Å) is displayed for residue LYS5 along with its contacts in red. C-α positions are indicated as grey spheres.
3D structure. The option to toggle individual contacts gives full user control in editing the map.
As an additional feature, CMView implements the Cone-Peeling Algorithm (Sathyapriya et al., 2009), which computes a fast approximation of an essential subset of contacts sufficient to maintain the native fold when reconstructing the 3D structure using distance geometry. Export options include text files in CASP RR or native CSV format for further processing. The map visualization, including highlighted contacts, can be exported as a PNG image.
2.2 Pairwise comparison
A key feature of CMView is the pairwise structural comparison of two proteins or conformations. For this purpose, a second structure can be loaded and aligned via one of the following methods: Needleman-Wunsch sequence alignment (Moustafa, 2007), SADP contact-based structural alignment (Jain and Lappe, 2007) or Dali structural alignment (Holm and Sander, 1995). The comparison view allows quick identification of shared and unique contacts. Common contacts are shown in black and contacts that are unique to one structure are shown in pink (for the first structure, e.g. a predicted structure) and green (for the second structure, e.g. the native structure). The two structures are also superimposed in the PyMol window, doing a best fit on the residues that are in contact in both structures. The 3D alignment can be interactively refined by selecting contacts and recalculating the superposition based on this subset. This feature allows the comparison of different alignments based on shared substructures in cases where a global rigid-body alignment is not optimal. To our knowledge, CMView is the only application that allows such an alignment of substructures in an interactive fashion.
3 CONCLUSION
CMView combines the strengths of rich contact map analysis with traditional 3D visualization in a single application. As a tool for contact map generation, modification and analysis it is the most
feature complete application to date. Special emphasis has been put on integrating tools for the analysis of secondary structure interaction patterns and for the pairwise comparison of structural models or related proteins. In particular, structural alignments can be interactively refined based on different subsets of shared contacts. The real-time link of the current position in the 2D contact map with highlighting the corresponding residue pair in the structure provides a combined ’2D/3D-cursor’. This offers a more intuitive approach to explore the relationships between contact patterns and protein structure. These unique features make CMView a valuable tool for structural analysis, protein modeling, assessment of structure predictions and education in structural biology.
4 FUTURE DIRECTIONS
Future work will include full integration of a reconstruction engine to transform modified contact maps back into 3D structures. This will allow CMView to be used as an interactive, contact-based protein modeling tool. An experimental command line tool called ’reconstruct’ which allows such 3D reconstructions via an interface to a distance geometry package is already available for download from the CMView website. Preview snapshots of future versions will be available from the authors upon request.
ACKNOWLEDGEMENTS
We thank Brijnesh J. Jain, Dan M. Bolser and Ioannis Filippis for helpful comments and suggestions.
Funding: Max Planck Society. Conflict of Interest: none declared.
REFERENCES
Biro,J.C. and Fordos,G. (2005) Seqx: a tool to detect, analyze and visualize residue co-locations in protein and nucleic acid structures. BMC Bioinformatics, 6, 170. Caprara,A. et al. (2004) 1001 optimal PDB structure alignments: integer programming
methods for finding the maximum contact map overlap. J. Comput. Biol., 11, 27–52. Chung,J.L. et al. (2007) Con-struct map: a comparative contact map analysis tool.
Bioinformatics, 23, 2491–2492.
DeLano,W. (2002) The PyMOL Molecular Graphics System. Available at http://pymol.sourceforge.net/.
de Melo,R. et al. (2007) Finding protein-protein interaction patterns by contact map matching. Genet. Mol. Res., 6, 946–963.
Duarte,J.M. et al. (2010) Optimal contact definition for reconstruction of contact maps. BMC Bioinformatics, 11, 283–283.
Holm,L. and Sander,C. (1995) Dali: a network tool for protein structure comparison. Trends Biochem. Sci., 20, 478–480.
Jain,B.J. and Lappe,M. (2007) Joining Softassign and Dynamic Programming for the Contact Map Overlap Problem, vol. 4414 of Lecture Notes in Computer Science, Springer Berlin / Heidelberg, pp. 410–423.
Moustafa,A. (2007) Jaligner: Open source java implementation of Smith-Waterman. Availabe at http://jaligner.sourceforge.net.
Pietal,M.J. et al. (2007) Protmap2d: visualization, comparison and analysis of 2d maps of protein structure. Bioinformatics, 23, 1429–1430.
Sathyapriya,R. et al. (2009) Defining an essence of structure determining residue contacts in proteins. PLoS Comput. Biol., 5, e1000584.
Sonnhammer,E.L.L. and Wooton,J.C. (1998) Dynamic contact maps of protein structures. J. Mol. Graph. Model., 16, 1–5.
Vendruscolo,M. and Domany,E. (2000) Protein folding using contact maps. Vitam Horm,
58, 171–212.