Publisher’s version / Version de l'éditeur:
Applied Acoustics, 63, August 8, pp. 867-883, 2002-08-01
READ THESE TERMS AND CONDITIONS CAREFULLY BEFORE USING THIS WEBSITE.
https://nrc-publications.canada.ca/eng/copyright
Vous avez des questions? Nous pouvons vous aider. Pour communiquer directement avec un auteur, consultez la
première page de la revue dans laquelle son article a été publié afin de trouver ses coordonnées. Si vous n’arrivez pas à les repérer, communiquez avec nous à [email protected].
Questions? Contact the NRC Publications Archive team at
[email protected]. If you wish to email the authors directly, please see the first page of the publication for their contact information.
NRC Publications Archive
Archives des publications du CNRC
This publication could be one of several versions: author’s original, accepted manuscript or the publisher’s version. / La version de cette publication peut être l’une des suivantes : la version prépublication de l’auteur, la version acceptée du manuscrit ou la version de l’éditeur.
For the publisher’s version, please access the DOI link below./ Pour consulter la version de l’éditeur, utilisez le lien DOI ci-dessous.
https://doi.org/10.1016/S0003-682X(02)00003-8
Access and use of this website and the material on it are subject to the Terms and Conditions set forth at
Prediction of the speech intelligibility index behind a single screen in
an open-plan office
Wang, C.; Bradley, J. S.
https://publications-cnrc.canada.ca/fra/droits
L’accès à ce site Web et l’utilisation de son contenu sont assujettis aux conditions présentées dans le site LISEZ CES CONDITIONS ATTENTIVEMENT AVANT D’UTILISER CE SITE WEB.
NRC Publications Record / Notice d'Archives des publications de CNRC: https://nrc-publications.canada.ca/eng/view/object/?id=38fa9d43-a264-4c37-9c0d-7286e577d7a7 https://publications-cnrc.canada.ca/fra/voir/objet/?id=38fa9d43-a264-4c37-9c0d-7286e577d7a7
Prediction of the speech intelligibility index behind a single screen in an open-plan office
Wang, C.; Bradley, J.S.
NRCC-44286
A version of this document is published in / Une version de ce document se trouve dans
Applied Acoustics, v. 63, no. 8, August 2002, pp. 867-883 www.nrc.ca/irc/ircpubs
Prediction of the Speech Intelligibility Index behind a
Single Screen in an Open-plan Office
C. Wang* and J. S. Bradley
Institute for Research in Construction, National Research Council, Montreal Road, Ottawa, Canada
Abstract
Improved acoustical privacy is the principal goal of the acoustical design of open plan offices. As the replacement of the Articulation Index (AI), the Speech Intelligibility Index (SII) can be used as a single-number measure of the speech privacy in open-plan offices. In this paper, a mathematical model of the speech propagation over single screens in a large open-plan office space is presented. The calculated effects of the office parameters, such as the screen height, ceiling and floor absorption, etc. on the SII behind the screen are discussed and are compared with measured results. To facilitate the practical use of the model, an empirical correction is derived from a wide range of ceiling tiles to provide values of the effective sound absorption of typical suspended ceilings in open offices. Compared to measured results, SII can be predicted with an RMS error of 0.03.
* now at General Motors, Proving Grounds, Mail Code: 483-394-201, Milford, MI48380, USA.
1. Introduction
In open offices, thermal, luminous, and acoustic environments are the three key elements that can affect occupant satisfaction. It is normally assumed that a good acoustic environment requires adequate speech privacy between adjacent workstations. Speech privacy depends on the speech source level or speech effort of the talker, the attenuation of speech sounds between the talker and the listener, and on the level of ambient noise at the listener[1].
The Articulation Index (AI), described in ANSI S3.5-1969[2], has been widely used as a single-number rating of speech intelligibility and speech privacy. Subjective experiments have suggested that as far as the listener is concerned, confidential privacy corresponds to an AI value of 0.05 or less[1], and acceptable privacy to an AI value of up to 0.15[3]. In order to provide general guidelines for office design, previous work has used AI measurements to investigate conditions in open plan offices[2-5], and has investigated the influence of factors such as: masking noise, speech effort, screens, speaker orientation, and ceiling absorption, etc on speech privacy[5-8]. However, since most of these results were based on experimental case studies, they are still difficult to apply in practice due to a lack of generality. There has long been a need to establish a general mathematical relationship between the privacy criteria and the acoustic variables of offices to make possible quantitatively accurate acoustical designs.
Recently, however, ‘due to new data which have been accumulated since 1969 for
various parameters and procedures used in the calculations’[9], AI has been replaced by the Speech Intelligibility Index (SII), as described in ANSI S3.5-1997[9]. Although a single-number rating similar to AI, SII is different, and SII values can be expected to be a little different than AI values. Thus, there is some uncertainty as to how the speech privacy criteria in terms of AI values can be translated to SII values. A mathematical model, which could directly relate SII values to office variables is an important first step to designing open plan offices for improved speech privacy.
In conventional open plan offices, workstations made up of partial height enclosures are intended to provide a measure of speech privacy. However, for each pair of talker and listener (the source and the receiver), the partial height screen between them is the most important acoustic element of the workstation for attenuating unwanted speech sounds. Although side panels may affect the speech propagation between the source and the
receiver, it has been found that when these panels are sound absorptive, speech propagation only depends on the dividing screen[10]. For a single screen in an office where the ceiling and the floor exist, the authors have developed an analytical model in which the effects of ceiling and floor reflections, screen absorption, and wave interference are incorporated[11]. As a result, the speech attenuation between the source and the receiver can be theoretically estimated for given source/receiver/screen configurations, if the sound absorbing properties of the ceiling, floor, and screen are known.
In this paper, this model is used to pursue a more extensive analysis of speech privacy in terms of SII values. The prediction of speech intelligibility index values for positions behind a single screen is discussed. The influences of the office parameters, such as the screen height, ceiling and floor absorption, etc. on the SII values are investigated theoretically. To facilitate the practical use of the model, an empirical correction is derived, from a wide range of ceiling tiles, to provide values of the effective sound absorption of typical suspended ceilings in open offices. Calculated SII values are compared with measured values for a range of realistic conditions.
2. Calculation of SII
The speech intelligibility index (SII) is a physical measure for evaluating the intelligibility of speech under a variety of combinations of speech and noise levels. It has a numerical value with a maximum of 1.0, signifying that all speech cues reach the listener, and a minimum of 0.0, signifying that no speech cues are available to the listener. In open-plan offices, the SII value is a useful single-number rating of the expected speech privacy experienced by the listener. Obviously, lower SII values indicate greater speech privacy. The detailed SII computational procedures are described in ANSI S3.5-1997[9]. The input variables required for SII calculations include the equivalent speech spectrum level, the equivalent noise spectrum level, and the equivalent hearing threshold level. However, for the purpose of objective evaluation for open-plan offices, only the equivalent speech spectrum level and the equivalent noise spectrum level need to be determined.
According to ANSI S3.5-1997, the equivalent speech spectrum level is the sound pressure level of speech received at the point of the listener’s head. The ANSI S3.5-1997
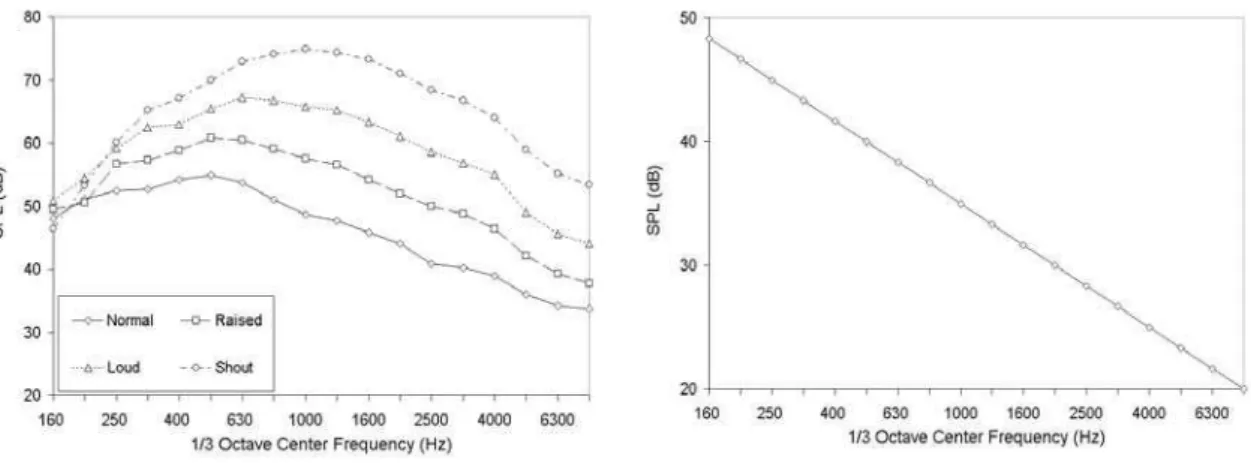
standard also includes standard speech source spectra measured at the point one meter from the talker’s lips. Figure 1 shows the 1/3-octave band standard speech spectrum levels for four degrees of vocal effort: normal, raised, loud, and shouted speech. Of course, the equivalent speech spectrum at the receiver depends not only on the standard speech spectrum level at the source, but it also very much depends on the speech attenuation between the talker and the listener.
Figure 2. RC40 noise spectrum. Figure 1. 1/3 octave band standard speech
spectra suggested in the ANSI S3.5-1997 standard
The equivalent noise spectrum level is the sound pressure level of ambient noise at the point of the listener’s head. Unlike standard speech spectrum levels, there is no specified noise spectrum level in ANSI S3.5-1997 because the ambient noise level in an office varies depending on the ventilation or air conditioning system, office equipment, and possible electronic masking sound, etc. In this study, an ambient noise equal to an RC40 spectrum shown in Figure 2 is used to represent typical conditions in offices.
Apart from these two input variables, a number of factors that contribute to speech intelligibility, such as band importance, speech level distortion factor, etc. are considered in SII calculations[9]. Applied as weighting factors, they are all associated with the nature of the response of the human hearing system. A common feature can be found in these factors that the frequency range between 500 Hz and 5000 Hz is most important for speech intelligibility[9]. Thus, SII is a weighted speech-to-noise ratio.
3. Speech Propagation Model
The discussion in Section 2 indicates that to be able to predict the SII, an analytical model for the speech propagation between the source and the receiver over a single screen is required so as to obtain the equivalent speech spectrum level at the receiver. For a single screen in an office space, the speech may reach the receiver via two possible mechanisms, diffraction and reflection over the screen, as discussed in [11, 12, and 13]. In [11], a general expression for calculating the insertion loss of a single screen in a flat room was developed based on the image source method. The sound reflections due to the floor and the ceiling, and the interference between the sound waves were successfully incorporated into the model. However, it should be noted that this model is not particularly convenient to employ because it requires acoustic impedance data for the ceiling tiles and the floor as inputs to make possible the inclusion of interference effects. Since the interference effects are usually most significant at lower frequencies where the speech energy is not so important to speech privacy, a simplified model which only considers speech energy summation may be sufficient for the SII analysis.
Figure 3. Geometry of a single screen in a flat room.
βf βc B A x y H d l s h R S hef
In Figure 3, the geometry of a single screen in an office room is shown. The energy based sound reflection coefficients of the floor and the ceiling are assumed to be
β
f andβ
crespectively. In Reference [11], a series of image sources and image receivers both below the floor and above ceiling surfaces were introduced to account the sound reflection from the floor and ceiling. When the screen is present, the contribution of each image source at the receiver, either through ‘direct propagation’ or screen diffraction was identified by a criteria associated with the geometrical configuration of the source, receiver, and screen in the flat room, by using sound propagation theory and Maekawa’s single screen diffraction expression accordingly. When only the energy summation of all these contributions at the receiver is of interest, the equations corresponding to those in Reference [11] can be rewritten as,
• When the screen is absent, the total sound pressure level Lp0 at the receiving point R
due to a monopole source with the standard speech spectrum level Ls one meter in
front of it (specified in ANSI S3.5-1997) is.
[
]
, 0, 1, 2, 3,L ) ( log 10 2 2 ) 2 ( floor ) 2 ( ceil 0 = ± ± ± + + + =∑
∞ = −∞ = n l d Y L L n n n n f n c s p β β (1)where ceil(x) and floor(x) are two functions defined as:
x x floor x x ceil ≤ = ≥ = integer greatest the ) ( integer smallest the ) ( (2)
and, Y is the y-coordinate of the nth image
source − + = n s H n n nH n odd for , 2 ) 1 ( even for , [13] .
• When the screen is present, the reflected sound pressure level Lpr at the receiving
point R is
[
]
{ } { } { }
K I n l d Y L L K K K f K c s pr + = + + + =∑
, ) ( log 10 2 2 ) 2 ( floor ) 2 ( ceil β β (3)where integers K, and I are used respectively to represent those images whose y-coordinate does (YK), and does not (YI), satisfy equation (4).
[
k H h s]
k n l l d Y h kH l l d n ef) ( 2) , 0, 2, 4, 6, , 2 ( + < < + + − − = ± ± ± ± + L (4)As a result, the diffracted sound pressure level Lpd at the receiving point R is
( ) ( ) ( ) − + + − ⋅ + ⋅ + =
∑∑
+ + 2 2 ) 2 ( floor ) 2 ( floor ) 2 ( ceil ) 2 ( ceil 2 1 cos 2 1 cos 2 1 cos 20 3 1 log 10 rJ sI rJ sI rJ sI I J IJ fIJ J I f J I c s pd N L L L ϕ ϕ ϕ ϕ ϕ ϕ β β (5)where integers J represents those image receivers which satisfy the equation (6)
, ) ( ef I I m h Y Y d l d y < + − + (6)
Here is the y-coordinate of
the mth image receiver
L , 3 , 2 , 1 , 0 , odd for , 2 ) 1 ( even for , ± ± ± = − + = m m s H m m mH ym [11] .
In equation (6), ( )2 ( )2
I J
IJ d l y Y
L = + + − is the distance from the I-th image source to
the J-th image receiver, 2 ( −LIJ)
0 J I fIJ A B c f
N = + is the corresponding Fresnel number.
2
2 ( )
I ef
I d h Y
A = + − is the distance from the I-th image source to the top of the screen,
and 2 ( )2
J ef
J l h y
B = + − is the distance from the top of the screen to the J-th image
receiver. In this equation, term
fIJ
N
20 3
1
+ is Tatge’s single screen diffraction
expression[14], and the term that follows this accounts for a highly absorptive screen[15], in which I ef sI Y h d − =tan−1 ϕ , J ef y h l − 1 rJ =tan− ϕ .
• When the screen is present, the transmitted sound pressure level Lpt, for the sound
transmitted through the screen panel, is,
[
]
∑
− ⋅ + + + = I TL I I f I c s pt l d Y L L 10 2 2 ) 2 ( floor ) 2 ( ceil 10 ) ( log 10 β β (7)where TL is the transmission loss of the screen.
By combining equations (3), (5) and (7), the total equivalent speech spectrum level required for the SII calculation according to ANSI S3.5-1997 can be written as,
10log(1010 1010 1010 ) pt pd pr L L L es L = + + (8)
As pointed out in Reference [11], the approach presented here may not apply to low frequencies or to small screen-to-ceiling gaps because it was assumed that the magnitude and the phase angle of the reflected sound are not affected by the edge diffraction of the screen and the finite size of the opening (from the top of the screen to the ceiling) above the screen.
4. Analysis and Discussion
4.1 Effects of office parameters on SII
The new model described above is first used to examine the influence of various office design parameters, such as the effective height of the screen, ceiling and floor absorption, etc. on calculated SII values. Of course, the current model does not include the effects of complete workstations but only a single absorptive separating screen with floor and ceiling reflections.
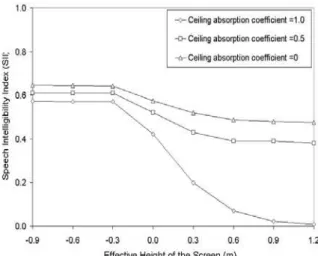
Figures 4 – 7 illustrate the calculated SII values for varied: effective height of the screen, ceiling absorption, floor absorption, and the distance between the source and the receiver. In these calculations, the ‘normal’ speech spectrum level included in ANSI S3.5 (1997) was the speech source and an assumed ambient noise equal to an RC40 spectrum was used. The absorption coefficients of the ceiling, floor and the screen were all assumed to be independent of frequency and incident angle. The distance from the source to the screen was always set equal to that from the screen to the receiver. It was also assumed that the screen has a very high TL so that the sound transmission through the screen was ignored in the calculations.
Figure 4. SII versus the ceiling absorption for varied effective height of the screen (hef ):
s=1.22 m, H=2.74 m, βf=0.5, d=1.37 m, l=1.37
Figure 5. SII versus the effective height of the screen (hef ) for varied ceiling absorption:
s=1.22 m, H=2.74 m, βf=0.5, d=1.37 m,
l=1.37 m.
It can be seen from Figures 4 and 5 that ceiling absorption and screen height have the most important influence on SII. Figure 4 shows that high speech privacy (corresponding to low SII values) only occurs for the highest ceiling tile absorption values. However this only occurs if the screen is also of adequate height relative to the height of the source and receiver. Similarly Figure 5 shows that significant increases in privacy (reductions in SII values) occur with increasing screen height when there is also a highly absorbing ceiling. Thus, the effects of screen height and ceiling absorption interact and it is only with both higher screen heights and highly absorbing ceilings that adequate privacy can be achieved.
Figure 6. SII versus the floor absorption for varied ceiling absorption: s=1.22 m, h=1.52 m, H=2.74 m, d=1.37 m, l=1.37 m.
Figure 7. SII versus the distance between the source and the receiver for varied ceiling absorption: s=1.22 m, h=1.52 m, H=2.74 m,
As shown in Figure 6 for a single screen, the floor absorption has a smaller influence on SII. The maximum change in SII associated with floor absorption is no more than 0.1 and this only occurs when the ceiling is highly reflective. Figure 7 shows that SII decreases with increasing source/receiver distance from the screen. However, with this distance varying from 0.91 m to 4.57 m, SII only decreases by 0.1 with a highly reflective ceiling, and 0.2 with a highly absorptive ceiling. The variations with distance may relate to conditions in varied sizes of workstations but more complete calculations including the effects of complete workstations are required to verify this. However, in most offices, the possible movement of the talker/listener is usually limited to a small area (smaller distances) and for most practical situations the expected benefit of increased distance between the talker and the listener on SII values would be small.
4.2 Effective Ceiling Absorption
In using the model for SII analysis, the determination of the sound absorption coefficients of the ceiling system is critical because SII is very sensitive to the ceiling absorption when the ceiling is quite highly absorptive. Strictly speaking, the sound absorption coefficients are functions of frequency and of angle of incidence. In Section 3, a series of image sources were introduced to represent multiple reflection paths between the ceiling and the floor. Different reflection paths will have different incident angles to the ceiling or the floor surfaces. As a result, the sound absorption coefficients of the ceiling may have different values corresponding to different reflection paths.
Generally, to take the effects of the incident angles on the absorption coefficients into account, the acoustic impedance of the ceiling system in offices, i.e. ceiling tiles backed with an air space, has to be determined first[11, 16]. However, since the impedance data of ceiling tiles are usually not provided by ceiling tile manufactures, it is generally difficult to undertake a rigorous analysis of the ceiling absorption in practical office design. Note that the only data generally available from ceiling tile manufactures are the sound absorption coefficients measured in a reverberation chamber such as the ASTM C423 Standard [17]. These data are expected to be different than the effective sound absorption coefficients of the ceiling in a typical office situation. To benefit the practical use of the model developed here, it was therefore desired to determine the effective absorption coefficients of the ceiling system from the standard ASTM C423 data.
The sound absorption coefficients measured in a reverberation chamber according to ASTM C423 Standard are random incidence coefficients, also known as the Sabine absorption coefficients. It is assumed that the sound field in front of the ceiling tile is diffuse, which implies that energy is uniformly incident from all directions. When measuring ceiling tiles, ASTM C423 suggests a sample mounting with a 400 mm air space behind the tiles[17]. To help understand possible relationships between the effective absorption coefficients and those from ASTM C423 data, it is helpful to first examine the conversion between the statistical absorption coefficients and the Sabine coefficients. Statistical absorption coefficients are the theoretically derived results based on the assumption that energy is uniformly incident from all directions. Though similar to each other, the statistical absorption coefficient and the Sabine absorption coefficient are not the same. The difference between them is partially due to the assumption that the energy is uniformly incident from all directions. For a locally reacting material, statistical coefficients can be estimated through a straightforward analysis from normal incidence
impedance tube measurements[18]. However, in measuring the Sabine absorption
coefficients, an ideal diffuse field is assumed to occur, but this is only approximated in typical reverberation chambers. Furthermore, due to the finite size of the test sample, diffraction effects at the sample edges influence the measured Sabine absorption coefficients. As a result, the Sabine absorption coefficients can have measured values as high as 1.2, whereas statistical absorption coefficients have a theoretical upper bound of 0.95[19].
Bies and Hansen[19] suggested that a conversion factor of 0.84 might exist between the Sabine absorption coefficients and the corresponding statistical absorption coefficients. Also, they argued that use of the statistical coefficients usually results in more accurate estimates for large auditoria. In open-plan offices, the sound field is not diffuse, and the typical distance from the source or receiver to the screen would not vary much, perhaps within 1-2 m. As a result, the absorption of the ceiling system for particular angles of incidence may dominate the absorption behaviour. Therefore, similar to the conversion between the Sabine coefficients and the statistical ones, there may also exist an approximate relationship between the Sabine coefficients and the effective coefficients of the ceiling system in open-plan offices.
The effect of the back space on the absorption coefficients of the ceiling is another issue that must be discussed here. Normally, the existence of a back space above the ceiling tile
would change the surface impedance of the ceiling and thus change the absorption
coefficients. However, according to Bies and Hansen[19], such changes only happen at
low frequencies, say fl/c<0.1, where f is frequency, l is the thickness of the ceiling tile,
and c is the sound speed in air. Also, it was found by Bies and Hansen[19] that the
variation in the statistical absorption coefficients due to the back space is observed only when the flow resistance of the material is within the region, 0.01<Rl/
ρ
c<100, where R isthe flow resistance of the material, and
ρ
is the density of air. This therefore indicates that for ceiling tiles, for which the flow resistance is very high or very low, the backspace would not significantly affect the sound absorption coefficients. For ceiling tiles for which the flow resistance is within the region, 0.01<Rl/ρ
c<100, the changes in the soundabsorption due to the backspace were only observed at low frequencies. Therefore, if only the high frequency behaviour is of interest, it may be possible to obtain the effective sound absorption coefficients of the sample with different depths of backspace based on ASTM C423 data which are obtained with a 400 mm backspace.
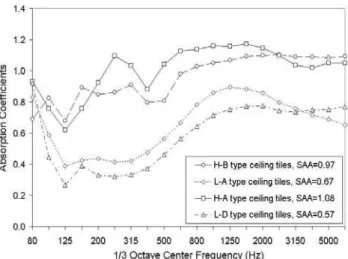
In order to obtain a conversion relationship between the ASTM C423 measured Sabine coefficients and the expected effective coefficients, four different ceiling tiles representing the range of absorptions found in typical office ceilings (SAA from 0.57 to 1.08) and two different depths of ceiling back space (0.787 m, and 1.09 m) were considered. (SAA is the Sound Absorption Average is an average absorption coefficient as defined in ASTM C423). Figure 8 shows the ASTM C423 absorption coefficients for these four ceiling tiles. The effective absorptions of the ceilings were obtained with them installed in a test room that is 9.2 m long, 4.7 m wide and 3.6 m high. The walls of the room were covered by 0.1 m thick foam to eliminate sound reflections. A single screen with three possible heights, 1.22 m, 1.52 m, and 1.83 m was built across the room. The screen was covered by 50 mm thick foam to be highly absorptive. The sound pressure levels at four positions, 0.91m, 1.83m, 2.74m, and 3.66 m, behind the screen were measured with the source at 0.91 m or 1.83 m in front of the screen for each ceiling condition.
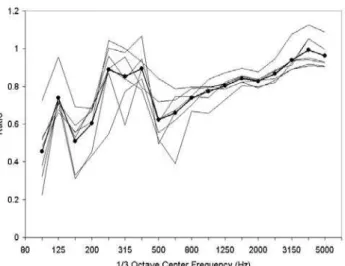
By applying the model developed in Section 3 and adjusting the reflection coefficients of the ceiling to fit the measured sound pressure levels at these four different positions behind the screen, model-fitted reflection coefficients of the ceiling were obtained for different ceiling conditions. By converting the Model-fitted reflection coefficients to model-fitted absorption coefficients, the ratios between the model-fitted absorption
coefficients and the measured ASTM C423 coefficients was obtained and are plotted in Figure 9. It can be seen that above 500 Hz, the ratios obtained for different ceiling conditions are quite similar to each other. They are also not too different than the 0.84 factor suggested by Bies and Hansen to relate statistical and Sabine coefficients. At frequencies below 500 Hz, larger differences occur, presumably due to the more complex interaction of the depth of the air space and the properties of the ceiling tiles in this frequency range. Note that as far as speech privacy is concerned, lower frequency components below about 500 Hz are not so important. Therefore, the average ratios shown in Figure 10 may be an acceptable empirical relationship between the ASTM C423 data and the effective absorption coefficients of the ceiling system in open-plan offices. That is, this average ratio can be used to correct measured absorption coefficients from ASTM C423 tests to better represent the effective absorption of the ceiling tiles in typical open office situations.
Figure 8. Sound absorption coefficients of four different ceiling tiles measured in the reverberation chamber according to ASTM C423 Standard.
Figure 9. The ratio between the Model-fitted absorption coefficients and measured Sabine absorption coefficients for different ceiling configurations: , average.
4.3 Practical application of the model
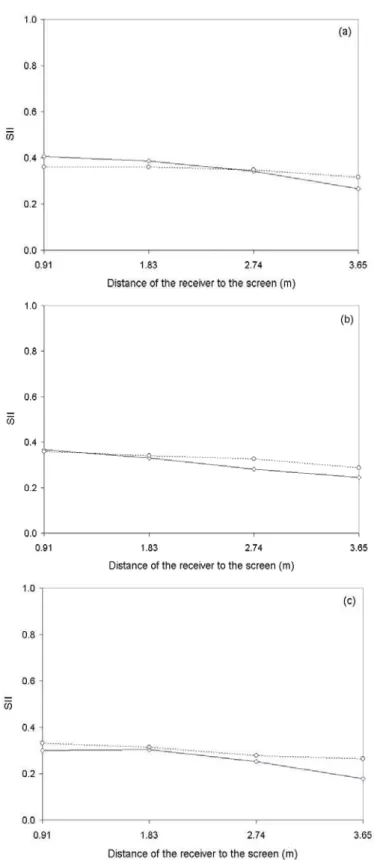
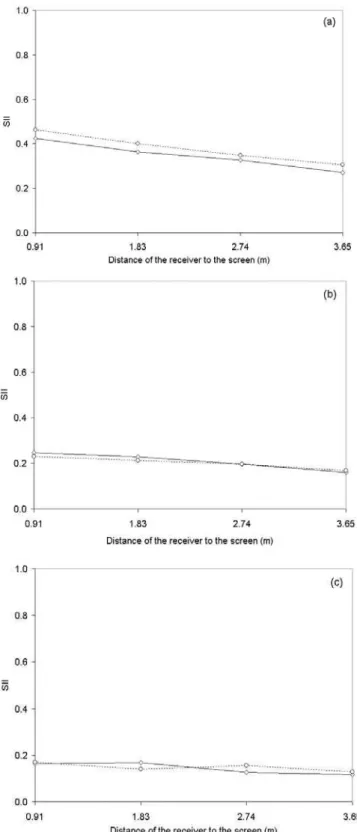
In order to validate the complete model and this conversion relationship, the sound pressure levels at different positions behind a screen for two ceiling conditions, L-A type ceiling tiles with a backspace of 1.09 m, and H-B type ceiling tiles with a backspace of 0.787 m, are calculated after substituting the corrected absorption coefficients into the model. Then, the speech intelligibility index values (SII) are calculated for four different positions and compared with measured SII values in Figure 10 and 11 respectively. Here, SII was calculated based on the standard normal speech spectrum level suggested in ANSI S3.5 (1997) and an assumed ambient noise equal to an RC40 spectrum. The agreement between the measured and estimated SII values is in general good. The RMS error in SII values is 0.03.
Figure 10. Speech intelligibility index at different positions: L-A type ceiling tiles with a back space of 1.09 m, Í— experiment; È··· prediction; s=1.22 m; (a), d=0.91 m, h=1.52 m; (b), d=1.83 m, h=1.52 m; (c), d=1.83 m, h=1.83 m.
Figure 11. Speech intelligibility index at different positions: H-B type ceiling tiles with a back space of 0.787 m, Í— experiment; È ··· prediction: s=1.22 m; (a), d=1.83 m, h=1.22 m; (b), d=1.83 m, h=1.52 m; (c), d=1.83 m, h=1.83 m.
5. Conclusions
In this paper, a mathematical model for calculating the speech intelligibility index behind a single screen in an open-plan office including floor and ceiling reflections is presented. Quantitative analyses show that ceiling absorption and the effective height of the screen are the two major factors that affect SII significantly. To achieve adequate speech privacy in offices, the combination of a high absorption ceiling and a sufficiently high screen are essential. To facilitate the practical use of this model, an empirical correction between the measured Sabine absorption coefficients of the ceiling system according to the ASTM C423 standard (with E400 mount), and the effective absorption coefficients of the same ceiling in a typical open-plan office was obtained. When this empirical correction is included, the model can predict speech intelligibility index values with an RMS error of 0.03.
Very recent results suggest that a ‘normal’ voice level as specified in ANSI S3.5 is louder than typical voice levels found in actual open-plan offices [20]. The use of lower, and apparently more realistic, speech levels would lead to results indicating greater absolute values of speech privacy than those in Figures 10 and 11.
Acknowledgements
This work is part of the COPE project supported (at time of writing) by Public Works and Government Services Canada, Ontario Realty Corporation, USG Corporation, National Resources Canada, Steelcase, British Columbia Buildings Corporation, and The Building Technology Transfer Forum. The donation of ceiling tile material by USG Corporation and Ottawa Fibre was much appreciated. The authors would like to thank Mr. B. Biffard and Mr. S. Bumpus for their contributions to the experimental work of the project at NRC. Suggestions given by the members of the Cope Acoustics Team are appreciated. C. Wang also acknowledges receipt of a National Research Council Postdoctoral Fellowship for the pursuit of the study.
References
1. Cavanaugh, W.J., Farrell, W.R., Hirtle, P.W., and Watters, B.G., 1962, “Speech privacy in buildings”, Journal of the Acoustical Society of America, 34(4), pp475-492.
2. ANSI S3.5-1969, American National Standard Methods for the Calculation of the Articulation Index.
3. Warnock, A.C.C., 1973, “Acoustical privacy in the landscaped office”, Journal of the
Acoustical Society of America, 53(6), pp1535-1543.
4. Herbert, R.K., 1978, "Use of the Articulation Index to evaluate acoustical privacy in the open office", Noise Control Engineering Journal, September-October, pp64-67. 5. Warnock, A.C.C., 1978, “Studies of acoustical parameters in open-plan offices”,
Journal of the Acoustical Society of America, 63(3), pp832-840.
6. Pirn, R., 1971, "Acoustical variables in open planning", Journal of the Acoustical
Society of America, 49(5), pp1339-1345.
7. Chan, K.K., and To, W.M., 1996, "Improving speech privacy in an open plan office",
Inter-noise96, Liverpool, pp.1855-1858.
8. Moreland, J.B., 1988, "Role of the screen on speech privacy in open plan offices",
Noise Control Engineering Journal, V30(2), pp43-56
9. ANSI S3.5-1997, American National Standard Methods for Calculation of the Speech Intelligibility Index.
10. Alfredson, R.J. and Seow, B.C., 1976, “Performance of three sided enclosures”,
Applied Acoustics, 9, pp45-55.
11. Wang, C. and Bradley, J.S., 2000, “A mathematical model for a single screen barrier in open-plan offices”, submitted for publication.
12. Kurze, U.J., 1985, “Scattering of sound in industrial spaces”, Journal of Sound and
13. Kotarbinska, E., 1988, “How to calculate the efficiency of an acoustic barrier in a flat room”, Applied Acoustics, 23, pp99-108.
14. Tatge, R.B., 1973, “Barrier-wall attenuation with a finite-sized source”, Journal of
the Acoustical Society of America, 53, pp1317-1319.
15. Butler, G.F., 1974, “A note on improving the attenuation given by a noise barrier”,
Journal of Sound and Vibration, 32(3), pp367-369.
16. Ingard, K.U., 1994, Notes on sound absorption technology, Version 94-02, Noise Control Foundation, USA.
17. ASTM C423-99a, Standard Test Method for Sound Absorption and Sound
Absorption Coefficients by the Reverberation Room Method.
18. Kuttruff, H., 1973, Room acoustics, Applied Science Publishers LTD.
19. Bies, D.A. and Hansen, C.H., 1980, “Flow resistance information for acoustical design”, Applied Acoustics, 13(5), pp357-391.
20. Warnock, A.C.C. and Chu, W.T., “Speech Levels in Open Plan Offices”, J. Acoust. Soc. Am., vol. 110, No. 5, p. 2664 (2001).