European Heart Journal (1985) 6, 391-398
Dynamics of aortic flow in hypertrophic cardiomyopathy
R. JENNI, K. RUFFMANN, A. VIELI, M. ANLIKER AND H. P. KRAYENBUEHLMedical Policlinic, Cardiology and Institute of Biomedical Engineering, University of Zurich and Swiss Federal Institute of Technology, Zurich, Switzerland
KEY WORDS: Multi-gate Doppler, cross-sectional echocardiography.
The purpose of this study was to reassess left ventricular ejection dynamics in hypertrophic cardiomyopathy, to investigate whether a premature stoppage of ejection occurs, as previously reported, and whether reliable criteria for left ventricular outflow tract obstruction can be established by non-invasive evaluation of aortic flow patterns. In a group of 21 patients with hypertrophic cardiomyopathy, composed of 9 with the
obstruc-tive form (HOCM), 9 with the non-obstrucobstruc-tive form (HNCM) and 3 with apical hypertrophy (HACM), instantaneous flow velocities across the ascending aorta were determined non-invasively with a 16-gated Doppler 2-D echo instrument. Ten normals served as controls. The 16 flow velocities were averaged over 8 heart beats and the relative volume flow rate was calculated by microprocessor analysis. Ejection time (i.e. flow time) derived from the flow curves was compared with the available ejection period as determined from
the carotid pulse tracing. In normals, ejection time amounted to 94 + 3% of the available ejection period, in HOCM to 92±5% and in HNCM to 93±4% (no significant differences). In HACM, however, ejection time was reduced to 71 ± 14% of the available ejection period. In contrast to HNCM, aortic flow in HOCM was characterized by an early peak followed by a plateau at a sizeably lower flow level for the rest of systole. Flow time of an abnormally short duration was the hallmark of HACM. We conclude that in patients with hypertrophic cardiomyopathy, HOCM and HNCM can be distinguished by the shape of their volume flow curves. A premature stoppage of ejection is only found in patients with HACM.
Introduction m e n t s o f a o n i c flow b y m e a n s o f a n e l e c t r 0. '1
y
It is well established that patients with hyper- magnetic flowmeter'21 have yielded evidence trophic cardiomyopathy may present with or that the premature drop in systolic flow observed without a systolic pressure gradient across the left in hypertrophic obstructive cardiomyopathy ventricular outflow tract. Traditionally, the pres- (HOCM) is abolished after successful surgical ence of a gradient has been associated with the correction. Murgo et a/.'3' have reported that in obstructive and the absence of a gradient at rest or hypertrophic cardiomyopathy aortic flow ceases after provocation with the non-obstructive form of early, when 61 to 69% of the available ejection the disease. There is, however, considerable debate period is completed, irrespective of the presence whether the dynamics of ejection into the aorta are or absence of intraventricular pressure gradients, different in patients with and those without a pres- In the present study, we have determined non-sure gradient, or, in other words, whether the flow invasively the dynamics of aortic flow in hyper-pattern in the ascending aorta is modified by an trophic cardiomyopathy using 16-gated Doppler impedance of left ventricular outflow at some time 2-D echocardiography. The principal goal was to during systole. Earlier studies"1 have shown that elucidate whether there is indeed a premature stop-despite 'outflow obstruction' the major part of the page of ejection and whether from the shape of left ventricular stroke volume is ejected during the the aortic volume flow curve conclusions can be first 50-60% of systole. Intraoperative measure- drawn as to the presence or absence of a pressure
gradient. Received for publication on 8 October 1984 and in revised form 29
January 1985.
Methods Address for correspondence: Rolf Jenni, M.D., M.S.E.E., Medical
Policlinic, Cardiology, University Hospital, Raemistrasse 100, PATIENTS
CH-8091, Zurich, Switzerland. The study population consisted of 9 patients (4
Figure I 2-D echogram of the aortic arch. The Doppler beam (white line, including the 16 sampling volumes) is
placed upstream of the brachiocephalic trunk (TR) in the ascending aorta (AO ASC). AP indicates the right pulmonary artery. In the upper left an instantaneous velocity profile at end-systole is shown. The calibration markers are given at the right side of the fan.
females, 5 males) with obstructive (HOCM), 9 patients (2 females, 7 males) with non-obstructive (HNCM), and 3 patients (1 female, 2 males) with apical (HACM) hypertrophic cardiomyopathy. The diagnosis was established by 2-D echo, left and right heart catheterization and cineangio-graphy in all patients with HOCM and HNCM as well as in one of the patients with HACM. In patients with HOCM, a systolic pressure gradient between the left ventricular inflow and outflow tract was present at rest or in a postextrasystolic beat. HNCM was diagnosed when 2-D echo showed asymmetrical septal hypertrophy and when a pressure gradient was absent at rest as well as after provocation by an extrasystole. HACM was identified by the typical spade-like aspect of the end-diastolic left ventricular silhouette in the right anterior oblique projection. In the other two patients with HACM, the diagnosis was based on the presence of massive left ventricular wall thick-ening confined to the apex in high quality 2-D left ventricular echocardiograms. Mean age in the three groups was 40, 45 and 34 years, respectively.
Mean systolic pressure gradient at rest across the left ventricular outflow tract amounted to 27 mmHg (range 10 to 50 mmHg) in HOCM. Mild mitral insufficiency was present in 3 out of 9 patients with HOCM. Ten normals (4 females, 6 males, mean age 24 years) served as controls. These subjects were not studied invasively: all drugs were withdrawn 24 hours prior to the cardiac catheterization and the Doppler echo study. INSTRUMENTATION
A Diasonic CV-3400R Sector Scanner with an integrated multigate Doppler subsystem was used with its standard 2-25 Mhz transducer. Beam profile data kindly supplied by Diasonics Inc., Milpitas, CA, U.S.A., indicate that the half max-imum beamwidth in the waterbath is of the order of 3 to 7 mm in the depth range of 4 to 10 cm and at an angle of less than 30 degrees which includes the region within which the Doppler measurements were made. In addition, the axial length of the sampling volume is given as being 2 mm. The 16 gates, the interspace of which is adjustable, were
Dynamics of aortic flow 393
distributed equally along the Doppler beam axis between the anterior and posterior aortic walls (Fig. 1). If the distance between the anterior and posterior aortic walls is more than 32 mm there is a gap between adjacent gates; if the distance is less than 32 mm, the gates overlap partially. The pulse repetition frequency for the Doppler beam was between 3-7 kHz and 2-35 kHz depending on the depth of the posterior wall. The velocity infor-mation from each gate was sampled by an external microcomputer (Motorola, 6800) and the instan-taneous velocity profiles were displayed on the monitor of the CV-3400R. The microcomputer digitizes the velocity information from each of the gates 1 to 16 with a frequency of 64 Hz and a resolution of 8 bits. Furthermore, it averages these data for each of the gates at corresponding instants in the heart cycle over 8 successive heart beats. During the data acquisition the instantaneous maximum velocity versus time is displayed on a monitor for each heart cycle separately. This allows the operator to eliminate data sets contain-ing velocity information associated with ectopic
beats and excessive motion of the vessel relative to the transducer. The averaged profiles are stored on floppy disc for offline analysis.
DATA ACQUISITION
After echographic visualization of the ascending aorta and the aortic arch in their maximum diameter (Fig. 1), the Doppler beam was placed upstream of the brachiocephalic trunk in such a way that (1) the angle of incidence near the anterior aortic wall was nearly the same as near the posterior aortic wall and (2) no aliasing occurred. Then, gate number 1 was placed near the aortic wall closer to the transducer, and gate number 16 near the one farther away from it. Thereafter, the two-dimensional image was frozen to allow for the higher acquisition rate of the Doppler signal. In all subjects the beam could be placed such that the Doppler signal did not exhibit aliasing.
DATA ANALYSIS
To determine the instantaneous average velocity across the profile of the ascending aorta each
Table 1
Normal HOCM HNCM (JV=9)
HACM
Age (years)
Heart rate (beats min"') Enddiastolic left ventriclar diameter (cm)
Endsystolic left ventricular diameter (cm) Fractional shortening (%) Left ventricular posterior wall thickness (cm) Interventricular septal thickness (cm) Septal/free wall ratio Systolic anterior motion Midsystolic closure of the aortic valve
Mean pressure gradient (mraHg) TimetoV,(%ofSEP) TimetoV2(%ofSEP) 76— NS—67— NS— 74 NS 5-4 * 4-6 NS 4-9 NS 3 . 4 _ * * * _ 2 - 4 —NS —3-0 NS 36 NS 44 NS 39 NS 0-8 • * 10 NS 101 0 -_ • • -_ 0 9 • * . 11 — * * • -0 0 0 • 1 - 9 - -NS--1-9- -NS--1-7 -1-7 7/9 — NS — 3/9 8/9-27 33 59 34 72 50 2-8 44 1-3 1-5 115 0 0 0 0 •/><005; **/><001; "*P<000\.
Normol x ( c m ) ( a ) HOCM x (cm) ( b )
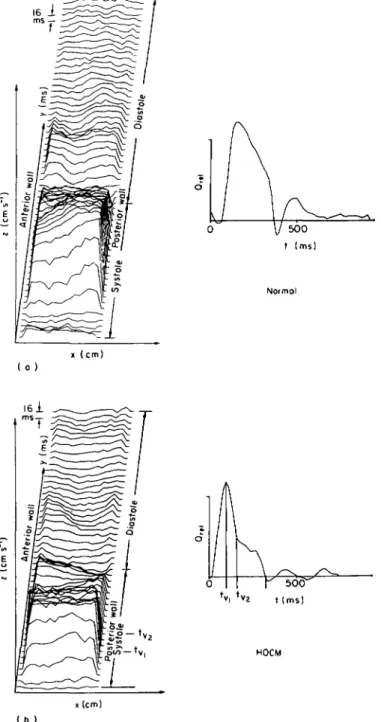
Figure 2 Velocity profiles and volume flow in the four groups:
(a) Normal subject: On the left are depicted the velocity profiles which represent the average of eight heart cycles. On the right the relative volume flow is shown: x — Distance in cm divided into 16 channels; y — time in ms, the individual profiles are separated by 16 ms, starting with the R-wave of the ECG; z — relative velocity in cm s"1; Qre, — relative volume flow; t — time in ms. The velocity profiles on the left show the velocity distribution along the diameter of the ascending aorta. Throughout the whole cardiac cycle we can observe skewed velocity profiles with higher velocities near the posterior aortic wall. The volume flow curve shows a brief backflow in early diastole due to the aortic valve closure and diastolic coronary flow.
Dynamics of aortic flow 395 16 ms 500 t (ms) HNCM ( c ) x (cm) 500 t (ms) HACM i (cm) I d )
late-systolic plateau. In contrast to normals the velocity profiles on the left show only in early and late systole skewed profiles, in midsystole the profiles are flat and not skewed. On the right, the typical volume flow curve is shown, where flow peaks at midsystole (V,), then drops to a lower level (V2) well above zero-flow until the end of systole. When the gradient at rest increases the telesystolic flow decreases, or in other words the ratio V,/V2 increases.
(c) Patient with HNCM: same abbreviations as in (a). In contrast to the patient with HOCM, no late-systolic plateau is present. The shape of the volume flow curve as well as the velocity profiles resembles that in the normal subject [Fig. 2(a)]. (d) Patient with HACM: same abbreviations as in (a). The aortic flow terminates prematurely after an ejection time of 175 ms, the available ejection time in this patient being 305 ms.
velocity value within a profile is assumed to be representative of a semiannular segment of the vessel cross section. Based on this assumption the measured velocities are weighted by the areas of the corresponding segments; they are then added and normalized to a cross-sectional area of 1, to yield the instantaneous mean velocity. This approach is called the ring method. The cor-responding M-shaped weighting function has its minimum at the channels 8 and 9 and increases linearly with the distance from the vessel axis. It is assumed that the angle of incidence and the vessel lumen remain constant throughout the whole cardiac cycle. Thus, we do not calculate the true stroke volume but use the time integrals of the measured average velocity within the vessel cross section instead.
ECHOCARDIOGRAPHIC EXAMINATION
A standard M-mode and 2-D echocardiographic examination from the parasternal position and from the parasternal, apical, subcostal and suprasternal positions, respectively, were, per-formed in every patient. Simultaneously, a carotid pulse tracing was recorded.
STATISTICAL ANALYSIS
Differences between mean values of the three groups (normal, HOCM, HNCM) were tested for statistical difference by analysis of variance. x2-test was used for comparison where applicable. No statistical comparisons with the group of patients with HACM (N=3) were carried out.
Results
Table 1 summarizes the data. Asymmetric septal hypertrophy was present in HOCM as well as in HNCM. Systolic anterior motion of the anterior mitral leaflet (SAM) occurred in 7 out of 8 patients with HOCM and in 3 out of 9 patients with HNCM, a difference which was not significant by X2-test at 5% confidence level. Midsystolic aortic valve closure could be demonstrated in 8 out of 9 patients with HOCM, but in no patients with HNCM.
Figure 2 gives a typical example of aortic flow in a control subject (upper left), in a patient with HOCM (upper right), in a patient with HNCM (lower left) and in a patient with HACM (lower right). Volume flow rate is always displayed on the right side of each panel, whereas the spatial distribution of the velocities measured is shown on
the left. Each graph encompasses an entire cardiac cycle, starting with the R-wave of the ECG and continuing with the measurements every 16 ms to the next R-wave. Flow velocities above the zero-line represent forward flow and vice versa. In normals, after the R-wave, there is a forward flow lasting for about 250 ms, followed by a brief back-flow in early diastole and then by a small forward flow lasting for the remainder of the cardiac cycle. It is evident that the velocity distribution in the ascending aorta below the brachiocephalic trunk is not at all uniform across the vessel diameter14'. In HOCM, flow peaks at midsystole (V,), and then drops to a lower level (V2), well above zero flow and continues at this level till the end of systole. There is a fairly uniform velocity distribution across the vessel diameter. The pattern of aortic flow in HNCM resembles closely that observed in normals; in patients with HACM, however, for-ward flow in the ascending aorta is limited to early and midsystole.
Ejection period from the carotid pulse tracing (SEP) is slightly longer than the duration of aortic flow measured by Doppler sonography (ET). In Fig. 2 the areas under the aortic flow curves cor-respond to 100% of the stroke volume ejected into
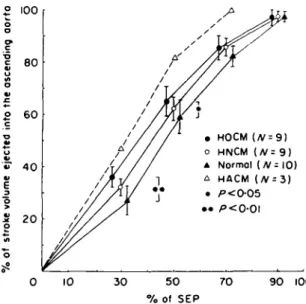
° 100 o 6 0 HOCM (/V = 9) HNCM (/V= 9 ) Normal {N= 10) HACM (/v = 3) / ' < 0 - 0 5 20 10 30 5 0 70 90 100 % of SEP
Figure 3 % Stroke volume ejected into the ascending aorta is plotted against the % of SEP (available systolic ejection period). Presented are mean values ± I standard error. Although at 30 and 50% of SEP the patients with HOCM ejected a significantly higher percentage of stroke volume as compared with the controls no premature stop of ejection was present in these patients. In contrast in the 3 patients with HACM 100% of stroke volume were ejected at 71 % of SEP.
Dynamics of aortic flow 397
the ascending aorta. When the percentage of stroke volume ejected is plotted against the percentage of SEP (Fig. 3) it becomes evident that systolic for-ward flow in the aorta lasts until more than 90% of SEP has elapsed in normals as well as in HOCM. However, there is a significantly greater portion of stroke volume ejected in the first half of systole in HOCM than in normals. The corresponding values in HNCM are intermediate to those in controls and HOCM. In contrast, aortic forward flow in HACM is terminated much earlier.
Discussion
The present study was undertaken to investigate whether the various forms of hypertrophic cardio-myopathy can be distinguished by the dynamics of aortic flow, as determined by multigated Doppler analysis. Of particular interest was the question whether in the presence of an intraventricular pressure gradient there is any change of the aortic flow pattern which would indicate impedance to ejection occurring during systole. Earlier studies on left ventricular ejection dynamics in patients with hypertrophic cardiomyopathy and intra-ventricular pressure gradients were indicative of outflow obstruction, because myectomy normal-ized the pattern of electromagnetically recorded flow in the ascending aorta at operation121 and because the increase of the intraventricular pressure gradient during postextrasystolic beats was not associated with a decrease of the ratio time required to eject 90% of stroke volume/total systolic contraction time, as is usually the case in normals in the postextrasystolic beat15'. Murgo et
al.{3], on the other hand, have reported a premature stoppage of ejection in patients with hypertrophic
cardiomyopathy, irrespective of whether an intra-ventricular pressure gradient was present or not. The same premature stop was found131 when out-flow dynamics were determined independently by a catheter-mounted electromagnetic flow probe and by frame-by-frame angiographic volumetric analysis.
The results of our study are at variance with those of Murgo et alP\ because we observed that aortic flow in both HOCM and HNCM continues throughout systole until about 90% of SEP has elapsed. It is recognized, however, that in contrast to Murgo's study none of our patients with HOCM had a gradient at rest greater than 50 mmHg. The relative duration of ET is nearly the same in HOCM, HNCM and normals.
Nevertheless, a premature stop of ejection does occur in hypertrophic cardiomyopathy, but only in that small subgroup of patients where hypertrophy is localized in the apical portion of the left ventricle, and where it produces systolic cavity obliteration.
Aortic flow in HOCM was characterized by a distinctive shape of the volume flow curve, i.e. by a sudden drop to a lower level in the second half of systole. This particular flow curve pattern appears to be a sensitive and specific marker of an intraventricular pressure gradient, because all patients with HOCM had the characteristic V^/Vj-ratio and none of the patients without a gradient had a mid-systolic premature drop in aortic flow rate. The magnitude of the ratio V,/V2 appears to bear some relationship to the severity of the intraventricular pressure gradient. Similar observations were made by Gardin et a/.'61 who assessed ascending aortic flow velocity by single sample volume echo-Doppler.
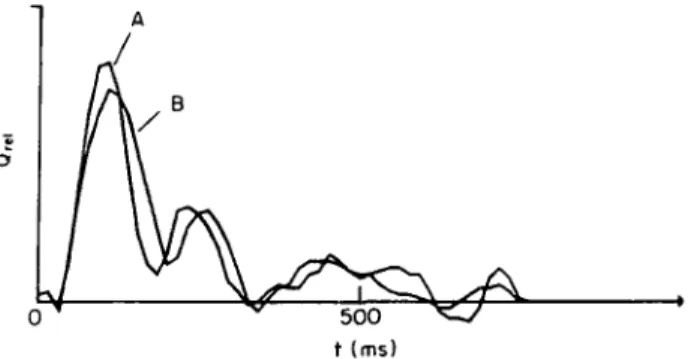
500 t (ms)
Figure 4. The flow curve in the ascending aorta (B) is superimposed to the flow curve obtained in the left ventricular out-flow tract (A): t — time in ms, Qt d — relative volume flow. Note that the shape of the two curves is very similar.
It may be argued that the shape of the aortic flow curve in the ascending aorta in patients with HOCM is influenced by the elastic properties of the aortic wall. It would then not truly reflect left ventricular ejection dynamics. However, super-imposition of Doppler measurements obtained in the ascending aorta and in the left ventricular out-flow tract (Fig. 4) shows a close resemblance of both flow curves. Hence the aortic flow measure-ments obtained in the ascending aorta appear to be representative of left ventricular ejection dynamics. The shape of the aortic flow curve in the ascend-ing aorta12'3'7-81 and the manner by which left ventricular emptying into the ascending aorta takes place'1'5'9'in HOCM, as compared with nor-mals, has been the subject of a number of previous reports" ~3'5'7"9 1 using invasive methods. By frame-by-frame analysis of cineangiograms"'3'51, by the measurement of aortic flow by means of an electromagnetic flowmeter cuffed around the ascending aorta at the time of operation'2'8', by means of a catheter-mounted velocity-probe placed in the ascending aorta'3', or by application of the pressure-gradient technique to pressure measurements in the ascending aorta'7', it has been shown that in HOCM aortic flow velocity is abnor-mally high in early systole. After the early peak of aortic flow a sharp drop to a lower plateau with little'2-7'81 or no further ejection"'3'41 into the ascending aorta was described.
It is noteworthy that except in the study of Murgo et a/.'31 a premature stoppage of ejection was found by those authors who used cineangio-graphic techniques whereas the more direct evalu-ation of flow dynamics in the ascending aorta'2'7'81 yielded a continuing forward flow, although small, until the end of systole. This discrepancy may reside in the fact that cineangiography at a filming rate of 60 frames s"1 is a too crude method for detecting small increments in the ejected volume during the last 30% of SEP. Moreover, in the irregularly shaped LV cavity of HOCM, changes of volume are more reliably assessed from biplane than from singleplane cineangiograms. However, in all of the abovementioned studies"'351 the time
course of ejection was based on the evaluation of singleplane cineangiograms.
In conclusion, aortic flow in hypertrophic car-diomyopathy is characterized by distinct patterns that allow a clear separation of forms with and without pressure gradients. The midsystolic drop in aortic flow is indicative of a dynamic systolic impedance to ejection and fits well with the tradi-tional concept of obstruction in the presence of a pressure gradient. Premature stoppage of aortic flow does occur occasionally in hypertrophic cardiomyopathy, but was found in all cases with the apical form of the disease.
References
[1] Wilson SW, Criley MJ, Ross RS. Dynamics of left ventricular emptying in hypertrophic subaortic stenosis: a cineangiographic and hemodynamic study. Am Heart J
1967; 73: 4-16.
[2] Bircks W, Bostroem B, Gleichmann U, Kreuzer H, Loogen R. Electromagnetic flow measurement in the ascending aorta before and after repair of valvular and subvalvular lesions including IHSS. Proc Vth European Congress of Cardiology, Athens, 1968: 13-21.
[3] Murgo JP, Alter BR, Dorethy JF, Altobelli SA, McGranahan GM Jr. Dynamics of left ventricular ejec-tion in obstructive and non-obstructive hypertrophic cardiomyopathy. J Clin Invest 1980; 66: 1369-82. [4] Jenni R, Vieli A, Ruffmann K, Krayenbuehl HP, Anliker
M. A comparison between single gate and multigate ultrasonic Doppler measurements for the assessment of the velocity pattern in the human ascending aorta. Eur Heart J 1984; 5: 948-53.
[5] Peters J, Bhargava V, Johnson A, Mangiardi L, Slutsky R. Left ventricular emptying dynamics in patients with asymmetric septal hypertrophy and concentric hyper-trophic cardiomyopathy. Clin Cardiol 1982; 5: 647-52. [6] Gardin JM, Dabestani A, Glasgow GA et al. Doppler
aortic blood flow studies in obstructive and non-obstructive hypertrophic cardiomyopathy. Circulation 1982; 66: II; 267.
[7] Hernandez RR, Greenfield JC Jr, McCall BW. Pressure-flow studies in hypertrophic subaortic stenosis. J Clin Invest 1964; 43: 401-7.
[8] Pierce GE, Morrow AC, Braunwald E. Idiopathic subaortic stenosis. 3. Intraoperative studies of the mechanism of obstruction and its hemodynamic conse-quences. Circulation 1964; 30: IV; 152-213.
[9] Criley JM, Lewis KB, White RI Jr, Ross RS. Pressure gradients without obstruction: a new concept of 'hypertrophic subaortic stenosis'. Circulation 1965; 32: 881-7.