Acute effects of pharmacological modifications of fatty acid metabolism on
human satiety
Blandine Gatta
1, Christine Zuberbuehler
2, Myrtha Arnold
2, Roberte Aubert
3, Wolfgang Langhans
2,3and Didier Chapelot
4*
1Service d’Endocrinologie et Maladies Me´taboliques, Hoˆpital du Haut Le´veˆque, Pessac, 33604, France
2Physiology and Behaviour Group, Institute of Animal Sciences, ETH Zurich, Schorerstrasse 16, 8603 Schwerzerbach, Switzerland 3Universite´ Paris 7, INSERM U695, Faculte´ Xavier Bichat, 75018 Paris, France
4Universite´ Paris 13, Re´ponses Cellulaires et Fonctionnelles a` l’Hypoxie, EA 2363, UFR Sante´ Me´decine et Biologie Humaine, 93017 Bobigny Cedex, France
(Received 25 May 2008 – Revised 6 October 2008 – Accepted 7 October 2008 – First published online 16 December 2008)
The role of NEFA in eating behaviour is still poorly known. Our objective was to examine whether etomoxir (ETO), an inhibitor of NEFA oxi-dation, or (2 )-hydroxycitrate (HCA), an inhibitor of lipogenesis which may indirectly stimulate NEFA oxioxi-dation, alters satiety. Post-lunch satiety was measured in eight normal-weight male subjects who were deprived of time cues and received on three occasions either ETO (320 mg), HCA (2 g) or placebo (PLA) in random order. Between lunch and dinner, blood was withdrawn continuously and collected every 10 min for measures of plasma concentrations of glucose, insulin, lactate, TAG, NEFA, b-hydroxybutyrate (BHB), leptin and ghrelin. Results showed that HCA began to decrease hunger and desire to eat compared to PLA and ETO 210 min after lunch and increased satiety duration compared to PLA by 70 (SE23) min (P, 0·05), but did not modify energy intake at dinner. ETO did not affect any variable of satiety. HCA increased NEFA concentrations during the pre-dinner period, whereas ETO increased and decreased plasma concentrations of NEFA and BHB, respectively. Mean differences in plasma NEFA concentrations between HCA and PLA were predictive of the differences in satiety duration between treatments (r20·71, P, 0·01). Among treatments, plasma leptin concentration at dinner onset was the only blood variable correlated with energy intake at this meal (r 2 0·75, P, 0·0005). In healthy, normal-weight men, acute HCA increased the intensity and duration of satiety possibly via increased NEFA disposal for oxidation.
(2 )-Hydroxycitrate: Eating: Fatty acid oxidation: NEFA: Leptin
Obesity is a major health problem in industrialized countries, and its prevalence continues to increase(1,2). Diet character-istics that favour passive overeating may contribute to the development of obesity. Consumption of dietary fats above the organism’s ability to oxidize them is a primary suspect in this context(3). Treatments improving this imbalance between fat intake and oxidation may therefore hold some therapeutic potential.
In man, satiety is usually assessed by recording: (1) its intensity through subjective feelings; (2) its duration through the delay until the next meal request occurs, i.e. the inter-meal interval (IMI); and (3) the amount eaten in a inter-meal pre-sented at a fixed or freely chosen time. Simultaneous assess-ment of all three parameters can be considered to be the most accurate evaluation of satiety in man.
A large body of evidence suggests that metabolic factors contribute to satiety. Thus, a drop in circulating glucose has been repeatedly reported to be associated with meal initiation(4). Furthermore, fatty acid oxidation inhibitors such as methyl-palmoxirate(5) and mercaptoacetate(6) have been
shown to stimulate eating, and in rats mercaptoacetate stimu-lated eating by shortening IMI duration without altering meal size(6), suggesting that oxidation of NEFA contributes to sati-ety. Consistent with this concept, an impaired NEFA oxidation was shown to be a predictive factor of diet-induced obesity in animals(7) and man(8). Furthermore, the eating-stimulatory effect of mercaptoacetate was found to be mediated by abdominal vagal afferents(9), consistent with the idea that a metabolic hunger signal may originate from the liver.
Studies addressing the role of fat metabolism in man mainly used etomoxir (ETO) and (2 )-hydroxycitrate (HCA). ETO reduces NEFA oxidation by inhibiting carnitine-palmytoyl-transferase-1, the rate-limiting enzyme for the transfer of long-chain fatty acids across the mitochondrial membrane. Conversely, HCA, derived from the Indian fruit Garcinia cambogia, reduces de novo lipogenesis by inhibiting the cyto-solic enzyme ATP-citrate-lyase(10). By limiting the availability of malonyl-CoA, ATP-citrate-lyase inhibition might indirectly increase NEFA oxidation(11). Very few studies, however, specifically addressed the effects of these agents on satiety.
* Corresponding author: Dr Didier Chapelot, Physiologie du Comportement Alimentaire, Laboratoire des Re´ponses Cellulaires et Fonctionnelles a` l’Hypoxie, Universite´ Paris 13, UFR SMBH, 74 rue Marcel Cachin, 93017 Bobigny, France, fax þ 33 1 48 38 88 64, email [email protected]
Abbreviations:AUC, area under the curve; BHB, b-hydroxybutyrate; ETO, etomoxir; HCA, (2 )-hydroxycitrate; IMI, inter-meal interval; PLA, placebo.
qThe Authors 2008
British
Journal
of
When given to normal-weight subjects before a high-fat breakfast, ETO (150 mg) enhanced hunger feelings and increased energy intake(12). For its part, under various experi-mental conditions, and in different populations, HCA did not affect satiety in all but one study(13).
Therefore, we here specifically examined whether ETO or HCA affect satiety in man and alter metabolism in a way that is consistent with their presumed metabolic mechanisms of action. To do so, we modelled a spontaneous IMI according to a previously described method(14)and continuously recorded eating behaviour and various blood parameters related to fat metabolism or food intake, including the hormones ghrelin and leptin.
Experimental methods Subjects
Male subjects (20 – 30 years old) were recruited through adver-tisements posted at ETH Zurich. Smokers, trained athletes and subjects who had food allergies or aversions to the foods pro-vided during the experiment were excluded. Other exclusion criteria were any personal or family history of diabetes or other metabolic disease, use of medication or a change in body weight . 1 kg during the previous year. Moreover, we included only subjects who were not restrained or disinhibited and who did not experience strong hunger feelings between meals. To verify this criterion, subjects completed the FEV questionnaire, the German version of the Three Factor Eating Questionnaire(15) with cut-off scores of 9 and 7 for restrained eating and disinhibition, respectively. Another criterion was to never or very rarely (less than two times per week) eat something between lunch and dinner, and to eat a diet with $ 35 % of energy derived from fat. These two conditions were considered necessary because modulators of fat metabolism do not appear to affect eating at low levels of dietary fat(12)and because fatty acids appear to contribute to satiety only in case of long IMI(16). To verify these two criteria, a 5 d food diary and a FFQ were completed by the subjects and were analysed with the EBISpro software (Dr J. Erhardt, University of Hohenheim, 2002). Twelve sub-jects were initially selected, but one decided on short notice not to participate and another one was excluded because he experienced a severe vagal malaise when the intravenous catheter was introduced on the first day. Two other subjects completed only two of the three conditions and were therefore excluded from final analyses. Characteristics of the remaining eight subjects who completed all three treatments and whose data were analysed are shown in Table 1. Fat mass was esti-mated by bioelectrical impedance analysis using a body fat scale (BF 555; Tanita Corp., Tokyo, Japan) after an overnight fast and with the bladder voided. Subjects gave their written informed consent and were financially compensated for com-pleting the study. The procedure was approved by the Ethics Committee of the Swiss Federal Institute of Technology Zurich (ETH Zurich).
Study design
A single-blind within-subject design was used, with each sub-ject participating on three test days for placebo (PLA), ETO
and HCA separated by 1 week. In each subject we determined: (1) the temporal pattern of hunger ratings from lunch until the spontaneous dinner request, (2) the time between the end of lunch and the dinner request, (3) the amount of food eaten during the ad libitum dinner, and (4) the temporal pattern of the plasma glucose, NEFA, b-hydroxybutyrate (BHB), lactate, TAG, insulin, leptin and ghrelin concentrations from 30 min before lunch to the dinner request.
Pharmacological agents
Timing of administration and doses of agents were chosen according to their kinetic profiles, their optimal bioavailability and the doses used in previous studies. Thus, the ETO dose was in the range of doses showing an effect on fatty acid oxidation and hunger in previous studies. For example, hunger and RQ were increased 200 min after only a single 150 mg dose in Kahler et al.(12). An ETO dose of 600 mg given over 36 h has also been shown to increase RQ in healthy subjects(17), whereas 100 mg given daily decreased fatty acid oxidation in subjects with type 2 diabetes(18). For HCA, we chose the highest dose that was provided in 12 h in previous studies, i.e. 2 g(19 – 21). Although the bioavailability of oral HCA is low, the plasma concentration achieved in human subjects after oral administration of 2 g HCA has been found to be higher than after the administration of an HCA dose in rats that had clear effects on fat metabolism (0·022 mmol/kg v. 0·017 mmol/kg)(22,23). Subjects received ETO (Dr. Horst P.O. Wolf GmbH, Allensbach, Germany), HCA (CitrinR 500; Power Health Products Ltd, York, UK) or PLA at three time-points, i.e. just before breakfast, 10 min before and 240 min after lunch. The ETO treatment consisted of PLA before breakfast and 160 mg ETO before and after lunch (320 mg ETO in total). The HCA treatment consisted of 500 mg HCA before breakfast and 750 mg HCA before and after lunch (2 g in total). In the PLA condition, placebo was given on all three occasions. Substances were taken with a glass of water, facing the experimenter.
Foods
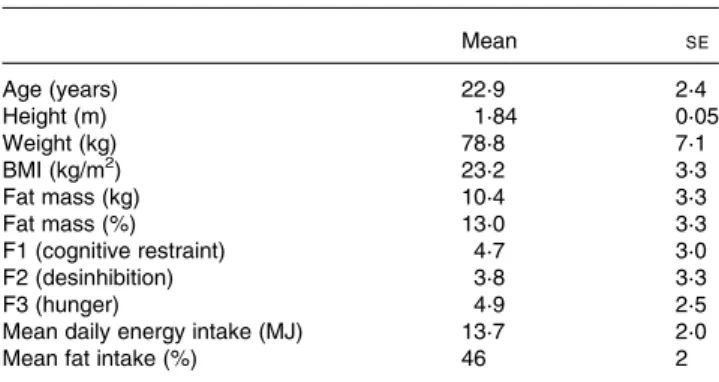
For breakfast, a choice of food items based on those usually consumed by the subjects for breakfast was provided. Table 1. Subject characteristics (n 8)
(mean values with their standard errors)
Mean SE Age (years) 22·9 2·4 Height (m) 1·84 0·05 Weight (kg) 78·8 7·1 BMI (kg/m2) 23·2 3·3 Fat mass (kg) 10·4 3·3 Fat mass (%) 13·0 3·3 F1 (cognitive restraint) 4·7 3·0 F2 (desinhibition) 3·8 3·3 F3 (hunger) 4·9 2·5
Mean daily energy intake (MJ) 13·7 2·0
Mean fat intake (%) 46 2
F1 – F3, factors 1 – 3 of the FEV questionnaire, German version of the Three Factor Eating Questionnaire(15).
British
Journal
of
The amount was free in the first session. This breakfast was identical in the two further sessions.
Based on our previous studies showing that manipulations mainly affect consumption of the first item of a meal, especially if this is the main dish(24), lunch and dinner com-prised only two items each. Lunch consisted of lasagna bolog-naise (5·1 kJ/g, 17 % protein, 37 % fat, 46 % carbohydrate, 1 kg served at the first session) and chocolate cake ‘black forest’ (5·8 kJ/g, 14 % protein, 39 % fat, 47 % carbohydrate, 350 g served at the first session). As for breakfast, lunch was consumed ad libitum in the first session, and the energy intake was then determined and fixed for the subsequent sessions. Dinner consisted of rice, chicken and curry (4·8 kJ/g, 20 % protein, 35 % fat, 45 % carbohydrate, 900 g served) and chocolate-flavoured dessert cream (5·4 kJ/g, 12 % protein, 18 % fat, 70 % carbohydrate, 500 g served). All dinner items were served in large dishes. All food items served at lunch and dinner were rated highly palatable by each subject in a prior test using hedonic scales. Water was provided ad libitum, but water consumption was not measured. No other beverage was served or allowed.
Subjective ratings of satiety
Motivation to eat was assessed using 100 mm visual analogue scales for hunger, desire to eat and gastric fullness, each anchored with ‘not at all’ and ‘extremely’ at the left and right ends, respectively. The scales were rated every 30 min from before lunch until after dinner, but some ratings were randomly interspersed to prevent them from providing any time cue to the subjects.
Blood sampling and plasma assays
Blood samples were obtained as previously described, with a specially designed double-lumen catheter (MTB Medizintech-nik, Amstetten, Germany)(25). Briefly, this system fits into an 18-gauge indwelling cannula inserted into an antecubital vein, and blood is continuously withdrawn throughout the session, at a flow rate of 300 ml/min via a peristaltic pump. Blood is heparinized (7 IU/ml) without any back-infusion of heparin into the vein. The dilution is accounted for when cal-culating final concentration of the variables. Blood samples were collected automatically in a machine programmed to change tubes every 10 min. It takes about 10 min for the blood to flow from the vein to the sample tube. This lag time is accounted for in the data analysis. Blood samples
were immediately centrifuged (3400 g, 15 min, 88C), and the plasma was aliquoted into Eppendorf tubes and stored at 2 808C for further analyses.
Glucose, lactate, NEFA, TAG and BHB were determined by standard colorimetric and enzymatic methods adapted for the Cobas Mira autoanalyser (Hoffman la Roche, Basel, Switzerland). Insulin was determined by RIA using the SB-INSI-5 kit (CEA, Gif-sur-Yvette, France; 7 % accuracy) with a sensitivity of 2 mU/ml. Plasma total ghrelin and leptin were determined by RIA using the commercial Sensitive Human Leptin kit and the Human Ghrelin kit (Linco Research, St Charles, MO, USA). Mean intra- and inter-assay CV were 3·5 and 5·3 % for leptin and 5·9 and 10·3 % for ghrelin.
Procedure
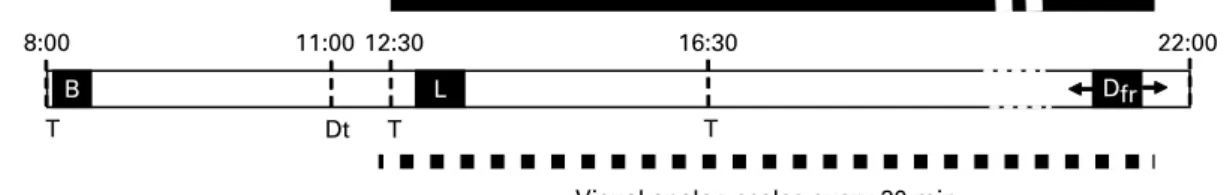
Figure 1 shows the daily schedule for each subject. Three sub-jects were studied on each day. They were asked to arrive at the laboratory at 08.00 hours after an overnight fast. They were then served a breakfast of items corresponding to their usual breakfast as indicated by the 5 d food diary. At 11.00 hours, subjects were confined to individual quiet rooms with-out windows. They were seated in comfortable armchairs and deprived of time cues by exposing them to artificial light, and by removing all potential sources of visual and auditory time references such as watches, computers or radios. Between 12.30 and 13.00 hours, but for each subject at the same time for all conditions, a catheter was inserted into an antecubital vein for blood sampling. Lunch was served 30 min after the onset of blood sampling. Meal duration was not fixed but measured. Subjects were instructed to spontaneously ask for dinner as soon as they felt hungry and certainly not to delay their request in order to not bother experimenters. When a subject requested dinner, he was asked to guess the current time. The catheter was then withdrawn and the subject was served dinner. A microwave oven was used to quickly heat the main dish of the dinner and to serve it only minutes after the request. Before and after consumption, food plates were accurately and covertly weighed to determine actual intakes. Independent of the time of dinner requests, subjects were not allowed to leave the laboratory before 22.00 hours, to avoid any premature dinner request.
Statistical analysis
Unless otherwise indicated, all results are presented as means and standard errors of the eight subjects who completed all
Fig. 1. Schedule of experimental proceedings for a subject. Breakfast (B) was based on items usually consumed by the subjects. Amount eaten was free in the first session, but was identical in the two subsequent sessions. Continuous blood collection began between 12.30 and 13.00 hours across subjects, but exactly at the same time across treatments. Lunch (L) was served 30 min after the catheter was inserted. Treatment (T; placebo, etomoxir or hydroxycitrate) was taken at 8.00, 11.00 and 16.30 hours. Visual analog scales for hunger, desire to eat and gastric fullness were rated every 30 min with some ratings randomly interspersed to obscure any time cues. The dinner had to be freely requested by subjects (Dfr). Dt, deprivation of time cues.
British
Journal
of
three treatments. Statistical analyses were performed using Systat software version 10.2 (SPSS Inc., Chicago, IL, USA).
The biological parameters were subjected to a stepwise analysis for serial measurements according to the recommen-dation of Matthews et al.(26). Thus, for each blood parameter, four variables of interest were determined: (1) a post-lunch profile from the start of lunch to the time the first dinner was requested across all subjects and all conditions, i.e. the minimum time prior to any dinner request, which occurred at 260 min; (2) a pre-dinner profile starting 60 min prior to dinner request; (3) an area under the curve (AUC) calculated by the trapezoidal method for the time from lunch onset to the first dinner request of each subject separately across all con-ditions; (4) a mean plasma concentration over the whole IMI. The first variable allowed the kinetics of the plasma par-ameters to be studied during a fixed time period including all subjects and conditions. The second variable focused on the important period preceding a meal, where major metabolic changes may occur. In subjects who requested their dinner less than 320 min after lunch in a session (four from twenty-four), the post-lunch and the pre-dinner profiles shortly over-lapped. The third variable estimated the maximum difference that could be calculated taking into account all three con-ditions for each subject. The fourth variable provided one value of the concentrations of each parameter during the whole IMI.
Satiety scores were analysed using the same method as for the first and second (post-lunch profile and AUC) variables of the plasma parameters.
Post-lunch and pre-dinner profiles were analysed by two-way ANOVA for repeated measures with conditions and time as within-subject factors. The level of significance was fixed at P, 0·05. For significant interactions between con-ditions and time, subsequent comparisons of means were ana-lysed by Scheffe’s contrasts. AUC and mean concentrations were compared between conditions by Student’s t test adjusted for multiple comparisons by the Holm’s procedure(27).
Relationships between plasma parameters and behavioural data were calculated using Pearson correlations. Predictive equations were fitted by multivariate linear regressions using a backward stepping procedure with a level of 0·1 required for a factor to be included. Predictive equations were modelled for three behavioural variables: (1) the difference of IMI dura-tion between treatments (ETO, HCA and PLA), (2) total energy intake at dinner and (3) energy derived from the first item of the dinner meal. For the first variable, tested predictive factors were mean plasma concentrations of each plasma parameter and treatments, whereas for the second and third variables the predictive factors tested were plasma concen-trations at dinner request and treatments.
Results
Consistent with the assumption that the time-blinding was effective, there was a significant difference between the real and the guessed clock time for all three treatments (22·5 (SE 10·6), 55·7 (SE 33·5) and 80·7 (SE 22·9) min for PLA,
ETO and HCA, respectively, all P, 0·05). Subjects reported no side-effects during any session.
Satiety
Mean energy intake at the free-choice breakfast as determined in the first session was 3877 (SE393) kJ and mean proportions of macronutrients consumed were 12 (SE 1) % protein, 25
(SE 2) % fat and 63 (SE 1) % carbohydrate. Mean energy intake at the two-item lunch was 4505 (SE 178) kJ and
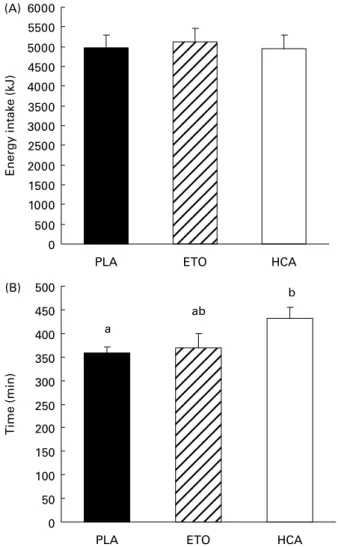
con-sisted of 14, 38 and 47 % protein, fat and carbohydrate, respectively. At dinner, energy intake was not significantly different between treatments (Fig. 2(A)). The time between the end of lunch and the dinner request was longer after HCA than after PLA (þ 73 (SE 23) min, P, 0·05) but not
between PLA and ETO (Fig. 2(B)). Mean hedonic scores for lunch items were high and not different between treatments (79 (SE 3), 79 (SE 3) and 81 (SE 4) mm for PLA, ETO and HCA, respectively).
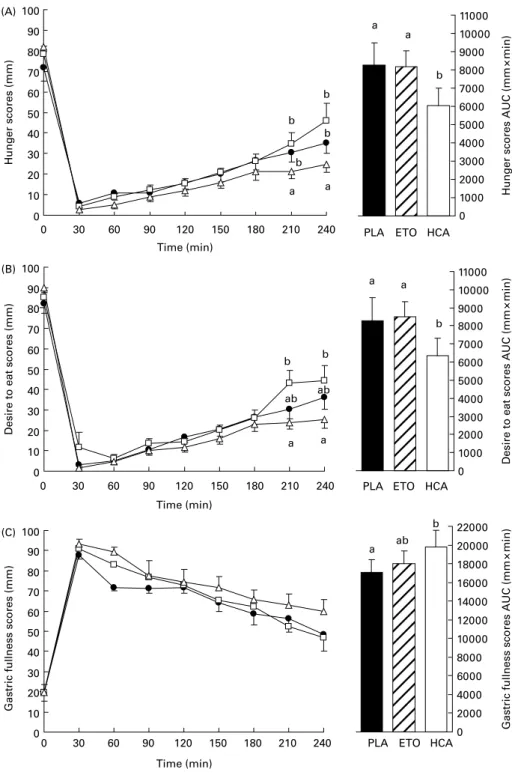
Prior to lunch, hunger and gastric fullness scores were not different among treatments (Fig. 3). Post-lunch hunger profiles until 240 min showed an interaction between time and treat-ment (P¼ 0·01), with hunger scores at 210 and 240 min being lower with HCA than with PLA and ETO treatments (all P, 0·05). A treatment effect was found for post-lunch
Fig. 2. Energy intake at dinner (A) and mean delay between lunch and spon-taneous dinner request (B) after placebo (PLA), etomoxir (ETO) or hydroxyci-trate (HCA). Values are means with their standard errors depicted by vertical bars.a,bMean values with unlike superscript letters were significantly
differ-ent (P, 0·05).
British
Journal
of
desire to eat profile until 240 min (P, 0·05) and the interaction between time and treatment approached significance (P¼ 0·07). Comparisons showed that at 210 and 240 min, desire to eat scores were lower with HCA than with ETO (both P, 0·05). No treatment effect was found for post-lunch gastric fullness profiles.
Hunger and desire to eat AUC were smaller with HCA than with PLA and ETO treatments (all P, 0·05). Gastric fullness
AUC was larger with HCA than with PLA treatment (P, 0·05), but the difference failed to reach significance with ETO.
Plasma parameters
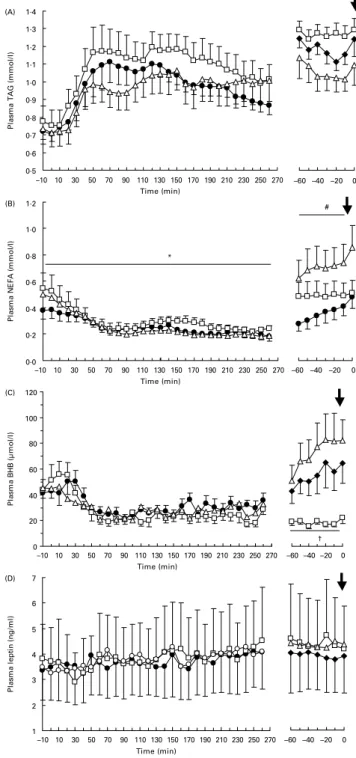
Figs. 4 and 5 show post-lunch and pre-dinner profiles of all plasma parameters. After lunch, treatment only affected
Fig. 3. Time course (left panel) and area under the curve (AUC, right panel) of hunger (A), desire to eat (B) and gastric fullness scores (C) on visual analogue scales between lunch and 240 min, i.e. the delay of the first dinner request across subjects and across conditions (X, placebo (PLA); A, etomoxir (ETO); K, hydro-xycitrate (HCA)). Values are means with their standard errors depicted by vertical bars.a,bMean values with unlike superscript letters were significantly different
(P, 0·05).
British
Journal
of
plasma NEFA (P, 0·05), without a treatment £ time inter-action. Post-lunch plasma NEFA concentrations were higher with ETO than with HCA (P, 0·05), but the difference failed to reach significance between ETO and PLA (P¼ 0·07). In the pre-dinner period, treatment affected plasma lactate (P, 0·05), NEFA (P, 0·05) and BHB (P, 0·005) profiles without an interaction with time. With HCA treatment, pre-dinner concentrations of plasma lactate were lower than with PLA (P, 0·05) and ETO (P, 0·05), whereas NEFA
concentrations were higher than with PLA (P, 0·05). The difference in the pre-dinner profile of NEFA between HCA and ETO treatments just failed to reach significance (P¼ 0·07). The pre-dinner concentrations of BHB were lower with ETO than with PLA (P, 0·05) and HCA treat-ments (P, 0·01).
Fig. 4. Postprandial (left panel) and pre-dinner (right panel) plasma glucose (A), insulin (B), lactate (C) and ghrelin (D) concentrations during the interval between lunch and spontaneously requested dinner ( ) (X, placebo (PLA); A, etomoxir (ETO); K, hydroxycitrate (HCA)). Values are means with their standard errors depicted by vertical bars. HCA mean values were signifi-cantly different from those of PLA and ETO: *P, 0·05.
Fig. 5. Postprandial (left panel) and pre-dinner (right panel) plasma TAG (A), NEFA (B), b-hydroxybutyrate (BHB; C) and leptin (D) concentrations during the interval between lunch and spontaneously requested dinner ( ) (X, placebo (PLA); A, etomoxir (ETO); K, hydroxycitrate (HCA)). Values are means with their standard errors depicted by vertical bars. HCA mean values were significantly different from those of ETO, *P, 0·05. HCA mean values were significantly different from those of PLA, #P, 0·05. ETO mean values were significantly different from those of HCA and PLA, †P, 0·05.
British
Journal
of
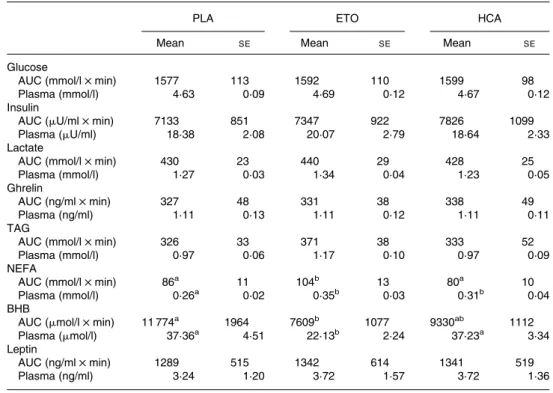
AUC and mean IMI concentrations are shown in Table 2. ETO increased the AUC for plasma NEFA compared to PLA (P, 0·01) or HCA treatment (P, 0·005) and reduced the AUC for BHB compared to PLA (P, 0·05). Mean plasma NEFA concentrations were higher with HCA and ETO treatment than with PLA (P, 0·05 and P, 0·01, respect-ively), and mean BHB concentrations were lower with ETO than with PLA and HCA treatments (both P, 0·05).
Correlations between satiety and plasma parameters
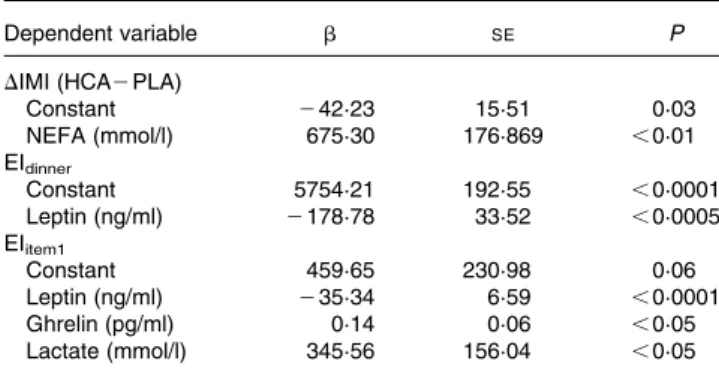
Among plasma parameters, the difference in mean NEFA con-centrations between HCA and PLA treatments was the only one correlated with treatment differences in IMI duration (r 0·84, P, 0·01). The difference in mean plasma NEFA concentrations was also the only predictive factor for the difference in IMI duration between HCA and PLA (r20·71, P, 0·01) (Table 3).
When all treatments were pooled, plasma leptin concen-tration at dinner request was highly correlated with energy intake at dinner (r 2 0·75, P, 0·0005). When treatments were analysed separately, the correlation was significant with HCA (r 2 0·79, P, 0·05) and ETO treatments (r 2 0·91, P, 0·005), but failed to reach significance with PLA (r 2 0·63, P¼ 0·07). Furthermore, a correlation between plasma glucose concentrations and energy intake at dinner was found (r 2 0·55, P¼ 0·005). Both leptin and glucose were only corre-lated with intake of the first meal item (r 2 0·75, P, 0·0005 for leptin; r 2 0·67, P, 0·0005 for glucose) and not with des-sert. The best fitting model for predicting energy intake at
dinner from plasma parameters at meal request only included leptin with a negative coefficient (r2 0·56, P, 0·00005) (Table 3). When only the first item of the dinner was considered, the best fitting model included leptin, ghrelin and lactate, the latter two with a positive coefficient (r20·67, P, 0·00005).
Discussion
The aim of the present study was to investigate the role of NEFA in satiety by administering to young and healthy male subjects two modulators of NEFA metabolism, ETO and HCA, which were expected to decrease and increase sati-ety, respectively. The present results confirmed only the latter prediction, i.e. HCA increased the subjective post-lunch sati-ety scores and the mean duration of satisati-ety until the dinner request in our group of subjects by more than 70 min, although energy intake at dinner was unaffected. This increased delay is unlikely to be caused by nausea or other digestive malaise. Because of the continuous blood withdrawal, we regularly asked subjects if they experienced any abnormal sensation or manifestation, but they reported none. The fact that their energy intake at dinner was not different among HCA, PLA and ETO conditions also argues for the absence of any diges-tive malaise.
The satiety-enhancing effect of HCA did not appear to be mediated by a change in food palatability because no differ-ences in hedonic scores were found. This is consistent with findings in rats, in which HCA did not induce a conditioned taste aversion to saccharin(28). The fact that the length of
Table 2. Area under the curve (AUC) and plasma concentrations of hormones and metabolites* (Mean values with their standard errors)
PLA ETO HCA
Mean SE Mean SE Mean SE
Glucose
AUC (mmol/l £ min) 1577 113 1592 110 1599 98
Plasma (mmol/l) 4·63 0·09 4·69 0·12 4·67 0·12
Insulin
AUC (mU/ml £ min) 7133 851 7347 922 7826 1099
Plasma (mU/ml) 18·38 2·08 20·07 2·79 18·64 2·33
Lactate
AUC (mmol/l £ min) 430 23 440 29 428 25
Plasma (mmol/l) 1·27 0·03 1·34 0·04 1·23 0·05
Ghrelin
AUC (ng/ml £ min) 327 48 331 38 338 49
Plasma (ng/ml) 1·11 0·13 1·11 0·12 1·11 0·11
TAG
AUC (mmol/l £ min) 326 33 371 38 333 52
Plasma (mmol/l) 0·97 0·06 1·17 0·10 0·97 0·09
NEFA
AUC (mmol/l £ min) 86a 11 104b 13 80a 10
Plasma (mmol/l) 0·26a 0·02 0·35b 0·03 0·31b 0·04
BHB
AUC (mmol/l £ min) 11 774a 1964 7609b 1077 9330ab 1112
Plasma (mmol/l) 37·36a 4·51 22·13b 2·24 37·23a 3·34
Leptin
AUC (ng/ml £ min) 1289 515 1342 614 1341 519
Plasma (ng/ml) 3·24 1·20 3·72 1·57 3·72 1·36
BHB, b-hydroxybutyrate; ETO, etomoxir; HCA, (2 )-hydroxycitrate; PLA, placebo.
a,bMean values within a row with unlike superscript letters were significantly different (P, 0·05). * For details of subjects and procedures, see Experimental methods.
British
Journal
of
satiety was sensitive to HCA and that subjects could not guess the real time at debriefing argues for the effectiveness of the time blinding. Thus, in young male subjects in energy equili-brium and on a naturalistic diet pattern, acute HCA adminis-tration was effective in prolonging satiety. In previous studies under varying conditions, we and others have repeat-edly found that when meals can be freely requested, subjects adapt to experimental conditions primarily by varying the IMI rather than meal size(29 – 32). This is in agreement with results obtained in rats(33). Moreover, the conceptual basis of the present study was the putative role of NEFA as an additional source of energy for the metabolic flux during the IMI, thus prolonging satiety and delaying hunger(30). Meal onset presumably results from the interaction of metabolic, neuroendocrine and sensory factors. This of course limits the relevance of the present results for everyday life, where times of meals are often fixed by environmental factors.
The observed changes in plasma parameters did not provide a clear explanation for the effect of HCA on satiety. The increases in circulating NEFA and BHB (approaching signifi-cance) during the pre-dinner period are consistent with an increase in NEFA oxidation by HCA, possibly through an increased release of NEFA from adipose tissue and their sub-sequent oxidation. However, substrate oxidation was not directly measured, which would be necessary to confirm such an assumption. Some recent data in fact suggest an enhancing effect of HCA on lipolysis in human adipocytes(34), but the existence of such an effect in naturalistic conditions in vivo needs to be demonstrated. On the other hand, plasma BHB and NEFA concentrations suggest that ETO inhibited NEFA oxidation, but did not stimulate eating, showing that an inhibition of NEFA oxidation does not always translate into a stimulation of eating, providing a contrasted picture of the relation between NEFA oxidation and satiety.
A crude interpretation of the present results would be that with HCA a longer period with low glucose and high fat util-ization is tolerated before eating is initiated. HCA has been reported to decrease cumulative energy intake in animal
studies, mainly in conditions of enhanced fat synthesis, such as in animals fed a high carbohydrate diet(35,36), or while re-feeding after fasting and body weight loss(37 – 40). In man, HCA doses (1·5 – 3 g) similar to the one we used were tested under a variety of conditions (subjects with overweight or obesity, in positive energy balance, or with normal weight) and were reported to cause greater weight reduction than con-trol treatments in many(19,20,41)but not all(42)of these studies. However, effects of HCA on eating behaviour or subjective parameters of satiety(13,41 – 44) were scarcely reported, and none of these studies was specifically designed to examine the effects of HCA on satiety in normal-weight subjects eating their regular diet, as in the present experiment. Interest-ingly, in the only study conducted in weight-stable obese sub-jects, a reduction in spontaneous intake was found during an acute experimental session(13).
One possible mechanism of the satiating effect of HCA is an indirect stimulation of fatty acid oxidation, in particular in the liver. Hepatic fatty acid oxidation has been proposed to trigger a vagally mediated satiety signal(6). However, we have previously shown that subdiaphragmatical vagal deentation, a surgical procedure that eliminates all vagal affer-ents, did not prevent HCA from reducing food intake in rats(39), suggesting that other mechanisms are involved. HCA has also been shown to promote whole-body fat oxi-dation and to spare glucose utilization in mice(45), although this could not be demonstrated in man(43,44,46,47), except in conditions of forced de novo lipogenesis such as prolonged passive overfeeding with a high-carbohydrate diet(48), or during endurance exercise(49 – 51). While we did not measure whole-body substrate oxidation in the present study, there was some evidence of an indirect stimulation of hepatic NEFA oxidation by HCA. Thus, BHB tracked circulating NEFA and tended to be higher, and lactate was lower after HCA than after PLA throughout the pre-dinner period. This suggests that after HCA administration subjects requested dinner in a metabolic state characterized by a higher rate of NEFA oxidation and lower rate of glycolysis according to the glucose – fatty acid cycle(52). However, an alternative explanation is that this metabolic profile only reflects the longer duration of satiety after HCA, with plasma concen-trations and oxidation of NEFA increasing substantially in the late part of long IMI(14,16,29,30).
The main limitation of the present study is the absence of direct measurement of substrate oxidation. It is quite delicate to assess spontaneous IMI when it is regularly interrupted by gas-exchange measurements and a respiratory chamber would be required to examine if, in the present condition, HCA actu-ally increased whole-body NEFA oxidation. All interpret-ations concerning fat oxidation are therefore primarily based on plasma BHB and NEFA concentrations and must be taken with caution until substrate oxidation during the IMI is assessed.
We did not observe an effect of HCA on plasma leptin con-centrations between lunch and dinner. The reported findings in man of a decrease in circulating leptin or adipose tissue leptin expression in response to HCA presumably reflect an indirect effect related to a decrease in fat mass by HCA rather than a direct effect on leptin production(19 – 21). As we have shown, even small variations in fat mass can be associated with a sus-tained decrease in circulating leptin(53). In the present study, Table 3. Regression models for behavioural variables*
Dependent variable b SE P
DIMI (HCA2 PLA)
Constant 242·23 15·51 0·03 NEFA (mmol/l) 675·30 176·869 ,0·01 EIdinner Constant 5754·21 192·55 ,0·0001 Leptin (ng/ml) 2178·78 33·52 ,0·0005 EIitem1 Constant 459·65 230·98 0·06 Leptin (ng/ml) 235·34 6·59 ,0·0001 Ghrelin (pg/ml) 0·14 0·06 ,0·05 Lactate (mmol/l) 345·56 156·04 ,0·05
b, standard regression coefficient; HCA, (2 )-hydroxycitrate; IMI, inter-meal interval; PLA, placebo.
* Tested behavioural variables were the difference in IMI between HCA and PLA conditions (DIMI), total energy intake at dinner (Eidinner) and energy intake derived from the main dish of the dinner meal presented as first item (EIitem1). Predictive variables were plasma glucose, insulin, lactate, ghrelin, TAG, NEFA, b-hydroxybutyrate and leptin concentrations (mean concentrations and concen-trations at dinner onset for DIMI and energy intake, respectively), and treatments (PLA, etomoxir, HCA). These equations were the best fitting model for each dependent variable. The r2and significance of each equation are indicated in the Results. P significant at , 0·1.
British
Journal
of
leptin was again a potent negative predictor of energy intake in the spontaneous requested meal. We repeatedly reported this relation when subjects were allowed to decide on the timing of meals and on the amount they ate(14,16). That this relation is strongest when the first and main item of the meal is considered is also a constant finding in our studies. Interestingly, when the first meal item was used for the mod-elling, ghrelin became also a significant predictor of intake with a positive coefficient. To our knowledge, a possible effect of HCA on ghrelin had not been explored yet. Ghrelin has been implicated in meal initiation in man because its administration increases food intake(54) and because its plasma concentration increases before fixed(55) or spon-taneously requested(56) meals. Here, ghrelin increased before dinner request to similar concentrations with all treatments.
HCA might also affect satiety by reducing the rate of post-prandial intestinal glucose absorption(57). This would prolong glucose delivery from the intestine and, hence, delay a glucopae-nia-related meal initiation signal. However, no differences in postprandial blood glucose appearance were found in the present study, although the frequent blood sampling was appropriate to observe small kinetic differences. Also, postprandial peaks of circulating glucose were reached at approximately 45 min after lunch with all treatments, which corresponds to our previous findings with this blood-sampling method(58).
Finally, HCA has been shown to reduce serotonin reuptake in brain, thus increasing serotonin availability and action(59), to up-regulate genes encoding serotonin receptors(60) and to substantially increase circulating serotonin concentrations(20). Although all these effects were demonstrated with a new HCA extract (SX), an increase in serotoninergic neurotrans-mission could be a common property of this compound family, but the present results do not allow us to judge on a possible contribution of serotonin to the observed HCA effects.
Contrary to a previous study conducted in young male sub-jects(12), we failed to show an effect of ETO on eating, and the metabolic effect of ETO was weaker. In the previous study, however, ETO increased food intake only in subjects who were accustomed to high dietary fat intake and when ETO was given before breakfast after consumption of a 65·8 % (energy) fat dinner on the previous evening. When ETO was given after a 60 % fat lunch, it did not increase subsequent intake, which is similar to the present findings. The macronu-trient composition of meals in the present study was chosen to explore the relevance of the role of NEFA and fat metabolism in everyday life rather than extreme dietary conditions. ETO supposedly stimulates eating by inhibiting hepatic NEFA oxi-dation. This mechanism seems not effective or at least of minor importance under normal eating conditions in man.
Although chosen with caution, according to previous studies reporting significant effects of ETO and HCA on eating beha-viour, and considering the kinetics of these two agents, we do not know whether these doses and modalities of adminis-tration were optimal. This applies in particular to ETO for which we did not find an effect.
In conclusion, the present results show for the first time that HCA can enhance the intensity of satiety sensation and delay the spontaneous request of the subsequent meal in normal-weight human subjects during a spontaneous eating pattern. The mechanism of this effect is still uncertain, but could be
somehow related to an increased availability of NEFA for the intermeal metabolism.
Acknowledgements
We deeply thank Jeanine Louis-Sylvestre for her great help during the study, Anthony Moses for the analyses of plasma metabolites, Corinne Marmonier for her assistance in the prep-aration of the study and Nicole Colas-Linhart and Anne Petiet, without whom the insulin and leptin measurements would not have been possible. None of the authors had a financial or per-sonal conflict of interest. B. G. planned the study, managed the subjects, collected and analysed the data and contributed to the writing of the manuscript, C. Z. helped to plan the study and managed the blood samples, M. A. helped to collect the data and provided assistance for material, R. A. analysed the blood samples for insulin, ghrelin and leptin and discussed the manuscript, W. L. helped to design the study and to plan the data collection, supervised the study and co-wrote the manuscript, D. C. designed the study, managed blood withdrawal, helped to collect and analyse the data, and wrote the first draft of the manuscript.
References
1. Hedley AA, Ogden CL, Johnson CL, et al. (2004) Prevalence of overweight and obesity among US children, adolescents, and adults, 1999 – 2002. JAMA 291, 2847 – 2850.
2. Seidell JC (2002) Prevalence and time trends of obesity in Europe. J Endocrinol Invest 25, 816 – 822.
3. Flatt JP (1995) Body composition, respiratory quotient, and weight maintenance. Am J Clin Nutr 62, 1107S – 1117S. 4. Louis-Sylvestre J (1999) Glucose utilization dynamics and food
intake. Br J Nutr 82, 427 – 429.
5. Friedman MI & Tordoff MG (1986) Fatty acid oxidation and glucose utilization interact to control food intake in rats. Am J Physiol 251, R840 – R845.
6. Langhans W & Scharrer E (1987) Role of fatty acid oxidation in control of meal pattern. Behav Neural Biol 47, 7 – 16. 7. Ji H & Friedman MI (2007) Reduced capacity for fatty acid
oxidation in rats with inherited susceptibility to diet-induced obesity. Metabolism 56, 1124 – 1130.
8. Zurlo F, Lillioja S, Esposito-Del Puente A, et al. (1990) Low ratio of fat to carbohydrate oxidation as predictor of weight gain: study of 24-h RQ. Am J Physiol 259, E650 – E657. 9. Brandt K, Arnold M, Geary N, et al. (2007) Vagal afferents
mediate the feeding response to mercaptoacetate but not to the beta (3) adrenergic receptor agonist CL 316,243. Neurosci Lett 411, 104 – 107.
10. Sullivan AC, Singh M, Srere PA, et al. (1977) Reactivity and inhibitor potential of hydroxycitrate isomers with citrate synthase, citrate lyase, and ATP citrate lyase. J Biol Chem 252, 7583 – 7590.
11. McGarry JD & Foster DW (1979) In support of the roles of mal-onyl-CoA and carnitine acyltransferase I in the regulation of hepatic fatty acid oxidation and ketogenesis. J Biol Chem 254, 8163 – 8168.
12. Kahler A, Zimmermann M & Langhans W (1999) Suppression of hepatic fatty acid oxidation and food intake in men. Nutrition 15, 819 – 828.
13. Westerterp-Plantenga MS & Kovacs EM (2002) The effect of (2 )-hydroxycitrate on energy intake and satiety in overweight humans. Int J Obes Relat Metab Disord 26, 870 – 872.
British
Journal
of
14. Chapelot D, Aubert R, Marmonier C, et al. (2000) An endocrine and metabolic definition of the intermeal interval in humans: evidence for a role of leptin on the prandial pattern through fatty acid disposal. Am J Clin Nutr 72, 421 – 431.
15. Pudel V & Westenho¨fer J (1989) Fragebogen zum Essverhalten (FEV). Go¨ttingen: Verlag fu¨r Psychologie.
16. Chapelot D, Marmonier C, Aubert R, et al. (2004) A role for glucose and insulin preprandial profiles to differentiate meals and snacks. Physiol Behav 80, 721 – 731.
17. Hinderling VB, Schrauwen P, Langhans W, et al. (2002) The effect of etomoxir on 24-h substrate oxidation and satiety in humans. Am J Clin Nutr 76, 141 – 147.
18. Hubinger A, Knode O, Susanto F, et al. (1997) Effects of the carnitine-acyltransferase inhibitor etomoxir on insulin sensi-tivity, energy expenditure and substrate oxidation in NIDDM. Horm Metab Res 29, 436 – 439.
19. Preuss HG, Bagchi D, Bagchi M, et al. (2004) Effects of a natu-ral extract of (2 )-hydroxycitric acid (HCA-SX) and a combi-nation of HCA-SX plus niacin-bound chromium and Gymnema sylvestre extract on weight loss. Diabetes Obes Metab 6, 171 – 180.
20. Preuss HG, Garis RI, Bramble JD, et al. (2005) Efficacy of a novel calcium/potassium salt of (2 )-hydroxycitric acid in weight control. Int J Clin Pharmacol Res 25, 133 – 144. 21. Preuss HG, Rao CV, Garis R, et al. (2004) An overview of the
safety and efficacy of a novel, natural (2 )-hydroxycitric acid extract (HCA-SX) for weight management. J Med 35, 33 – 48. 22. Loe YC, Bergeron N, Rodriguez N, et al. (2001) Gas
chroma-tography/mass spectrometry method to quantify blood hydroxy-citrate concentration. Anal Biochem 292, 148 – 154.
23. Sullivan AC, Hamilton JG, Miller ON, et al. (1972) Inhibition of lipogenesis in rat liver by (2 )-hydroxycitrate. Arch Biochem Biophys 150, 183 – 190.
24. Chapelot D, Marmonier C, Thomas F, et al. (2000) Modalities of the food intake-reducing effect of sibutramine in humans. Physiol Behav 68, 299 – 308.
25. Chabert MF, Verger P & Louis-Sylvestre J (1991) A method for long-term and accurate measurement and recording of the blood glucose level in man. Physiol Behav 49, 827 – 830.
26. Matthews JN, Altman DG, Campbell MJ, et al. (1990) Analysis of serial measurements in medical research. Br Med J 300, 230 – 235.
27. Aickin M & Gensler H (1996) Adjusting for multiple testing when reporting research results: the Bonferroni vs Holm methods. Am J Public Health 86, 726 – 728.
28. Panksepp J, Pollack A, Meeker RB, et al. (1977) (2 )-Hydroxy-citrate and conditioned aversions. Pharmacol Biochem Behav 6, 683 – 687.
29. Marmonier C, Chapelot D, Fantino M, et al. (2002) Snacks con-sumed in a nonhungry state have poor satiating efficiency: influ-ence of snack composition on substrate utilization and hunger. Am J Clin Nutr 76, 518 – 528.
30. Himaya A, Fantino M, Antoine JM, et al. (1997) Satiety power of dietary fat: a new appraisal. Am J Clin Nutr 65, 1410 – 1418. 31. Green J, Pollak CP & Smith GP (1987) The effect of desynchro-nization on meal patterns of humans living in time isolation. Physiol Behav 39, 203 – 209.
32. Melanson KJ, Westerterp-Plantenga MS, Campfield LA, et al. (1999) Blood glucose and meal patterns in time-blinded males, after aspartame, carbohydrate, and fat consumption, in relation to sweetness perception. Br J Nutr 82, 437 – 446. 33. Le Magnen J & Devos M (1980) Parameters of the meal pattern
in rats: their assessment and physiological significance. Neuro-sci Biobehav Rev 4, Suppl. 1, 1 – 11.
34. Roy S, Shah H, Rink C, et al. (2007) Transcriptome of primary adi-pocytes from obese women in response to a novel hydroxycitric acid-based dietary supplement. DNA Cell Biol 26, 627 – 639.
35. Greenwood MR, Cleary MP, Gruen R, et al. (1981) Effect of (2 )-hydroxycitrate on development of obesity in the Zucker obese rat. Am J Physiol 240, E72 – E78.
36. Sullivan AC, Triscari J, Hamilton JG, et al. (1974) Effect of (2 )-hydroxycitrate upon the accumulation of lipid in the rat. II. Appetite. Lipids 9, 129 – 134.
37. Leonhardt M, Balkan B & Langhans W (2004) Effect of hydro-xycitrate on respiratory quotient, energy expenditure, and glu-cose tolerance in male rats after a period of restrictive feeding. Nutrition 20, 911 – 915.
38. Leonhardt M, Hrupka B & Langhans W (2001) Effect of hydro-xycitrate on food intake and body weight regain after a period of restrictive feeding in male rats. Physiol Behav 74, 191 – 196. 39. Leonhardt M & Langhans W (2002) Hydroxycitrate has
long-term effects on feeding behavior, body weight regain and metabolism after body weight loss in male rats. J Nutr 132, 1977 – 1982.
40. Leonhardt M, Hrupka BJ & Langhans W (2004) Subdiaphrag-matic vagal deafferentation fails to block the anorectic effect of hydroxycitrate. Physiol Behav 82, 263 – 268.
41. Mattes RD & Bormann L (2000) Effects of (2 )-hydroxycitric acid on appetitive variables. Physiol Behav 71, 87 – 94. 42. Heymsfield SB, Allison DB, Vasselli JR, et al. (1998) Garcinia
cambogia (hydroxycitric acid) as a potential antiobesity agent: a randomized controlled trial. JAMA 280, 1596 – 1600.
43. Kovacs EM, Westerterp-Plantenga MS, de Vries M, et al. (2001) Effects of 2-week ingestion of (2 )-hydroxycitrate and (2 )-hydroxycitrate combined with medium-chain triglycerides on satiety and food intake. Physiol Behav 74, 543 – 549. 44. Kovacs EM, Westerterp-Plantenga MS & Saris WH (2001)
The effects of 2-week ingestion of (2 )-hydroxycitrate and (2 )-hydroxycitrate combined with medium-chain triglycerides on satiety, fat oxidation, energy expenditure and body weight. Int J Obes Relat Metab Disord 25, 1087 – 1094.
45. Ishihara K, Oyaizu S, Onuki K, et al. (2000) Chronic (2 )-hydroxycitrate administration spares carbohydrate utilization and promotes lipid oxidation during exercise in mice. J Nutr 130, 2990 – 2995.
46. Kriketos AD, Thompson HR, Greene H, et al. (1999) (2 )-Hydroxycitric acid does not affect energy expenditure and sub-strate oxidation in adult males in a post-absorptive state. Int J Obes Relat Metab Disord 23, 867 – 873.
47. van Loon LJ, van Rooijen JJ, Niesen B, et al. (2000) Effects of acute (2 )-hydroxycitrate supplementation on substrate metab-olism at rest and during exercise in humans. Am J Clin Nutr 72, 1445 – 1450.
48. Kovacs EM, & Westerterp-Planterga MS (2006) Effects of (2 )-hydroxycitrate on net fat synthesis as de nov. lipogenesis. Physiol Behav 88, 371 – 381.
49. Tomita K, Okuhara Y, Shigematsu N, et al. (2003) (2 )-Hydro-xycitrate ingestion increases fat oxidation during moderate intensity exercise in untrained men. Biosci Biotechnol Biochem 67, 1999 – 2001.
50. Lim K, Ryu S, Nho HS, et al. (2003) (2 )-Hydroxycitric acid ingestion increases fat utilization during exercise in untrained women. J Nutr Sci Vitaminol (Tokyo) 49, 163 – 167.
51. Lim K, Ryu S, Ohishi Y, Watanabe I, et al. (2002) Short-term (2 )-hydroxycitrate ingestion increases fat oxidation during exercise in athletes. J Nutr Sci Vitaminol (Tokyo) 48, 128 – 133. 52. Sugden MC (2007) In appreciation of Sir Philip Randle: the
glucose – fatty acid cycle. Br J Nutr 97, 809 – 813.
53. Chapelot D, Marmonier C, Aubert R, et al. (2006) Consequence of omitting or adding a meal in man on body composition, food intake, and metabolism. Obesity (Silver Spring) 14, 215 – 227. 54. Druce MR, Wren AM, Park AJ, et al. (2005) Ghrelin increases
food intake in obese as well as lean subjects. Int J Obes (Lond) 29, 1130 – 1136.
British
Journal
of
55. Cummings DE, Purnell JQ, Frayo RS, et al. (2001) A prepran-dial rise in plasma ghrelin levels suggests a role in meal initiation in humans. Diabetes 50, 1714 – 1719.
56. Cummings DE, Frayo RS, Marmonier C, et al. (2004) Plasma ghrelin levels and hunger scores in humans initiating meals voluntarily without time- and food-related cues. Am J Physiol Endocrinol Metab 287, E297 – E304.
57. Wielinga PY, Wachters-Hagedoorn RE, Bouter B, et al. (2005) Hydroxycitric acid delays intestinal glucose absorption in rats. Am J Physiol Gastrointest Liver Physiol 288, G1144 – G1149.
58. Chapelot D, Marmonier C & Valensi P (2007) Predicting more accurately the overall glucose response to a lunch meal by using the postprandial glucose peak. Metabolism 56, 37 – 43. 59. Ohia SE, Opere CA, LeDay AM, et al. (2002) Safety and
mech-anism of appetite suppression by a novel hydroxycitric acid extract (HCA-SX). Mol Cell Biochem 238, 89 – 103.
60. Roy S, Rink C, Khanna S, et al. (2004) Body weight and abdominal fat gene expression profile in response to a novel hydroxycitric acid-based dietary supplement. Gene Expr 11, 251 – 262.