Binding Affinity of a Small Molecule
to an Amorphous Polymer in a Solvent
by
Surasak Chunsrivirot
B.S. Chemistry with a Biology Minor B.S. Computer Science and Engineering Massachusetts Institute of Technology, 2006
MASSACHUSETTS INSTIT OF TECHNOLOGY
JUN 1 4 2011
LIBRARIES
SUBMITTED TO THE COMPUTATIONAL AND SYSTEMS BIOLOGY
PROGRAM IN PARTIAL FULFILLMENT OF THE REQUIREMENTS FOR
THE DEGREE OF
ARCHNES
DOCTOR OF PHILOSOPHY
AT THE
MASSACHUSETTS INSTITUTE OF TECHNOLOGY
JUNE 2011
© Massachusetts Institute of Technology 2011. All rights reserved.
Signature of Author:
Certified by:
Computational and Systems Biology Program May 5* , 2011
May 5th 2011 Bernhardt Trout Professor of Chemical Engineering Thesis Supervisor
Accepted by.
iunistopher Burge Associate Professor of Biology Director, Computational and Systems Biology Graduate Program
Binding Affinity of a Small Molecule to
an Amorphous Polymer in a Solvent
by
Surasak Chunsrivirot
Submitted to the Computational and Systems Biology Program on May 1 th, 2011 in Partial Fulfillment of the
Requirements for the Degree of Doctor of Philosophy
ABSTRACT
Crystallization is a commonly used purification process in industrial practice. It usually begins with heterogeneous nucleation on a foreign surface. The complicated mechanism of heterogeneous nucleation is not well understood, but we hypothesize a possible correlation between binding affinity to a surface and nucleation enhancement. Amorphous polymers have been used in controlling crystallization. However, to our knowledge no attempt has been made to investigate the possibility of using binding affinity to help guide the selection of polymers promoting heterogeneous nucleation. This study investigated the possibility of using binding affinity of one molecule and many molecules to help guide the selection of these polymers. To measure the binding affinity of one molecule, we developed a two-step approach to compute the free energy of binding to a binding site, using a system of ethylene glycol, polyvinyl alcohol (PVA), and heavy water (D20). The first step of our approach uses Adsorption Locator to
identify probable binding sites and molecular dynamics to screen for the best binding sites. The second step employs the Blue-Moon Ensemble method to compute the free energy of binding. We then applied our procedure to the systems of aspirin binding on the surfaces of four non-porous crosslinked polymers in ethanol-water 38 v%. These polymers are poly(4-acryloylmorpholine) (PAM), poly(2-carboxyethyl acrylate) (PCEA), poly(4-hydroxylbutyl acrylate) (PHBA), and polystyrene (PS), and they all are crosslinked with divinylbenzene (DVB). We developed an approach to construct these crosslinked polymers and built three independent surfaces for each polymer. We found the similarity between the trend of heterogeneous nucleation activity and that of the average free energies of binding to the best site of each polymer surface. To measure the binding affinity of many molecules, preferential interaction coefficient and the number of aspirin molecules associated with the area of the binding site was calculated. We found that there is also a similarity between the trend of heterogeneous nucleation activity and that of number of aspirin molecules associated with the area of the binding site (taken into account the effects of polar/apolar atom interactions between an aspirin and a polymer). These results suggest the possibility of using binding affinity, especially the free energy of binding to the best site and the number of nucleating molecule, to help guide the selection of polymers promoting heterogeneous nucleation.
Thesis Supervisor: Bernhardt L. Trout Title: Professor of Chemical Engineering
This thesis is dedicated to my mother, belated father and my elder brothers,
who made sacrifices so that I could have the opportunity
to pursue the highest education possible.
This MIT Ph.D. thesis is for you.
Acknowledgements
I would like to thank my thesis supervisor Professor Bernhardt L. Trout for his thoughtful
guidance and research ideas. I am also very thankful to my thesis committee Prof. T. Alan Hatton, Prof. Gregory C. Rutledge, Prof. Collin M. Stultz and Prof. Allan Myerson for their help and useful insights.
I would like to also thank the members of the Trout group. Ying Diao helped and provided me
with the experimental data. Dr. Erik Santiso taught me how to implement the Blue-Moon Ensemble method, helped me with the order parameter analysis, and provided me very useful advice and discussion on my research, career and publications. Diwakar Shukla gave me advice on the calculation of the preferential interaction coefficient. Nick Musolino and Tim Lauer set up and maintained the computer clusters, and helped me when I had technical problems with the clusters. Dr. Jie Chen and Dr. Gregg T. Beckham initially helped me get started with molecular simulations. Dr. Veysel Kayser gave me career advice and words of encouragement throughout my Ph.D. studies. Angelique, Connie and Stephanie helped me with administrative matters. Moreover, I am very grateful for the Computational and Systems Biology Program, the previous/current director and staff such as Prof. Bruce Tidor, Prof. Chris Burge, Darlene Ray and Bonnie Lee Whang. I am also very thankful to the Writing and Communication Center staff, who helped me not only with this thesis, but also with my journal articles, presentations, and thesis proposal through the years. These staff are Amanda, Susan, Thalia, Bob, Rob, Prof. Steve Strang (the director who introduced me to the center), etc.
I am also indebted to the Computational and Systems Biology Fellowship and the Novartis-MIT
Center for Continuous Manufacturing for financial support during my studies.
During my time at MIT, I also benefited from many great friendships and I am very thankful to my friends who are very kind and thoughtful. During my Ph.D. studies, they supported and encouraged me to overcome all the difficult challenges. Listed in alphabetical order, these great friends are as follows. Dr. Ahmet Turan Ozdemir is my old roommate, my friend and my long-lost brother in Kayseri Turkey. He first introduced me to the wonderful culture, people and country of Turkey. When I visited Turkey and attended his wedding, he took a great care of me, hosted me and showed me many cities such as Kayseri, Istanbul and Malatya. Ahmet Kerim Agirman has a great sense of humor. He likes making funny comments on Facebook and during conversions. He often makes funny poses whenever his picture is taken. To surprise me, he came to New York and met me at Times Square to countdown to the year 2011, my last year in America, and endured the coldness with me, while waiting seven hours for the countdown.
Hasan Ilhan is a very funny friend, whom I sometimes call "Yalanci Qoban." Putting his jokes aside, he is one of a very few people who shares similar childhood experience with me. Maybe that is why we get along very well. During my last few months in America, I am glad to have had a chance to spend more time with him since he moved to Boston to continue his Ph.D. Ismail Balci is my best hemgo, who has a great sense of humor as shown in his comments during conversations or on Facebook. Always happy and smiling in spite of the circumstances, he is easily the most positive person I ever met. He also made me feel like I was home with my close friends in Thailand. Often, I spent time playing Monopoly and other games with him and his housemates at his apartment. He is one of the most selfless persons I have ever met. He always
helps other people in need even though at the time he does not have enough time to complete his own work and other responsibilities. Kemal Keskin, a funny guy who is now in Eskigehir, introduced me to Turkish friends and Turkish communities in Boston. While he was in Boston, we did lots of fun activities and shared wonderful memories together. Mahmut Guven has always been a great friend, who operated an unofficial hotel at his house and often invited me to have dinner and stay over. Mehmet Emin OztUrk gave me a crash course in Turkish. Mustafa Gedik helped me write cards to my friends in Turkish. Nattapol Ploymaklam (Tape) is a very thoughtful and supportive friend in Iowa, whom I called very often to share my life experience and obstacles. He has been a great support throughout my Ph.D. studies. Thank you so much for everything Tape. Patricio Ramirez gave me very helpful advice on Ph.D. studies. Ahmet Belli, Gultekin Tasdirek, Mahmut Guven, and Kemal Keskin are great chefs, whom I told to open their own restaurants someday. There are also many other great friends in Boston, whose friendships I will always cherish. I would like to also thank Abdulkadir, Bakir, Ebubakir, Emrah Korkmaz, Hasan Altunbus, Lohith, Melih Ecertas, Mint, Mustafa Bakir, Racip, Sehmug, Ufuk Muncuk, Victor, Yasin Kaymaz, and other friends that I may have forgotten to mention. You all made me feel at home and gave me memorable experiences. I am very grateful for your friendships. I am also very grateful for the Turkish Cultural Center (TCC) and Turkish community in Boston, who welcomed and treated me with warmth and love. I want to especially thank Vaner Kaplan, one of the staff at TCC, for his kindness, generosity, friendship and his helping my friends to settle in America. Moreover, I also want to thank the owner and the friendly staff of Inbound Pizza, who are very kind and welcoming. Inbound Pizza is one of my favorite places in Boston, where I had great conversations and wonderful memories with my friends.
I am also grateful for my friends in Turkey, Thailand, Germany and England. I met lots of
wonderful people, who took a great care of me when I visited Turkey in 2008 and 2009. G6kgen and Umut Ozdemir in Kayseri are great friends, who hosted me and took me to see and enjoy the city of Kayseri. Dr. Mustafa Turkmen, who is currently doing a post-doc in Boston, has been a great friend. I spent a lot of time doing various activities with him and his family in Kayseri and in Boston. Dr. Nurettin Ustkoyuncu, who is currently doing a post-doc in Virginia, is easily one of the kindest and most caring persons I ever met. I spent my last Christmas break in America with him and it was probably my most memorable Christmas. He also makes great coffee and hot chocolate; that is why I called his office in Turkey/his apartment in Virginia Nurettinbucks! Additionally, I want to thank the family of Ahmet Turan, Nurettin, Emrah, and Kemal who were very hospitable, welcoming, kind and loving. They took great care of me as if I were a member of their families, when I visited Turkey. Hopefully, I will have a chance to visit you all in Turkey again.
In Thailand, I am also very fortunate to have many great friends, who are very kind and supportive. I often called them on the weekends to catch up and discuss our lives and our friends' lives. They helped support me and gave me words of encouragement throughout my difficult times. These friends are as follows. Thammanit Hattaya is one of my best friends from junior high school, Kanthalakwittaya School, in my small hometown in Kanthralak, Sisaket, Thailand. Peecha Rattanakowin is one of my best friends from high school (Triam Udom Suksa School, Bangkok). Since he is a doctor, sometimes I even got some medical advice from him when I got sick. Another one of my best friends since high school is Wanlop Atsariyasing. He is one of the most positive people I have ever met, probably why he later became a psychiatrist. I also want to
thank him for praising me for being able to overcome all the challenging obstacles in my Ph.D. and in my life on my own. Another one of my best friends from high school is Attakrit Leckcivilize, who is currently doing his Ph. D. in London. He is selfless, and he always has a very positive look on life. I would like to also thank him for visiting me in Boston. Mrs. Phensophit Mayer, who currently resides in Germany, always supported me and gave me kind words of encouragement during my difficult times. I am also grateful for other friends in
Thailand such as Kerati Prasertphol, Kraisoon Lomjansook, Porwanad Saengsuri, Oranich Navanukroh, Nadya Jai, Chairit Lohakitsathian, Pisit Wanicha, Werawut Pattanaworapong, Khacha Somchai, Chawantat Saard, Apilak Aromseree, Suparat Meekhun, Siriwan Samran, and other friends whom I may have forgotten to mention. Just wait. In a few months, I will go back home and meet you all again.
Finally, none of this would have been possible without the love and support of my parents and my elder brothers. I am very grateful to my mother and my belated father. Due to the financial situations of their families, my belated father did not have an opportunity to go to high school, and my mother did not have a formal education. Despite their limited education and financial resources, they always encouraged me to pursue the highest education possible. My mother always supports and loves me unconditionally. When I find myself in times of trouble or facing difficult challenges, she often says "be strong and be patient and you will overcome all the obstacles." I am also very grateful to my three elder brothers. After the death of my father in a motorcycle accident when I was about eight, they sacrificed their educational opportunities, dropping out of high school to run our small family business, so that I had an opportunity to pursue the highest possible education.
I would like to dedicate this thesis to my mother, belated father and my elder brothers, to whom I
am eternally grateful. This MIT Ph.D. thesis is for you.
Surasak Chunsrivirot April 2011
Contents
I
Introduction ... 251.1 Thesis Objectives ... 26
1.2 Organization... 26
2. Literature review ... 31
2.1 Classical nucleation theory: heterogeneous nucleation ... 31
2.2 Experimental and computational studies of heterogeneous nucleation ... 34
2.3 Construction of polym er structures... 37
2.4 Free energy of binding ... 38
2.5 Preferential interaction coefficient... 41
3. Free Energy of Binding of a Small Molecule to an Amorphous Polymer in a Solvent: M ethodology Developm ent ... 45
3.1 Com putational Details ... 46
3.1.1 Force Field Validation ... 47
3.1.2 Approach to com pute the free energy of binding. ... 50
3.2 Results and Discussions... 56
3.2.1 Generation and identification of reasonable binding site models... 56
3.2.2 Free energy of binding ... 66
3.3 Conclusions... 72
4. Binding Affinity of a Small Molecule to Crosslinked Polymers in a Solvent: Free Energy of Binding to a Binding Site... 75
4.1 Com putational and Experim ental Details ... 76
4.1.1 Force Field Validation ... 76
4.1.2 Approach to com pute the free energy of binding. ... 82
4.1.3. Experim ental Section... 92
4.2 Results and Discussions... 93
4.2.1 Generation and identification of reasonable binding site models... 93
4.2.2 Free energy of binding. ... 105 4.2.3 The trend of the magnitudes of the average free energies of binding to the best binding site s. ...- . . ---... 1 13
4.2.4 Hansen solubility parameters...117
4 .3 C on clu sion s... 1 19 5. Binding Affinity of a Small Molecule to Crosslinked Polymers in a Solvent: Preferential B inding to a Surface... 123
5.1 C om putational D etails ... 124
5.1.1 Crosslinked polymer surfaces... 124
5.1.2 Layer of aspirin in ethanol-water 38 v% mixture. ... 128
5.1.3 Preferential interaction coefficient... 128
5.1.4 Number of aspirin molecules associated with the area of the binding site... 132
5.1.5 Crystalline order of aspirin molecules...133
5.2 R esults and D iscussions... 135
5.2.1 The preferential interaction coefficient... 135
5.2.2 The trend of the average preferential interaction coefficients ... 140
5.2.3 Number of aspirin molecules associated with the area of the binding site... 143
5.2.4 Crystalline order of aspirin molecules... 146
5 .3 C on clu sion s... 149
6 . C on clu sion s... 153
6.1 Free energy of binding of a small molecule to an amorphous polymer in a solvent: m ethodology developm ent... 153
6.2 Binding affinity of a small molecule to crosslinked polymers: free energy of binding to a b in d in g site ... 154
6.3 Binding affinity of a small molecule to crosslinked polymers: preferential binding to a su rface ... 15 4 7. F uture w ork ... 159
7.1 Binding affinity of other active pharmaceutical ingredients (APIs) on non-porous p o lym ers... 15 9 7.2 Binding affinity of APIs to porous polymers... 159
7.3 Faster calculations of binding affinity . ... 160
7.4 Free energy of binding of a crystal layer ... 160
List of Figures
Figure 1-1: Cross-section of a cap-shaped cluster of n molecules (3D HEN) (reproduced from'3 ... 3 2
Figure 1-2: Cross-section of a disk-shaped cluster of n molecules (2D HEN) (reproduced from13).
... 3 2
Figure 3-1: Computed solubility parameter vs the repeating units of PVA. Solubility parameter
curve levels off and varies within a narrow range beyond 50 repeating units... 48
Figure 3-2. A typical setup for free energy of binding calculation. Ethylene glycol and the three dummy atoms are shown in vdW representation. The PVA surface and D20 are shown in line representation. Carbons are shown in grey. Oxygens are shown in red. Hydrogens are shown in white (A) The whole system of ethylene glycol, the PVA surface, D20, and the three dummy atoms. (B) The distance constraints (green) between C2 of ethylene glycol and the three dummy ato m s...5 5 Figure 3-3. Major binding sites on surface A, as identified by Adsorption Locator. Ethylene glycol is shown in stick representation. The PVA surface is shown in surface representation with transparent color. Carbons are shown in green. Oxygens are shown in red. Hydrogens are shown in w h ite ... . . .. 57
Figure 3-4. Major binding sites on surface B, as identified by Adsorption Locator. Ethylene glycol is shown in stick representation. The PVA surface is shown in surface representation with transparent color. Carbons are shown in green. Oxygens are shown in red. Hydrogens are shown in w hite... . . 59
Figure 3-5. Major binding sites on surface C, as identified by Adsorption Locator. Ethylene glycol is shown in stick representation. The PVA surface is shown in surface representation with transparent color. Carbons are shown in green. Oxygens are shown in red. Hydrogens are shown in w hite... . . 60
Figure 3-6. Major binding sites on surface D, as identified by Adsorption Locator. Ethylene glycol is shown in stick representation. The PVA surface is shown in surface representation with transparent color. Carbons are shown in green. Oxygens are shown in red. Hydrogens are shown in w h ite ... . . 62
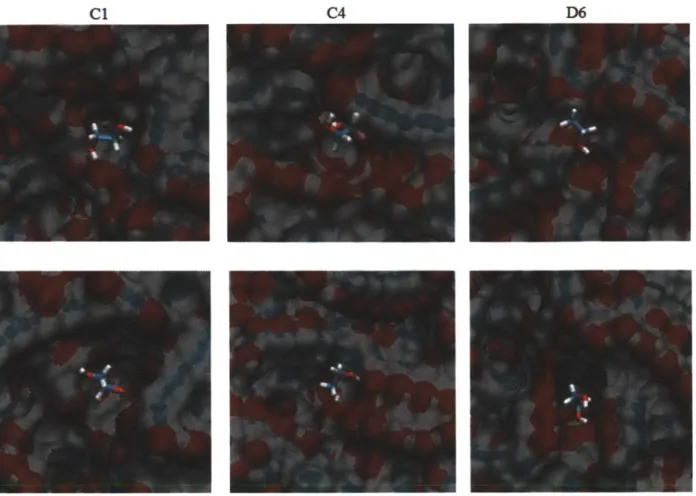
Figure 3-7. Binding sites Cl, C4 and D6 before and after solvent equilibration...65
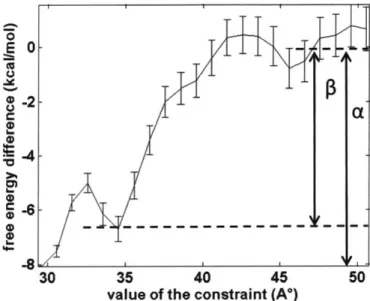
Figure 3-8. Free energy profile of the binding site C1 along the distance constraint...66
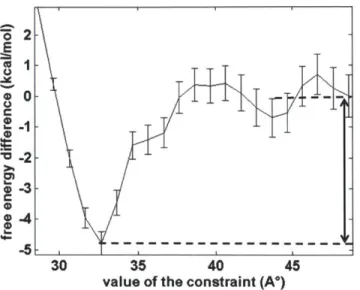
Figure 3-10. Free energy profile of the binding site C4 along the distance constraint...67 Figure 3-11. The binding site C4a (left) and C4p (right). Side view (top) and top view (bottom )... . . .. 68
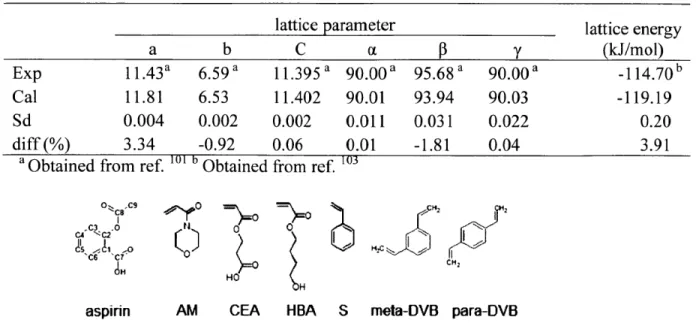
Figure 3-12. Free energy profile of the binding site D6 along the distance constraint...69 Figure 3-13. The binding site D6. Side view (left) and top view (right)...69 Figure 3-14. At the starting constraint value of 28.64 A, the ethylene glycol molecule became stuck inside the socket-liked indentation after solvent equilibration. Ethylene glycol is shown in vdW representation, and PVA is shown in surface representation...70 Figure 4-1. Structure of aspirin, momoner molecules (AM, CEA, HBA, and S) and crosslinker m olecules (m eta-DVB, and para-DVB)... 77
Figure 4-2. Snapshot picture of the non-porous crosslinked PAM generated by our procedure with 6.5 A' cutoff (stick representation). Carbons are shown in grey. Oxygens are shown in red. Hydrogens are shown in white. Nitrogens are shown in blue... 81
Figure 4-3. A typical setup for free energy of binding calculation. Aspirin and the three dummy atoms are shown in vdW representation. The crosslinked polymer surface, ethanol and water are shown in line representation. Carbons are shown in grey. Oxygens are shown in red. Nytrogens are shown in blue. Hydrogens are shown in white (A) The whole system of aspirin, the crosslinked polymer surface, water, ethanol and the three dummy atoms. (B) The distance constraints (green) between C2 of aspirin and the three dummy atoms... 89
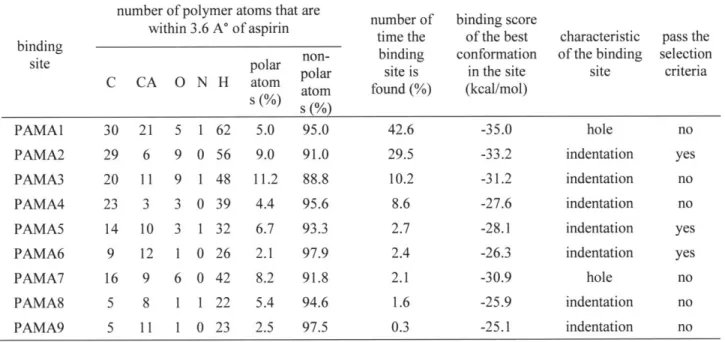
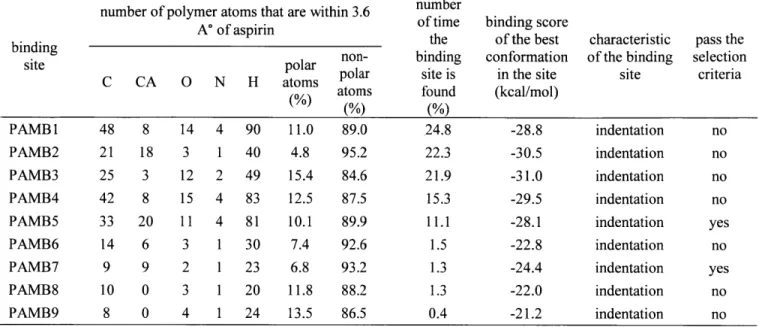
Figure 4-4. Major binding sites on the surfaces PAMA (left), PAMB (middle) and PAMC (right) of PAM, as identified by Adsorption Locator. Aspirin is shown in stick representation. The crosslinked polymer surface is shown in surface representation with transparent color. Carbons are shown in grey. Oxygens are shown in red. Nitrogens are shown in blue. Hydrogens are sh ow n in w h ite... 9 5
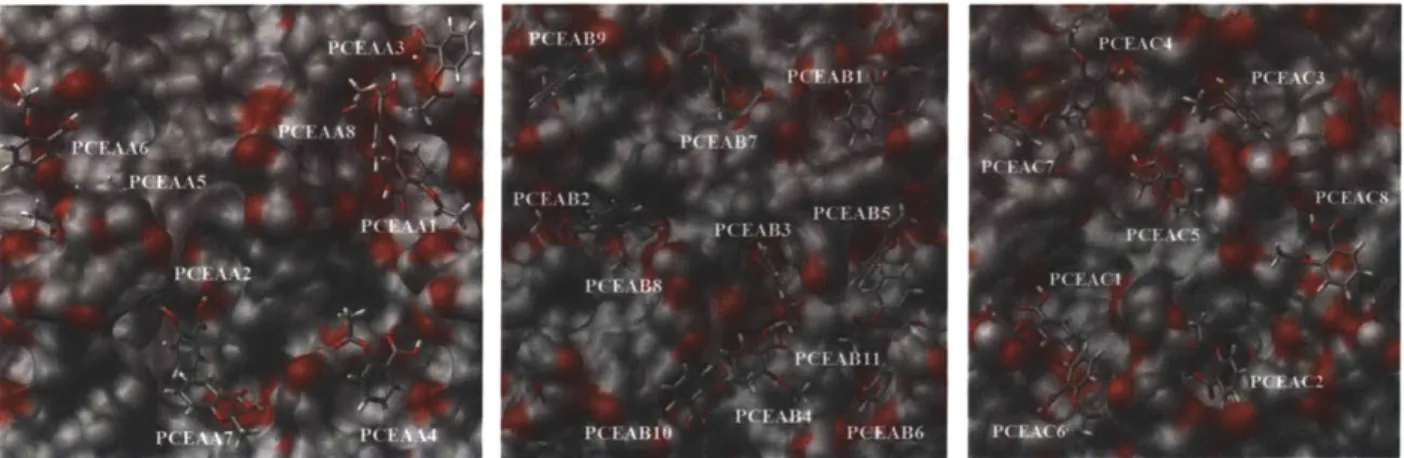
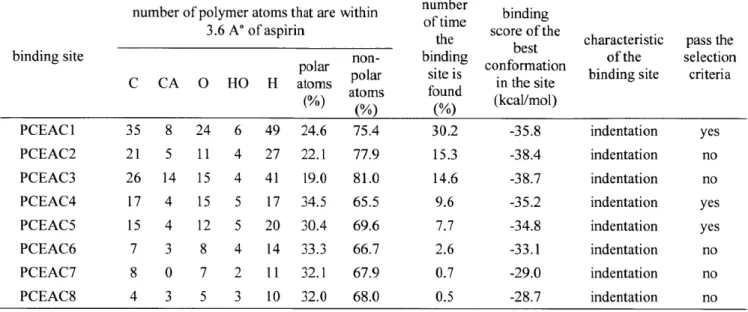
Figure 4-5. Major binding sites on the surfaces PCEAA (left), PCEAB (middle) and PCEAC (right) of PCEA, as identified by Adsorption Locator... 97
Figure 4-6. Major binding sites on the surfaces PHBAA (left), PHBAB (middle) and PHBAC (right) of PHBA, as primarily identified by Adsorption Locator. ... 100
Figure 4-7. Major binding sites on the surfaces PSA (left), PSB (middle) and PSC (right) of PS, as identified by A dsorption Locator. ... 103
Figure 4-8. The binding sites PAMA2 (left), PAMB5 (middle), and PAMC3 (right) after 1 ns solvent equilibration. They are the best binding sites of PAMA, PAMB, and PAMC, respectively. Aspirin is shown in stick representation. The crosslinked polymer surface is shown in surface representation. Carbons are shown in grey. Oxygens are shown in red. Nitrogens are shown in blue. Hydrogens are shown in white. ... 105
Figure 4-9. Free energy profiles along the distance constraint of the binding sites PAMA2 (left), PAMB5 (middle), and PAMC3 (right) after solvent equilibration... 106
Figure 4-10. The structure of the binding site PAMA2 at the minimum, where it is at the top of the surface (at the constraint of 30.45 A). Aspirin is shown in vdW representation. PAMA is show n in surface representation... 107
Figure 4-11. The binding sites PCEAAl (left), PCEAB5 (middle), and PCEACl (right) after 1 ns solvent equilibration. They are the best binding sites of PCEAA, PCEAB, and PCEAC, resp ectiv ely . ... 10 8
Figure 4-12. Free energy profiles along the distance constraint of the binding sites PCEAA1 (left), PCEAB5 (middle), and PCEAC 1 (right) after solvent equilibration... 109
Figure 4-13. The binding sites PHBAA7 (left), PHBAB5 (middle), and PHBAC4 (right) after 1 ns solvent equilibration. They are the best binding sites of PHBAA, PHBAB, and PHBAC, resp ectiv ely . ... 10 9 Figure 4-14. Free energy profiles along the distance constraint of the binding sites PHBAA7
(left), PHBAB5 (middle), and PHBAC4 (right) after solvent equilibration... 110
Figure 4-15. The structure of the binding site PHBAC4 at the minimum, where it is at the top of the surface (at the constraint of 29.71 A ). ... I11 Figure 4-16. The binding sites PSA4 (left), PSB7 (middle), and PSC2 (right) after 1 ns solvent equilibration. They are the best binding sites of PSA, PSB, and PSC, respectively. ... 111
Figure 4-17. Free energy profiles along the distance constraint of the binding sites PSA4 (left),
Figure 4-18. The structures of the binding site PSA4 at the minimum of the free energy profile (left), where the aspirin molecule is at the top of the surface (at the constraint of 34.95 A'), and at its original position (right) found by Adsorption Locator, where the aspirin molecule is stuck inside a sm all indentation... 113
Figure 4-19. The trend of the magnitudes of the average free energies of binding to the best sites. The trend is PAM > PCEA > PHBA - PS. This trend is very similar to that of the heterogeneous
nu cleation activ ity ... 1 15
Figure 4-20. Correlation of the magnitudes of the average free energies of binding to the best sites and experimental induction time of the four non-porous crosslinked polymers...115
Figure 5-1. Structure of aspirin, momoner molecules (AM, CEA, HBA, and S) and crosslinker m olecules (m eta-D VB , and para-D V B)... 124
Figure 5-2. A typical setup for the calculation of the preferential interaction coefficient. The
crosslinked polymer surface, ethanol molecules and water molecules are shown in line representation. Aspirin molecules are shown in vdW representation. Carbons are shown in grey. Oxygens are shown in red. Nitrogens are shown in blue. Hydrogens are shown in white... 129
Figure 5-3. Preferential interaction coefficient measures the excess number of small molecules (aspirin) in the local domain near the surface (crosslinked polymer surface) as compared to the b u lk d om ain . ... 13 0
Figure 5-4. "Point molecule" representation of aspirin. The center of mass position is denoted by
r, and the quaternion q defining the absolute configuration is displayed as a coordinate frame.
The atoms that are used to define the coordinate frame are the carbon adjacent to the ester group, the carbon adjacent to the carboxyl group, and the oxygen in the ester group...134 Figure 5-5. The structures of the three surfaces of PAM: PAMA (left), PAMB (middle), and PAMC (right). The crosslinked polymer surfaces are shown in surface representation. Carbons are shown in grey. Oxygens are shown in red. Nitrogens are shown in blue. Hydrogens are sh ow n in w h ite... 13 5
Figure 5-6. The structures of the three surfaces of PCEA: PCEAA (left), PCEAB (middle), and
P C E A C (right). ... 136
Figure 5-7. The structures of the three surfaces of PHBA: PHBAA (left), PHBAB (middle), and P H B A C (right)... 136
Figure 5-8. The structures of the three surfaces of PS: PSA (left), PSB (middle), and PSC (right).
... ... 1 3 6
Figure 5-9. Preferential interaction coefficient as a function of the distance from the polymer surface of PAM (top left), PCEA (top right), PHBA (bottom leftt), and PS (bottom right). ... 140
List of Tables
Table 3-1: The calculated density and heat of vaporization of ethylene glycol are in reasonable agreem ent w ith the experim ental values... 49
Table 3-2: The scaling factor of 0.98 of the vdW radius of 0 gives the best agreement between the calculated and experimental density and heat of vaporization. ... 50
Table 3-3: The characteristics of the binding sites on surface A, as identified by Adsorption L o cato r...5 8
Table 3-4: The characteristics of the binding sites on surface B, as identified by Adsorption L o c ato r...5 9
Table 3-5: The characteristics of the binding sites on surface C, as identified by Adsorption L o c ato r...6 1
Table 3-6: The characteristics of the binding sites on surface D, as identified by Adsorption L o cato r... 6 3
Table 3-7: Three best binding site models pass the selection criteria... 63 Table 3-8: Free energy of binding of the best binding sites and the experimental value. ... 71
Table 4-1: Calculated lattice parameters and lattice energy of aspirin are in reasonable agreement w ith the experim ental values. ... 77
Table 4-2: Calculated values of the density and heat of vaporization of ethanol and water are in reasonable agreement with the experimental values... 78
Table 4-3. The calculated density of non-porous crosslinked PAM, PCEA, PHBA and PS and their percentage of crosslinked reactive sites in monomers and cross-linkers at various cutoff d istan ces...82
Table 4-4. The number of monomer and crosslinker molecules used to construct surface slabs, the sizes of the slabs and the experimental density of crosslinked polymers. ... 83
Table 4-5: the calculated percentage of crosslinked reactive sites in monomers and cross-linkers of the three independently constructed surfaces of each polymer. ... 84
Table 4-6. The characteristics of the binding sites on the surface PAMA, as identified by A dsorption L ocator. ... 95
Table 4-7. The characteristics of the binding sites on the surface PAMB, as identified by A dsorption L ocator. ... 96
Table 4-8. The characteristics of the binding sites on the surface PAMC, as identified by A dsorption L ocator. ... 96
Table 4-9. The characteristics of the binding sites on the surface PCEAA, as identified by A dsorption L ocator... 98
Table 4-10. The characteristics of the binding sites on the surface PCEAB, as identified by A dsorption L ocator... 98
Table 4-11. The characteristics of the binding sites on the surface PCEAC, as identified by A dsorption L ocator... 99
Table 4-12. The characteristics of the binding sites on the surface PHBAA, as identified by A dsorp tion L ocator... 100
Table 4-13. The characteristics of the binding sites on the surface PHBAB, as identified by A dsorption L ocator... 10 1
Table 4-14. The characteristics of the binding sites on the surface PHBAC, as identified by A dsorption L ocator... 102
Table 4-15. The characteristics of the binding sites on the surface PSA, as identified by A dsorption L ocator...103
Table 4-16. The characteristics of the binding sites on the surface PSB, as identified by A dsorption L ocator...104
Table 4-17. The characteristics of the binding sites on the surface PSC, as identified by A dsorption L ocator...104
Table 4-18. The free energies of binding to the best binding sites of each surface and the average values for each polym er... 114
Table 5-1. The number of monomers, and crosslinkers molecules in the slabs, the sizes of the slabs and the experimental density of crosslinked polymers (reproduced from Chapter 4)... 125
Table 5-2. Polar and apolar surface areas of the crosslinked polymer surfaces. ... 137 Table 5-3. The maximum number of hydrogen bonds formed between different functional groups of the crosslinked polymer surfaces and aspirin molecules during the 15 ns trajectory... 138
Table 5-4. The maximum number of hydrogen bonds formed between different functional groups of the crosslinked polymer surfaces and aspirin molecules during the 15 ns trajectory... 138
Table 5-5. The maximum number of hydrogen bonds formed between different functional groups of the crosslinked polymer surfaces and aspirin molecules during the 15 ns trajectory... 139
Table 5-6. The preferential interaction coefficients of each surface and the average of the coefficients for each polym er... 141
Table 5-7. The number of aspirin molecules associated with the area of the binding site ... 145
Table 5-8. Peaks in the pair distribution function for an ideal aspirin crystal...146
Table 5-9. Average peak locations and concentration parameters for an aspirin crystal at 298.15 K ... 14 7
Table 5-10. The maximum value of the distance order parameter of aspirin molecules for each surface and the average value for each polymer...148 Table 5-11. The experimental ranking of heterogeneous nucleation activities of aspirin on the four crosslinked polymers and the predicted ranking based on various methods... 149
Chapter 1
Introduction
1. Introduction
Crystallization is a commonly used purification and separation process in pharmaceutical,
chemical and food industries." In industrial practice and most circumstances, it usually starts
with heterogeneous nucleation on a foreign surface.''6 In spite of the wide use of crystallization, the complicated mechanism of heterogeneous nucleation is not well understood. However, we
hypothesize that there might be a possible correlation between binding affinity to a surface and
nucleation enhancement.
Amorphous polymeric substrates have been proven to be very useful in controlling
crystallization, selectively producing pharmaceutical polymorphs, discovering novel
pharmaceutical polymorphs, and promoting the growth of single crystals of small molecules.7~0
Recently, Diao et al. investigated the effectiveness of various crosslinked polymeric substrates in
inducing nucleation of aspirin, and they found that polymers with different functional groups
perform at different levels of nucleation enhancement.'0 However, to be able to identify
polymers that can effectively promote heterogeneous nucleation, experimentalists had to screen
through tens of polymers with various functional groups, and this process can be time and
resource consuming.
To identify polymers promoting heterogeneous nucleation, experimentalists usually select
polymers based on possible interactions between the functional groups of a small molecule and
polymers and then try many polymers with various functional groups in experiments. However,
the effectiveness of heterogeneous nucleation on the polymer surface probably involves
complicated interplay among various factors such as the morphology of the surface, the binding
affinity to the surface, the accessibility of a small molecule to a surface, the interactions with the
complicated factors at the same time, especially when a small molecule contains many
complicated functional groups such as those in an active pharmaceutical ingredient. Moreover,
heterogeneous nucleation experiments can be time and resource consuming. The
experimentalists have to try a large number of polymers with various functional groups to find a
few polymers with the best heterogeneous nucleation activity. These experiments can also cause
a large amount of chemical waste that can harm the environments. Therefore, there is a need for
a computational tool that can help guide the selection of polymers promoting heterogeneous
nucleation. This computational tool can help the experimentalists to focus on a few polymers
predicted to have the best heterogeneous nucleation activity, instead of trying tens or hundreds of
these polymers in experiments.
1.1 Thesis Objectives
The objective of this thesis is to investigate the possibility of using binding affinity of a small
molecule to an amorphous polymer in a solvent to help guide the selection of polymers that
promote heterogeneous nucleation. Specifically, the binding affinity of one molecule to a binding
site and the binding affinity of many molecules to a surface were investigated. The binding
affinity of one molecule to a binding site is measured by the free energy of binding, a
methodology which was developed in this thesis. The binding affinity of many molecules to a surface is measured by the preferential interaction coefficient, a methodology which was
originally developed by Banes and Trout.'1
1.2 Organization
The remaining six chapters have the following contents. Chapter 2 gives an overview of
of the free energy of binding. Chapter 4 discusses the results for the possibility of using the
binding affinity of one molecule to a binding site, as indicated by the free energy of binding, to
help guide the selection of polymers promoting heterogeneous nucleation. Chapter 5 reports the
results of the possibility of using the binding affinity of many molecules to a surface, as
indicated by the preferential interaction coefficient, to help guide the selection of polymers
promoting heterogeneous nucleation. Chapter 6 summarizes the major conclusions drawn from
Chapter 2
2. Literature review
2.1 Classical nucleation theory: heterogeneous nucleation
Nucleation starts the crystallization in solutions. Heterogeneous nucleation (HEN) occurs
when the old and new forming phases come into contact with the third molecular species or
phase, while forming clusters of crystals. The cluster size (n) represents the number of molecules
in the cluster. At the activation barrier of the nucleation, the clusters of size n* are called nuclei
(or critical nuclei). When n<n*, the clusters are called subnuclei. When n>n*, the clusters are
called supernuclei.
The work needed (W or AG) to form a cluster of size n is the sum of the bulk contribution and
the surface contribution, as follows:
W(n) = -nAp +
p(n).
Supersaturation is defined as Ap =kT inS. The nucleation is possible when the solution is
supersaturated (Ap>O). k is the Boltzmann constant; T is temperature; and S is the
supersaturation ratio (S) given by
S=an a ... a' /" a 1a2 . j 1,e a... 2,e af.je
In this case, the ionic crystals dissociate into ions of type i = 1, 2,
j.
ni represents thenumber of the ith ions in a molecule of the crystal. at and ai,e represent the actual and equilibrium
activities. If the solutions are sufficiently dilute, at and aie can be replaced by the actual and
Figure 1-1: Cross-section of a cap-shaped cluster of n molecules (3D HEN) (reproduced from'3).
SduiCn
Figure 1-2: Cross-section of a disk-shaped cluster of n molecules (2D HEN) (reproduced from13)
#
(n) is the surface energy contribution dependent on the system. If the shape of the clusters ona solid surface is approximated by a spherical cap with a wetting angle 0 (3D HEN in Figure
1-1),
#
(n) is given by (3 67co2 i1yf n 2, where yf = y V 13(0). Therefore, W (n) becomes W (n) = -nkTlnS + (367Cvo 2)"y n2 13 Y1/3(0).
vo is the volume of a molecule in the cluster. y is the specific surface energy of the
cluster/solution interface, and T = % (2+cos 0)(1-cos 0)2. If the shape of the clusters is
approximated by a disk of fixed height (2D HEN in Figure 1-2),
#(n)
is given by n aegAy + b Kn'2. Therefore, W(n) becomes
W(n) = -nkTlnS + agfAy + b K n.
solution
af is an effective molecular area, which is vo/height of the disk (h). Ay = y + ye - ys. ys and Ycs are the specific surface energies of the substrate/solution and cluster/substrate interfaces,
respectively. B is the shape factor, which is 2(rag)2.
K is the specific edge energy, which is yh.
A maximum of W(n) at n = n* (critical nucleus) is the energy barrier to nucleation (W*). For
3D HEN, the expressions for n* and W* are given by'3
n* = 32xvo2yef/3(kT)3ln S;
W= H n*kT inS.
For 2D HEN, the expressions for n * and W* are given by 1
n* 7raef K 2/(kT inS -ae Ay)2;
W*= n*(kTlnS -aef Ay).
The nucleation rate for 3D HEN is given by12
J(S) = AS exp(-B/ln 2S)
B =167vo2 yc/3(kT);
A (kT/vo2 m)" DCelnS (for volume-diffusion);
A (4w/3vo )m13 (ycf /kT) 2 (for interface-transfer control).
D is the monomer diffusion coefficient and Cc is the solubility.
For 2D HEN, the nucleation rate is given by'
J(S) = A ' S exp [-B '/(lnS - aoA y/kT )];
2 2 B= b K /4k21.
For surface diffusion and molecular beam condensation, A 'is given by
A' = y*[c*kT( InS-aoA y/kT)312/bK] As2 ,Co.
ao is the molecular area. As is the mean surface diffusion distance and is equal to (Dsrd)1/2
, where
Ds is the coefficient of surface diffusion of a monomer and rd is the mean time of desorption (rd =
(1/vs) exp(Ed/kT), Edes is the activation energy of desorption). I, is the equilibrium impingement
(Ie= pe/(2cmokT) , where pe is the equilibrium pressure and mo is the mass of a molecule. Co is
the concentration of nucleation sites.
As shown above, n*, W* and J(S) all involve surface energy/surface tension (y). Thermodynamically, y equals Gibbs free energy per surface area (work needed to increase a surface area A) and is given by
y = () iJATPn.
Since the cohesive forces between the molecules of the same phase or the adhesive forces between the molecules of different phases cause surface energy, we hypothesize that there might be a possible correlation between binding affinity to a surface and heterogeneous nucleation
activity.
2.2
Experimental and computational studies of heterogeneous nucleation
Experimentally, several studies have been done on heterogeneous nucleation on highly-ordered
substrates, such as crystals 14-19 and self-assembled monolayers (SAMs). 20-22 For crystalline
substrates, lattice match or epitaxial relationship plays an important role. Cai et al. found that
[MBSA]-', 5-benzyl-4-hydroxyl-2-methoxy-benzenesulfonic acid, absorbs strongly to the (0001)
face of single crystals of hydrotalcite, a clay with [Mg6Al6(OH)16]2+ layers and forms an ordered
crystal growth can be achieved by varying the functional groups and the length of the SAMs, the
supporting metal/metals combination, and the concentration and composition of the crystallizing
solution.2 0 By choosing a specific SAM/metal combination, Aisenberg et al. successfully
controlled the formation of a desired polymorph of CaCO3.20
In terms of heterogeneous nucleation on amorphous substrates, experimental studies have been
done on polymers.2 4
-2 7 Through the use of diverse libraries of polymer heteronuclei, including
both commercial polymers and combinatorially synthesized cross-linked polymers from a single
solvent and temperature condition, Price et al. selectively produced two stable polymorphs of
acetaminophen and six stable forms of 5-methyl-2- [(2-nitrophenyl)amino]
-3-thiophenecarbonitrile. Moreover, they discovered one new form of carbamazepine and two new
forms of sulfamethoxaxole.27 Recently, Diao et al. investigated the effectiveness of various
polymer substrates in inducing nucleation of aspirin, and they found that polymers with different
functional groups perform at different levels of nucleation enhancement.10 They used
poly(4-acryloylmorpholine) (PAM), poly(2-carboxyethyl acrylate) (PCEA), poly(4-hydroxylbutyl
acrylate) (PHBA), and polystyrene (PS), where they were crosslinked with divinylbenzene
(DVB). They measured the average induction time of aspirin crystals on each polymer surface
and found that the ranking of nucleation activities of these non-porous crosslinked polymers is
PAM > PCEA > PHBA ~ PS. PHBA and PS have comparable nucleation activities that are
similar to that of bulk crystallization. However, the molecular-level understanding of how the
surfaces of polymers interact with the solute molecules and promote nucleation is still
incomplete.
Several computational studies have been done on heterogeneous nucleation on crystalline
(MD)/Monte Carlo (MC) to study the epitaxial growth of ZnSe on GaAs (001) and found that the
As-terminated GaAs substrates employed for Zn-initiated growth of ZnSe were the most stable
interfaces of the four studied interfaces at a growth temperature of approximately 280'C.29
Sternberg and Lambrecht used a density-functional based tight-binding method31 to identify a possible structure of the direct heteroepitaxial silicon/diamond (001) interface with and without
graphitic interlayers.32 Grein et al. employed the hybrid MD/MC to study the epitaxial growth of
Ge on Si (001), and the results were in good agreement with experimental data.30 Tully et al.
used the simplified stochastic classical trajectory-ghost atom theory3 3 to simulate the island
growth process of Pd on Ni (111) and found that this growth follows a downward funneling
mechanism, which is independent of the surface temperature.2 8
Furthermore, a number of computational studies have been done on heterogeneous nucleation
on amorphous substrates, such as polymers.34-36 Rozas and Kraska employed molecular
dynamics simulation to study heterogeneous nucleation and growth of supersaturated argon
vapor at polyethylene surfaces and found that the system exhibits two-dimensional growth with a
trend to three-dimensional growth as the supersaturation of the vapor is increased. Ciacchi et al.
investigated the heterogeneous nucleation of platinum clusters on DNA and proteins using first principles molecular dynamics techniques.3 7
,3 8 Saphiannikova et al. applied molecular-dynamics
simulations to explore the crystallization of an azo dye (Disperse Red- 1) on the encapsulated
polymer chains.36
Despite all these computational studies on heterogeneous nucleation, to the best of our
knowledge, no attempt has been made to investigate the possibility of using binding affinity to
help guide the selection of polymers promoting heterogeneous nucleation, and to investigate the
2.3 Construction of polymer structures
Amorphous Cell Module of Materials Studio,39 distributed by Accelrys, is a common tool that
is used to generate structures of long chain polymers. This module employs an algorithm
developed by by Theodorou and Suter 0 and the scanning method of Meirovitch.4' In brief, the
conformations of the unperturbed chains are generated by using the rotational isomeric state
(RIS) model of Flory.42 Modified conditional probabilities are used to compute the non-bonded interactions between the atoms to be placed and the rest of the system, and these probabilities are
used to prevent excessive overlaps between polymer chains. While computing the conditional
probabilities, the scanning method is used to account for all possible continuations of the
growing chains. Severe overlaps are relaxed first, then the less severe overlaps are relaxed and
gradually the minimum structure is obtained.
The probability of the conformation with length N (the equivalent Markov process) is given
by:
Pi = qN(VNIVN-1) ... q3(V3 1V2)q 2(V21V1
)pv1-Pi is the probability of chain of length N in configuration i. PvJ is the probability of the first bond
in state V1. qN(VNIVN-1) is the probability of the Nth bond in state VN given the N-1 th bond in state
VN-q-The conditional probability is given by:
-AUki
q'(vjlVk) = qi(vJlVk) e RT -AU fj
Xk, qi(vjlvk)e RT
where qj
(
vjI
k) is from the rotational isomeric state theory, AUkj is the increase in the long-range interaction energy upon the addition of a new bond, R is the gas constant and T is theTo generate the structures of crosslinked polymers, the method developed by Yarovsy et al.43 was modified and used in this thesis. Briefly, this procedure involves creating a mixture of monomers and crosslinkers at the experimental ratio and density. The mixture is equilibrated at high temperature (600 K) and then at room temperature. The mixture is analyzed to identify the reactive sites in close proximity (within a specific cutoff), and these sites are considered to be the most probable sites to take part in the crosslinking reactions. The reaction sites are then "chemically reacted" according to the reactivity order of the possible crosslinking reactions that can happen between the functional groups of the monomers and crosslinkers. Finally, the crosslinked polymer structure is equilibrated at high temperature (600 K) for better relaxation and then at room temperature.
2.4 Free energy of binding
The free energies of binding of small molecules to biopolymers, especially proteins, in water 44-56
have been widely calculated in various systems.4- For biopolymers, the binding sites and
conformations of the structures are usually identified by X-ray crystallography. Using the bound structures, the free energies of binding can be calculated by the thermodynamic integration technique.57 However, to the best of our knowledge, there have not been any attempts to compute
quantitatively the free energy of binding of a small molecule to an amorphous polymer in a solvent, probably because no crystal structure of an amorphous polymer and a bound conformation is experimentally available.
Three major steps are required to compute the free energy of binding of a small molecule to an amorphous polymer in a solvent. First, a model of an amorphous polymer structure needs to be generated. In this thesis, the procedures described in section 2.3 were used to build polymer structures.
Second, a probable binding site needs to be identified. Adsorption Locator Module of
Materials Studio in combination with molecular dynamics was used in this thesis. Adsorption
Locator has been used to investigate the adsorption of a small molecule to various surfaces.58-61 it
implements simulated annealing using the Metropolis Monte Carlo method62-64 to sample the
search space while the temperature is gradually decreased. The Metropolis Monte Carlo method
employs four step types: conformer, rotation, translation, and regrowth. Using the weights that
are specified at the start of the run, a step type is chosen at random. The selected step type is
applied to a random adsorbate of a random component, and the details of each step type are as
follows:
1. Conformer. The conformation of the selected adsorbate is substituted with a randomly
chosen conformation from the trajectory of that species. The position and orientation of the
old conformer is given to the new conformer.
2. Rotation. About its geometry center, the selected adsorbate is rotated by an angle of 60
about an axis A. The rotation 60 is drawn from a uniform distribution, and it has a value
between -Ar and Ar (Ar is the maximum amplitude of rotation). The axis A represents the vector from a random point on a sphere to its origin.
3. Translation. Along an axis A, the selected adsorbate is translated by a distance of 6r. The
translation 6r is drawn from a uniform distribution, and it has a value between 0 and At (At
is the maximum amplitude of translation). The axis A represents the vector from a random
point on a sphere to its origin.
4. Regrowth. The selected adsorbate is removed from the system. Then, a new adsorbate of
the same species is inserted at a random position on the substrate with a random orientation
At each temperature, the current state of binding conformation is changed into a randomly
chosen neighboring state. If the energy decreases, the new state is accepted. Otherwise, the new
state is accepted with the probability given by:
(En-Em) Pmn = e kT
where Pn, is the probability that the current state m is changed into the new state n, k is the
Boltzmann constant and T is temperature.
Lastly, the method to compute the free energy of binding is needed. In this thesis, we used the
Blue-Moon Ensemble method,6 5,66 which has been used to calculate the free energy of various
systems. 67-76 This method employs constrained molecular simulations that use holonomic
constraints to confine the system to the hypersurface with a constant prescribed order parameter, and it allows us to compute the gradient of the free energy (the mean force) associated with the
66F
reaction coordinate. The gradient of the free energy for each constraint (-) is given by65:
aF
z - (bj(x)-V -kBT Vbj(X))q(x)=z
where F is free energy, z is a constraint, V is potential energy, k is the Boltzmann constant, T is
temperature and bj(x) is given by:
b !(x)= .
Q'
is given by:where
{/}
is an orthonormal basis in the subspace spanned by{
Vq (x)II
constructed by Gram-Schmidt orthogonalization.Adsorption Locator and the Blue-Moon Ensemble method were chosen mainly because of their
compatibility with the modules and the force field in Materials Studio as well as their
compatibility with the system where a small molecule binds to a polymer in a solvent.
2.5
Preferential interaction coefficient
To measure the binding affinity of many molecules, the preferential interaction coefficient of
small molecules to a surface was used in this thesis. The preferential interaction coefficient is a
thermodynamic quantity that measures the excess number of small molecules in the vicinity of
the surface (local domain) as compared to the bulk (bulk domain). It was computed for various
systems involving small molecules and proteins. 1'77-79 Developed by Banes and Trout,"' the
method for the calculation of the preferential interaction coefficient is based on a statistical
mechanical approach as applied to an all-atom model with no adjustable parameter. Without a
priori information about any binding sites on the protein, the method was originally used to
compute the number of bound molecules to protein. The preferential interaction coefficient (T) of
small molecules to a protein is given by:
F23= ( n'- n ),
where nj is the number of molecules of species
j
in domain i. The angle bracket( )stands for ensemble average. Subscripts 1, 2, 3 represent water (solvent), protein, and small molecule,respectively. Superscripts I, H represent the bulk and local domain, respectively. The positive
value of F23 indicates a favorable interaction because the concentration of small molecules in the
local domain of protein is higher than that in the bulk domain. On the contrary, the negative
value of F23 indicates an unfavorable interaction because the concentration of small molecules in
The definition of the instantaneous preferential interaction coefficient (I23(rt)) was recently
modified by Shukla et al.77 to incorporate the effect of movement of solvent and small molecules
in and out of the local domain of the surface. This modified formula is given by:
F2 3 (r, t) = n3(r, t) - ni(r, t) n3 -n3 MO
where 1 is water (reference solvent), 2 is protein, 3 is small molecule, r is the distance from the protein surface, t is time, ni is the total number of water molecules, and n3 is the total number of
Chapter 3
Free Energy of Binding of a
Small Molecule to an
Amorphous Polymer in a
Solvent: Methodology
3. Free Energy of Binding of a Small Molecule to an Amorphous
Polymer in a Solvent: Methodology Development
As mentioned in chapters 1 & 2, amorphous polymers have been used in controlling
crystallization, which usually starts with heterogeneous nucleation on a foreign surface. The
complicated mechanism of heterogeneous nucleation is not well understood, but we hypothesize
that there might be a possible correlation between binding affinity to a surface and nucleation
enhancement. To the best of our knowledge, there have not been any attempts to compute
quantitatively the free energy of binding of a small molecule to the surface of an amorphous
polymer in a solvent. Nor has there been any attempt to characterize the binding
sites/conformations of this system at a molecular level, although the free energies of binding of
small molecules to biopolymers, especially proteins, in water have been widely calculated in
various systems.4 4-56
In this Chapter, we developed a two-step approach, first using Adsorption Locator Module of
Materials Studio39 to identify probable binding sites and molecular dynamics to screen for the best binding sites, and then using the Blue-Moon Ensemble method65'66 to compute the free
energy of binding. Adsorption Locator implements simulated annealing using the Metropolis
Monte Carlo method,62-64 and it has been used to investigate the adsorption of a small molecule
to various surfaces.58-61 The Blue-Moon Ensemble method has been used to calculate the free
energy of various systems. 67-76 It employs constrained molecular simulations that use holonomic
constraints to confine the system to the hypersurface with a constant prescribed order parameter,
and it allows one to compute the gradient of the free energy (the mean force) associated with the
mainly because of their compatibility with the modules and the force field in Materials Studio as
well as their compatibility with the system where a small molecule binds to a polymer in a
solvent.
The system of ethylene glycol binding to PVA in D20 is used as a model and for validation
because the experimental free energy of binding exists on a related system.80 The experimental free energy of binding was computed from the binding constant of ethylene glycol with PVA in
aqueous solutions and gels as measured by NMR spectroscopy, where the PVA concentration
was varied. This binding constant involves all possible binding events of ethylene glycol at the indentation binding sites and hole-beneath-a-surface binding sites of PVA.
Using our approach, we generated four independent surfaces of PVA, identified reasonable
binding sites, and computed the free energy of binding of the three best indentation binding sites.
To our knowledge, our study is a first attempt to compute the free energy of binding of a small
molecule to an amorphous polymer in a solvent. Our approach offers a way to compute the free
energy of binding and characterize the binding sites/conformations. Moreover, it is general
enough to apply to other small molecule/amorphous polymer/solvent systems. It is worth
mentioning that once the binding sites are identified, our procedure can also be used to compute
the free energy of binding of other bound products, including clusters and full layers, using other
free energy methods that are compatible with the system.
3.1 Computational Details
The polymer consistent force field81 8 2 (PCFF) as applied in Materials Studio (distributed by
Accelrys) was used throughout this study. The group-based method with a 12.5 A' cutoff was
the minimization steps were carried out using the steepest descent method (until the derivative
reaches 1,000 kcal/mol A') and followed by the conjugate gradient method (until the derivative
convergences to 0.01 kcal/mol A' or the total number of steps reaches 5,000). The errors of all
calculated properties were estimated by using the method described by Allen and Tildesley.83
3.1.1 Force Field Validation 3.1.1.1 PVA
The Amorphous Cell Module of Materials Studio described elsewhere40'84 was used to build an
atactic PVA structure with a density of 1.293 g/cm3. This density is the experimental measured
density of atactic PVA at room temperature. 85,86 To find the minimum size that is sufficient to
represent the real polymer chain, solubility parameters of the chosen repeating units were
calculated until further increase in the repeating unit does not change the values of the solubility
parameters. 87'88 Three independently constructed PVA structures in the cubic box with the
lengths of about 27 A were minimized, equilibrated for 100 ps and further run for 100 ps under