Publisher’s version / Version de l'éditeur:
IEEE Sensors Journal, 14, 12, pp. 4122-4133, 2014-10-21
READ THESE TERMS AND CONDITIONS CAREFULLY BEFORE USING THIS WEBSITE. https://nrc-publications.canada.ca/eng/copyright
Vous avez des questions? Nous pouvons vous aider. Pour communiquer directement avec un auteur, consultez la
première page de la revue dans laquelle son article a été publié afin de trouver ses coordonnées. Si vous n’arrivez pas à les repérer, communiquez avec nous à [email protected].
Questions? Contact the NRC Publications Archive team at
[email protected]. If you wish to email the authors directly, please see the first page of the publication for their contact information.
NRC Publications Archive
Archives des publications du CNRC
This publication could be one of several versions: author’s original, accepted manuscript or the publisher’s version. / La version de cette publication peut être l’une des suivantes : la version prépublication de l’auteur, la version acceptée du manuscrit ou la version de l’éditeur.
For the publisher’s version, please access the DOI link below./ Pour consulter la version de l’éditeur, utilisez le lien DOI ci-dessous.
https://doi.org/10.1109/JSEN.2014.2336240
Access and use of this website and the material on it are subject to the Terms and Conditions set forth at
Computational intelligence for urban infrastructure condition
assessment: water transmission and distribution systems
Liu, Zheng; Kleiner, Yehuda
https://publications-cnrc.canada.ca/fra/droits
L’accès à ce site Web et l’utilisation de son contenu sont assujettis aux conditions présentées dans le site LISEZ CES CONDITIONS ATTENTIVEMENT AVANT D’UTILISER CE SITE WEB.
NRC Publications Record / Notice d'Archives des publications de CNRC:
https://nrc-publications.canada.ca/eng/view/object/?id=4ff847c4-1867-4c6d-8c41-478336da86f8 https://publications-cnrc.canada.ca/fra/voir/objet/?id=4ff847c4-1867-4c6d-8c41-478336da86f8
Computational Intelligence for Urban Infrastructure
Condition Assessment: Water Transmission and
Distribution Systems
Zheng Liu, Senior Member, IEEE, Yehuda Kleiner
Abstract—Water transmission and distribution systems are critical urban infrastructure. The aging of water mains can lead to increased breakage rate, decreased hydraulic capacity, and deterioration of water quality. Condition assessment of water mains encompasses building computational model of failures, discerning distress indicators from inspection, rating health con-dition, and forecasting future failures. In this process, computa-tional intelligence helps to achieve high-level awareness of system condition and facilitates the decision making in water main renewal and rehabilitation by using the combined information from field knowledge, historical records, inspection results, and sensory data. This paper reviews computational approaches to achieve condition assessment of water mains. Inspection and sensor technologies involved in the assessment process are also briefly discussed.
Index Terms—Computational intelligence, water pipe, infor-mation fusion.
I. INTRODUCTION
A
GING of water mains, coupled with continuous stressplaced on these systems by operational and environ-mental conditions, leads to their deterioration. The structural deterioration is subject to both static and dynamic factors [1]. The static factors include pipe material, size, age, soil type, etc., while climate, cathodic protection, pressure zone changes etc. constitute dynamic factors. Condition assessment of water mains is to address the problems with aging infrastructure. The U.S. Environment Protection Agency (USEPA) defines the pipe condition assessment as collection of data and infor-mation through direct and/or indirect methods, followed by analysis of the data and information and making a determina-tion of the current and/or future structural, water quality, and hydraulic status of the pipeline [2].
The maintenance of infrastructure is evolving with modern technologies from run-to-failure maintenance, time-based pre-ventive maintenance, to a more cost effective condition-based maintenance (CBM). Structural health monitoring (SHM), or a more general concept condition assessment, is a key step to implement an infrastructure CBM program. The evidence is collected and presented through SHM and condition as-sessment. A general implementation of remote SHM system is described in [3], which can be adapted to different appli-cations, such as pipes and bridges. Deriving those evidence
Dr. Z. Liu is with Toyota Technological Institute, Nagoya, 468-8511, Japan E-mail: [email protected]
Dr. Y. Kleiner is with National Research Council of Canada, Ottawa, Ontario K1A 0R6 Canada E-mail: [email protected]
Manuscript received XXXX 00, 2014; revised XXXXX 00, 2014.
from raw sensing data needs computation approach, which has been recognized as one of the statistical pattern recognition or machine learning problems [4].
Computational methods for condition assessment include converting inspection or sensory data to distress indicator and translating these distress indicators into condition rat-ings or states. The first task deals with the collection of raw inspection/sensory data. Inspection data comprise non-destructive testing results, sensor monitoring data, service and failure records, and any other indirect measurements or surveys. Quantitative or qualitative information, i.e. distress indicator, is derived from inspection data to characterize the anomalies of the pipe, for instance, pit size in metallic pipes, number of broken wires in prestressed concrete pipes (PCCP), delamination in pipe coating or lining, etc. Distress indicators are the observable/measurable physical manifestations of the pipe aging or deterioration process [5]. The second task deals with a higher level description of the pipe’s status, i.e. health condition rating. Condition states are estimated from the predefined distress indicators. Raw inspection/sensory data can also be used for condition assessment directly with other information. The role of condition assessment in infrastructure failure management is illustrated with Fig. 1. The condition assessment starts from the collection of measurement data to feed into a model for interpretation. Inspection is primarily carried out to identify distress indicators, which are physically observed and/or measured, and is a prelude to establishing con-dition states. The inspection data will be transferred to distress indicators, which are either quantitative or qualitative. The data may also includes other relevant information, such as historical records of breakages, soil property data, sensor monitoring data, pipe geometric data, pipe material, etc. The condition assessment will interpret these inputs and give a condition rates. The deterioration model will determine behaviour of water mains and predict the breakage [6], [7]. The likelihood and consequence of failure is estimated from the prognostic results. Risk analysis and decision making process initiate the action for service and maintenance. Computational intelligence plays a paramount role in achieving critical knowledge from raw data.
The rest of the paper is organized as follows. Inspection and sensing techniques are briefly summarized in section II. Section III reviews computation approaches for condition assessment of water mains. As leak detection and monitoring is crucial, two subsections are dedicated to these topics, respectively. Decision support systems for water main renewal
Fig. 1. A diagram of managing failure of buried critical infrastructure.
and rehabilitation are presented in section IV. The concluding remarks can be found in section V.
II. INSPECTION ANDSENSORTECHNOLOGIES FOR
CONDITIONASSESSMENT
The collection of relevant data and information is the first step to achieve condition assessment for prevention of catastrophic failures. Inspection technologies are employed to acquire on-site measurement data and can be categorized into conventional non-destructive inspection and advanced sensor techniques. This section briefly describes the two categories. A. Conventional Inspection Techniques
Conventional inspection techniques consists of direct and indirect methods [8], [9], [10], [11]. Direct methods usually require access to the inside or outside of the pipe, which in-clude automated/manual visual inspection and non-destructive testing applied either to pipe samples of full length [9]. Indirect methods include the analysis of failure history, water audit, flow testing, and measurement of soil properties. Generally, direct methods generate pipe distress indicators while the inferential indicators are obtained by indirect methods [10], [11]. Table I lists the direct methods and a list of indirect method can be found in Table II.
B. Advanced Sensor Techniques
Monitoring sensors may provide a continuous stream of data to support awareness of pipe performance and health state [48]. Sensor data are typically available in two forms, i.e. state awareness and usage. State awareness sensors provide information about the current state of the material and the structural health from initial indications of defects. Usage sensors directly or indirectly measure external impacts that lead to damage, such as local stresses and environmental parameters [48]. Table III provides a list of sensors used for pipe condition assessment.
III. COMPUTATIONALAPPROACHES
A. Computing for Leak Detection and Monitoring
Leak detection and location is to find (detect and locate) and assess the level of leaks which already happened while leak monitoring is to capture the occurrence of any new leak event [63]. A summary of active technologies for leak
TABLE I
LIST OF DIRECT INSPECTION METHODS.
Direct Inspection Methods Visual inspection Closed-circuit television (CCTV) inspection [12], [13] Laser scan [14], [15] Electromagnetic methods
Magnetic flux leakage (MFL) [10], [16] Remote field eddy current (RFEC) [17],
[18], [19] Broadband electromagnetic (BEM) [20] Pulsed eddy current (PEC) testing [21], [22] Ground penetrating radar (GPR) [23],
[24], [25] Ultra-wideband (UWB) pulsed
radar system
[26], [27]
Acoustic methods
Sonar profiling system [28], [29] Impact echo test [30], [31] SmartBall system [32], [33] Sahara system [23], [34], [35] Leak detection [36], [37] Ultrasound methods
Guided wave ultrasound [38], [39] Discrete ultrasound [10] Phased array technology [40], [41] Combined UT inspection [42] Radiographic methods [43] Thermography methods [44], [17]
TABLE II
LIST OF INDIRECT INSPECTION METHODS.
Indirect Inspection Methods Linear polarization resistance (LPR) of soil [10]
Soil characterization [10], [45], [46], [47] Pipe to soil potential survey [10]
TABLE III
LIST OF SENSOR FOR PIPE CONDITION ASSESSMENT[10], [1], [48].
Sensor Usage Corrosion rate sen-sor
Measure electrical resistance, which can be used to calculate corrosion rate
[49]
Acoustic emission sensor
Acoustic monitoring for acoustic events such as wire break
[50] Magnetostrictive
sensor
Any discontinuities such as cracks [51], [52], [53] Conformable and flexible eddy current array
Measure pitting corrosion [54], [55]
Flexible ultrasonic transducer
Measure thickness loss [56], [57] Guided wave
sen-sor
Detect corrosion and defects [58], [59] Damage sensor Measure defects [60] Microwave
back-scattering sensor
Detect nonhomogeneities, such as holes caused by erosion and humidity changes
[61]
detection and monitoring is given in Fig. 2, which comprises both testing and computing technologies. Some techniques are capable of both detection and location while some can only do either one of them. The computational techniques, which are the focus of this paper, are discussed in this subsection.
Fig. 2. Summary of active technologies for leak detection and monitor-ing [63].
1) Computing for Leak Detection:
a) Cross-correlation: A correlator for leak detection is
based on the correlation of the signals from two transducers. Cross-correlation of the two signals will produce a peak, which can be used to calculate the distance of the leak from the midpoint [36]. However, the acquired signals are prone to distortion. A more robust method was proposed by the Central Research Laboratories at Thames Water [64].
A complex discrete Fourier transform (DFT) is used to transform the input time domain signal to the frequency domain. The echo of the signal is removed/cancelled by ana-lyzing the auto-correlation of each channel. Phase coherence analysis is used to determine which parts of the frequency spectrum contain useful information. The output of the analy-sis resulted in a weighted frequency filter, which achieved an optimal performance in the detection of leak signals [64].
b) Sensor data fusion: A framework for leak detection by
spatial-temporal data fusion was proposed by Jiao et al. [65]. The basic idea is illustrated in Fig. 3. Multiple acoustic emission (AE) sensors were installed on each end of pipeline. The acquired signal was analyzed with wavelet method, which offers a time-frequency feature of the signal. The extracted features were further processed by pre-trained neural network to identify the possible leak represented by mass functions or basic probability assignment (BPA). The mass functions from multiple sensors were fused with Dempster-Shafer rule to derive the detection result of pipe leakage.
The fusion was actually implemented in both spatial and time domain with two steps [65]. The first step applied to identify the possible target while the second step refined the result through fusing data with different time stamps. An improved detection rate was observed [65].
The fusion of hydraulic data for burst detection and location in a treated water distribution system was reported by Mounce
Fig. 3. Sensor data fusion for leak detection.
et al. [66]. An artificial neural network was used to model the time series data acquired by a flow sensor. A mixture density network (MDN) was employed to predict the conditional probability distribution of the target data. The actual observed value was analyzed in the context of the predicted probability distribution and a normal or abnormal state was observed. This classification results from various zones were fused by a rule-based expert system implemented with PROLOG.
c) Hydraulic transient-based methods: Besides the
non-destructive inspection methods, hydraulic transient-based tech-niques are also available to detect and locate existing leaks. The information about the presence of a leak is extracted from a measured transient trace. Various computational approaches have been proposed to analyze the hydraulic information for both detection and monitoring purposes.
• Leak reflection method: This method is based on the
principle of time domain reflectometry [67]. A transient wave is reflected at the leak and can be identified in a measured pressure trace. The location of leak can be calculated.
• Inverse transient analysis: Least square regression is
applied to the modelled and measured transient pressure traces [68]. The minimization of the deviation between the measured and calculated pressures gives the leak location and size.
• Impulse response analysis: The impulse responses of the
same pipeline with and without a leak are compared. The presence of a leak will introduce the change of the impulse response [69].
• Transient damping method: A leak detection and location
method was developed based on the rate of leak-induced damping [70]. This rate depends on leak characteristics, pressure, location of the transient generation point, and the shape of the transient.
• Frequency domain response analysis: The analysis of
transient response in the frequency domain compares the dominant frequencies of no-leak and leaking pipelines. The leak location can be obtained.
2) Computing for Leak Monitoring: Leak monitoring
ap-proaches basically consist of two categories, i.e. measurement-based and model-measurement-based techniques. As illustrated in Fig. 2. The measurement-based methods use the measured param-eters to detect leaks while model-based methods rely on flow/hydraulic models.
a) Measurement-based methods:
• Acoustic monitoring: Through analyzing the acoustic
A correlator is often used to locate the leaks.
• Volume balance method: The basic principle is that the
amount of fluid that goes into the pipe should be equal to the amount that goes out of the pipe as defined in following equation [71]:
V B= Vin−Vout−∆V (1)
V B: volume balance;
Vin: inlet volume;
Vout: outlet volume;
∆V : volume of fluid contained in the pipe (line pack).
Any leak will give a positive value of V B. ∆V = 0
indicates a steady state of flow.
• Pressure-point analysis: This method is implemented by
monitoring leak-induced pressure drop [72]. Statistical techniques are applied to identify the leak signature in the measured pressure trace.
• Negative pressure wave method: This method is based
on monitoring the pressure for the leak-induced pressure wave [73]. The location of leak can be determined from the wave arrival times and wave speed.
• Sequential probability ratio test: The statistical method
uses flow rate, pressure, and temperature measurements to carry out a sequential probability ratio test (SPRT) [74]. SPRT will find if an increase in flow imbalance happens and pattern recognition needs to be applied to distinguish a leak and operational change.
• Statistical data analysis-based methods: An
autoregres-sive model, which uses two consecutive time sequences of pressure gradients at both ends of the pipeline, was established to detect the leak [75]. The parameters and residual variance of the fitted models are dependent on the condition of the pipeline and reflect the presence of a leak.
• District meter area method: This method conducts a
water audit in district meter areas. Flow and/or pressure sensors are placed on district meter areas’ boundaries. The collected data are analyzed for leakage trends, such as analysis of minimum night flow [76].
b) Model-based methods:
• Real-time transient model-based methods: In this method,
two techniques are considered: one is the deviation anal-ysis and the other is the model compensated volume bal-ance method [77]. In the pressure-flow deviation method, the flow rate and pressure at one boundary can be calcu-lated from the flow rate and pressure values measured at another boundary using the transient simulation model. The calculated values should match the measured values if no leak is present. Discrepancy between measured and calculated values indicates a leak.
The model compensated volume balance approach im-plements a real-time comparison of the measurement generated flow balances and model generated line packing rates, which are computed from measured pressures and temperatures at the end points of pipeline segment with
the model. In case of leakage, the measured flow balance and the model generated line packing will diverge.
• Inverse analysis methods: The inverse analysis methods
include:
– Steady-state inverse analysis: A leak is detected and located by solving an inverse problem using measurements of pressure and/or flow rate [78]. – Inverse transient analysis: This method can be
ap-plied to unsteady flow situation. Responses of tran-sient events are measured and interpreted by cal-culating the model parameters using the inverse method [68].
• State estimation approaches: The flow in pipelines can
be represented by a distributed parameter system, which is implemented with a state estimator or a filter. An ex-tended Kalman filter can be used to estimated leaks [79]. B. Fuzzy Theory based Techniques
1) Fuzzy synthetic evaluation: The fuzzy synthetic
eval-uation is a fuzzy multi-criteria decision-making technique based on fuzzy set theory [5]. The proposed fuzzy synthetic evaluation has three major steps, namely, fuzzification of raw data (measurements of the distress indicators), aggregation of distress indicators towards their respective categories, and defuzzification that expresses the condition rating as a practical crisp measure. The distress indicators can be translated into condition rating with this fuzzy synthetic evaluation technique. The condition rating is expressed as a fuzzy set or possibility function.
2) Fuzzy Markov process: A fuzzy Markov based
deteri-oration model was described in [80]. The condition state is expressed as a fuzzy set (or possibility mass function). For example, the condition of the pipe can be rated in terms of membership values to a seven grade scale: Excellent, Good, Adequate, Fair, Poor, Bad, Failed as illustrated in Fig. 4.
The condition rating (0, 0, 0.2, 0.7, 0.1, 0, 0) means 0.2, 0.7
and0.1 memberships to condition states Adequate, Fair and
Poor, respectively [80]. An example of applying this fuzzy
synthetic evaluation to a96” (2400 mm) prestressed concrete
cylinder pipe (PCCP) is given in Table IV. This PCCP was
installed in 1978 and assumed to be in excellent condition.
The inspections were conducted in 1997, 1999, and 2002,
respectively. In 1997, a visual inspection together with an
impulse echo test was carried out. In 1999 and 2002, remote
field eddy current/transformer coupling (RFEC/TC) test was done. Through the fuzzification, aggregation, and defuzzifica-tion processes described in [5], the condidefuzzifica-tion rating of this pipe segment was obtained as shown in Table IV.
TABLE IV
CONDITION RATINGS OF96” PCCP (MODIFIED FROM[81]).
Year Excellent Good Adequate Fair Poor Bad Failed 1978 0.9 0.1 0 0 0 0 0 1997 0.09 0.85 0.06 0 0 0 0 1999 0.06 0.85 0.09 0 0 0 0 2002 0.06 0.85 0.09 0 0 0 0
The risk of failure is determined jointly by the likelihood (possibility) and the consequences of a failure. The mass
Fig. 4. An example of fuzzy condition rating (cf. [81]).
function describing the risk of failure has nine grade, Ex-tremely low, Very low, Quite low, Moderately low, Medium, Moderately high, Quite high, Very high, and Extremely high. The risk mass function is calculated to obtain the fuzzy risk of failure throughout the life of the pipe.
This approach benefits from the robustness of the Markov process and the flexibility of the rule-based fuzzy techniques to handle imprecise and vague data [82]. In this model, the life of the pipe is discretized into time steps and the Markov process is applied at each time step in two stages [82]. First, the deterioration rate at the specific time step is inferred from the pipe age and condition rate using a fuzzy rule-based algorithm. Second, the condition state of the pipe in the next time step is calculated from present condition state and deterioration rate. Essentially, the deterioration process models the pipes as it gradually undergoes change from better to worse condition states.
3) Fuzzy method for estimation of soil corrosivity: A
fuzzy-based method is proposed to estimate soil corrosivity from soil properties [83]. Soil corrosivity is an important factor contributing to the deterioration of water mains. Three level of soil corrosivity are considered, i.e. noncorrosive, moderately corrosive, and corrosive. Fuzzy membership function for each soil property is used to quantify its affinity to the level of soil corrosivity. These membership values form an evaluation matrix and a weighted vector is developed using pair-wise soil property comparisons. The final classification is determined from the cross product of the weighted vector and the evalu-ation matrix.
4) Fuzzy expert system: A fuzzy expert system was
pro-posed to estimate the soil corrosivity potential (CoP) from soil properties [84]. The framework of the expert system is illustrated in Fig. 5, which fuses the results of a subjective model and an objective model. The subjective model was based on expert knowledge, which was derived from published work on the condition assessment of water mains and revised based on the results of a survey collected from corrosion specialists [84]. The subjective model used selected variables of pertinent soil properties such as soil resistivity, pH, etc. The output was defined as corrosivity potential within the range of [0, 1]. The objective model can be established from field data obtained by inspection.
A set of linguistic rules (IF-THEN) were derived to repre-sent the relationships between system variables. The
relation-Fig. 5. Fuzzy expert system framewrok [84].
ship between backfill soil properties and pipe deterioration rate was established with the model. An sample application
pre-sented in [84] calculated the CoP with3 and 5 input variables,
respectively. The five variables include soil resistivity (Ω cm), pH, redox potential (mV ), sulfides, and moisture. The CoP’s relationship with pipe deterioration was inspected with a linear regression function:
DR= m × CoP + d (2)
where DR is the deterioration rate. m and d are the slope and intercept, respectively. However, due to the lack of field inspection data, only a weak relationship is observed with five input variables.
5) Fuzzy PROMETHEE: Fuzzy PROMETHEE (preference
ranking organization method for enrichment evaluation) is a multi-criteria method, which deals with the appraisal and selection of alternatives based on multiple criteria. Pipe con-dition assessment was regarded as a multi-criteria decision-making problem and a model was developed by using fuzzy PROMETHEE II [85]. This model consists of four and seven condition indicators at first- and second-level, respectively. It can generate a pipe condition index as illustrated in Fig. 6.
Fig. 6. Architecture of fuzzy PROMETHEE model [85].
In the model, load and physical indicators are aggregated
indicators, which can be generated from2nd
level indicators.
The2nd
level indicators as well as the historical breakage can be obtained from water utility. The external corrosion indicator determined by soil corrosivity and corrosion resistance of pipe material. The weight associated with each indicator is deter-mined by an analytic hierarchy process (AHP). This subjective weight method is based on experts opinion. A preference function is defined for each indicator to compute the degree of preference associated to the high breakage risk from two
pipes. With the preference function, pipe condition index can be obtained [85]. A preference function is defined for each indicator, which computes the degree of preference associated to the high breakage risk in pari-wise comparison [85]. A continuous linear function was adopted in PROMETHEE
model. Eventually, net flow φnet(a) of pipe a is calculated
to reflect the breakage risks. A lager φnet indicates a higher
risk.
TABLE V
RANK OF PIPE BREAKAGE RISK WITHPROMETHEE (CF. [85]).
Rank 1 2 3 4
Pipe ID 6 8 5 2 Net flow (φnet) -0.907 -0.825 -0.504 -0.053
Rank 5 6 7 8
Pipe ID 7 1 4 3 Net flow (φnet) 0.091 0.538 0.819 0.841
A example of PROMETHEE model calculation is given in Table V. However, the parameters in the PROMETHEE model are empirically determined and highly reply on experts’ opinions. An more objective procedure is preferred when build the model.
6) Fuzzy composite programming: Fuzzy composite
pro-gramming (FCP) is a mathematical propro-gramming tech-nique that employs a single level normalized/non-normalized distance-based technology to rank a discrete set of solutions based on their distances from an ideal solution. Pipe condition assessment needs to combine completely different variables into an overall condition indicator. This is actually a multiple-criteria decision making (MCDM) problem. The following steps are involved [86]:
• Identify pipe condition indicators;
• Prepare the hierarchical structure of the pipe condition
indicators;
• Obtain weightings for each indicator and decide a balance
factor;
• Normalize all the indicators into scale [0, 1] ;
• Obtain a fuzzy member by using the FCP-based
hierar-chical aggregation process for each pipe;
• Rank the fuzzy numbers.
It should be noted that the FCP method may be sensitive to the weights and balance factors.
7) A spatial decision support system for pipe-break
suscep-tibility analysis: A spatial decision support system (SDSS) for
pipe-break susceptibility analysis was proposed by Sinske et al. [87]. The pipe-break susceptibility analysis model is based on existing pipe-break theory and fuzzy logic modeling of complex and interrelated factors. Three pipe-break causes, i.e. pipe age, air-pocket formation, and tree roots, were considered in the model. Fuzzy logic-based analysis is conducted to determine pipe-break susceptibility.
C. Data Fusion and Machine Learning
The purpose of data fusion is to combine the capabilities of each sensor modality with historic data to provide more accurate and complete information [88], [60]. Three factors should be considered:
• Redundancy of information presented in the sensor
modalities;
• Diversity in the sensor modalities;
• Complimentary sensor modalities.
A definition of data fusion as recommended by the U.S. Department of Defense Joint Directors of Laboratories Data Fusion Sub-panel is [89]: “Data fusion is a multilevel, mul-tifaceted process dealing with the automatic detection, asso-ciation, correlation, estimation, and combination of data and
information from multiple sources”. Data fusion is not limited
to sensory data, rather any analysis benefiting from multi-source information to reduce uncertainties and inaccuracies of the data.
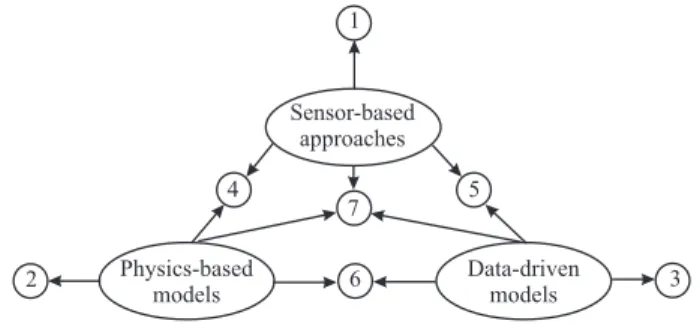
The sources of information can be roughly categorized into three categories: sensor-based approaches, data-driven models, and physics-based models [90]. As illustrated in Fig. 7, the potentials of data fusion numbered from one to seven include:
•
➀
Fuse multi-sensor signal/data, feature, andinforma-tion;
•
➁
Fuse multiple physics-based models;•
➂
Fuse multiple data-driven models;•
➃
Fuse sensor information with physics-based models;•
➄
Fuse sensor information with data-driven models;•
➅
Fuse physics-based and data-driven models;•
➆
Fuse sensor information with physics-based anddata-driven models.
Fig. 7. The potentials of data fusion.
Machine learning used is to identify useful patterns or trends from data and associate the patterns with damage state. When pipe condition assessment is concerned, data mining techniques are applied to predict the residual life, burst rate, and/or leakage based historical records, other attributes (pipe age, diameter, soil type, etc.) [91].
1) Data mining for pipe deterioration prediction: An
ex-ample of soil property analysis with machine learning ap-proaches is presented in [92]. The relationship between soil properties and pipe deterioration, which is defined as the ration of maximum pit depth to pipe age, was established with predictive data mining approaches. Both single- and multi-predictor based approaches were investigated. The detailed studies are illustrated in Fig. 8. Regression tree achieved the best result among the single predictors while rotation forest obtained the overall best. Table VI and Fig. 9 demonstrate the results in details. The better result has a larger adjusted R-square value and smaller mean absolute error (MAE), mean square error (MSE), and normalized MSE (NMSE).
Fig. 8. Prediction of pipe deterioration with data mining approaches.
TABLE VI
COMPARISON OF RESULTS OF REGRESSION TREE AND ROTATION FOREST.
Approaches Adjust R-square MAE MSE NMSE Regression tree 0.33610 0.01049 0.00017 0.58847 Rotation forest 0.87310 0.00470 0.00003 0.11250 0.00 0.02 0.04 0.06 0.08 0.10 0.00 0.02 0.04 0.06 0.08 0.10 Regression Tree
Predicted Value (Unit:mm/year)
True Value
(a) Regression tree
0.00 0.02 0.04 0.06 0.08 0.10 0.00 0.02 0.04 0.06 0.08 0.10 Rotation Forest
Predicted Value (Unit:mm/year)
True Value
(b) Rotation forest
Fig. 9. Prediction of pipe deterioration with (a) single and (b) multiple predictors [92].
2) Hierarchical evidential reasoning: A hierarchical
ev-idential reasoning (HER) model was proposed to combine different distress indicators at different hierarchical levels using the Dempster-Shafer’s (DS) rule of combination [93]. The framework of the HER model is illustrated in Fig. 10. The elements of basic evidence are defined as factors, which will be further aggregated into attributes for more general evidence. Thus, the HER model consists of distress indicators (factor) and evaluation categories (attribute) [5]. The overall condition rating is then obtained by the aggregation of those categories through recursive DS algorithm.
More specifically, an attribute Ek associated with factors
ei
k (i = 1, 2, · · · , Lk) is given by:
Ek= e1k⊕e2k⊕ · · · ⊕e
Lk
k (3)
where Lk is the number of factors associated with k
th
attribute. Symbol ⊕ denotes the DS rule of combination.
Each factor eik is obtained by mapping inspection results to
a predefined condition scale [93]. The overall evaluation is achieved by recursively applying the DS rule to the attributes. The HER model was applied to a cast iron pipe, where internal surface condition, external pipe barrel, external coat-ing, and joint conditions were employed as attributes for the overall condition rating. A corresponding tree map of Fig. 10 is shown in Fig 11, where the factors and attributes for cast
Fig. 10. The framework of hierarchical evidential reasoning ([93]).
iron pipe can be found. The overall rating value is 0.86 for
Fair given(Good, F air, Bad) = (0.06, 0.85, 0.08).
Fig. 11. Hierarchical framework for condition assessment of case iron pipe ([93]).
The most important part of applying DS fusion rule is the definition of basic probability assignment (BPA). The BPA for each factor is derived based on a degree of confidence assigned to these condition states as well as the associated importance and reliability of the data. The HER model has the advantages on dealing with incomplete and conflicting evidence without any assumptions about missing data [93].
3) Incremental learning: LEARN++ is a supervised
learn-ing algorithm that make it possible for a classifier to learn incrementally from new data without forgetting what has been learnt in the earlier training sessions [94]. The current LEARN++ algorithm is implemented for the classification with multilayer perceptron (MLP) neural networks. The idea is to ensemble weak classifiers to achieve an improved per-formance in classification. This makes LEARN++ very useful for the interpretation of pipe inspection data. Inspection data may not be sufficient or good enough when a classifier is being trained. However, the classifier can be further improved when new data is available. Fusion of magnetic flux leak-age, thermography, and ultrasonic data for gas transmission pipeline was described in a technical report [95]. Improved performance for defect identification and characterization was reported.
4) Genetic algorithm: Genetic algorithm (GA) is a search
technique that can be applied in a large, complex, and multi-modal search spaces. It emulates biological principals, such as inheritance, mutation, selection, and crossover, to solve
complex optimization problems. The GA has the ability to locate regions that potentially contain optimal solution for a given problem by searching the solution space [96].
GA was used to search the best scoring model to determine the risks of pipe bursts [97]. The scoring model that is a function of associated characteristics of bursting pipe can be established by analysis of the database of already occurred bursts events. GA was also employed as a search method in the inverse transient technique for leak detection [98]. GA has also been applied to identify the schedule of pipe replacement in a deteriorating water distribution system [99].
D. Artificial Neural Networks
Supervised artificial neural network (ANN) was used to develop a condition rating model for water mains [100]. The condition rating scale is determined by consulting municipal experts and consultants. A numeric scale is assigned to six linguistic descriptions: excellent (9 − 10), very good (8 − 9), good (6 − 8), moderate (4 − 6), poor (3 − 4), and critical
(< 3). A number of factors contributing to the condition of
water mains are considered [100]:
• Soil type;
• Type of road surface;
• Pipe cover;
• Pipe diameter;
• Pipe material;
• Pipe age;
• Number of breaks;
• C-factor (Hazen-William coefficient).
These variables were fed to a NN as illustrated in Fig. 12. With the training data sets, the ANN model was trained to predict the condition of water mains.
Fig. 12. ANN model for condition rating.
A NN model with two 9-node hidden layers was proposed by Achim et al. [101]. Six variables were considered, i.e. pipe diameter, year of construction, age, length, and two geographic coordinates for pipe location. Pipe failure rate
(km/year) was estimated. An improved model using 10 input
variables was suggested by Moselhi et al. [102]. These are pipe
size, age, length, burial depth, temperature, age square (age2),
temperature square (temperature2),ln(length), and ln(depth).
However, pipe size does not have a significant influence on the prediction accuracy according to the report of this study.
The results of the ANN model were compared with vali-dation data. Table VII demonstrates a good performance of
ANN, i.e. 100% are within 12.65% difference. However, a
TABLE VII
VALIDATION RESULTS OFANNMODEL.
Percentage of difference 5% 10% 12.65% percentage of outputs 71.7% 91.7% 100%
successful neural network model needs sufficient historical data for the training purpose. The availability of the data must be ascertained. It is not possible to automatically update the model once it is built, when new data are available.
E. Image Processing for Anomaly Detection
Visual inspection, such as CCTV, presents the results with two-dimensional images, which needs to be analyzed and interpreted. In order to detect the anomalies automatically, the following algorithms were suggested [103]:
• Contrast enhancement: highlight image features;
• Mathematical morphology: recognize crack features;
• Curvature evaluation: segment curvatures.
As the shape of pipes is cylindrical, the acquired images or video sequences need to be unwrapped and stitched so that the processing algorithms can be applied.
In [104], a comprehensive study on defects classification with ensemble methods was reported. Seven classification approaches in combination with five feature extraction and three feature representation methods were investigated for processing CCTV data. Figure 13 illustrates the detailed experiments. The ensemble approach, RotBoost, demonstrated a better performance in terms of classification rate [104].
Fig. 13. Feature extraction, representation, and classification for CCTV inspection images [104].
IV. DECISIONSUPPORTSYSTEMS FORWATERMAIN
RENEWAL
Decision makers can produce short- and long-term renewal plan, which maximizes the effectiveness of the available funds. The decision relies on the information from existing records and site investigation/inspection/test.
The major information comes from existing record and field inspection. As shown in Fig. 14, properly interpreted pipe inspection results provide new information about the condition
Fig. 14. Information sources for decision making.
of the pipe, where the computational techniques described in previous sections can contribute. According to [105], there are four basic steps in the decision making process for pipe renewal (see Fig.15), the first two rely on the results from pipe condition assessment. With the renewal prioritization, appropriate technology is selected and applied accordingly. The decision support system should be able to support long-term planning and budget settings in relation to pipeline management and maintenance [106].
Fig. 15. Procedure of pipe renewal in a decision support system.
A. Expert system and agent technology for decision making A tool to support the decision making for water mains rehabilitation was prototyped with an agent-based technol-ogy [107]. The agent is open to extension and interpretation as an information processing system. The schematic of a tightly coupled agent-based decision support tool is shown in Fig. 16. Seven agents were introduced to the decision making tool. The functionalities of each agent are [107]:
• Interface agent: coordinate the interactions of the user
with the decision support tool.
• Constraints agent: reason about the viability of any
ten-tative rehabilitation decision on the basis of policy type factors.
• Data mining agent: add further data reclamation facilities.
• Strategy agent: perform specific ranking processes on
information about water supply zones.
• Heuristic agent: reason over current task information
using knowledge that represents statistical models or other form of expert advice.
• Information agent: exchange information with all the
other agents, request further information from or deposit new information with the database agent.
• Database agent: store the information.
This framework was partially implemented for water main rehabilitation strategy. The information, including statistical survey of pipe samples from condition assessment, was fed into a “Predictor” agent and “Strategy” agent to predict the life expectancy of a water main [107].
Fig. 16. Agent-based decision support tool.
The prototype system is capable of modeling the infor-mation handling expertise of water company engineers and consultants. It has been used to serve a U.K. water company for water main rehabilitation decision making.
B. Risk-based decision support system for the rehabilitation management of water pipelines
In the WATERPIPE project, a risk-based decision support system was developed [108]. Inspection results from leak and damage detection are used as input to the decision support system. This decision support system (DSS) considers the overall risk as well as financial and social criteria. Four modules were developed as show in Table VIII.
TABLE VIII
MODULES IN THEDECISIONSUPPORTSYSTEM.
Module Module outputs (as a function of time) Structural reliability module Probability of horizontal fractures;
Crushing failure; Vertical fractures Joint failure
Ring buckling of plastic pipes Leakage module Leakage per hour (average value and
standard deviation) Water contamination module Probability of hygienic
Aesthetic water quality failure Risk-based rehabilitation
mod-ule
Rehabilitation decision
The first three modules provide a stochastic assessment of structural reliability of damaged water pipelines, leakage of water pipelines, and time-dependent water quality, respec-tively. The three modules provide the required inputs to the risk-based rehabilitation module. Rehabilitation decisions are
based on the performance of the system. Two measures of system performance are considered: asset performance indi-cators and service performance indiindi-cators, which are given in Table IX.
TABLE IX
SYSTEM PERFORMANCE INDICATORS CONSIDERED INWATERPIPE
PROJECT.
Asset performance indicators Service performance indicators - Bursts - Interruption of supply - Ring buckling of a plastic pipe - Water quality - Leakage
An expert system coordinates the various modules of the DSS and maintains the domain knowledge and relevant databases. The DSS provides results to the end user through an user interface. The end user can estimate the status of the water pipe network. The DSS answers questions like which pipeline should be rehabilitated and when to schedule the next inspection for specific pipelines.
V. CONCLUDINGREMARKS
Management of modern urban infrastructures needs both advanced sensing technologies and computational intelligence to reach optimal decision making from collected information. Computational intelligence facilitates the flow of information from raw inspection and sensory data to the condition rating of water mains. The rating can be subsequently used in data-driven or physics-based failure models for risk analysis. Through the model fusion and knowledge based reasoning, a renewal and rehabilitation decision can be made according to the derived prediction of future condition. Thus, the tran-sition from time-based maintenance to a more cost-effective condition-based maintenance becomes possible. This paper summarizes the major computational approaches for pipe leak detection and monitoring, distress indicator generating, and condition rating. Although pipes with low cost of failure do not justify expensive data acquisition campaigns and acquisi-tion of high-cost data is justified only to major transmission water mains, the amount of aggregate data is still increasing. Therefore, the computational techniques should make full use of all information and raw data to achieve a highly reliable condition assessment of water mains.
REFERENCES
[1] Z. Liu, Y. Kleiner, B. Rajani, L. Wang, and W. Condit, “Condition assessment technologies for water transmission and distribution sys-tems,” U.S. Environmental Protection Agency, Cincinnati, OH, USA, Technical Report EP-C-05-057, March 2012.
[2] U.S. EPA, “Innovation and research for water infrastructure for the 21st
century research plan,” U.S. Environmental Protection Agency, Tech. Rep. EPA/600/X-09/003, April 2007.
[3] S. Kim, M. Torbol, and P. H. Chou, “Remote structural health mon-itoring systems for next generation SCADA,” Smart Structures and
Systems, vol. 11, no. 5, pp. 511–531, May 2013.
[4] C. R. Farrar and K. Worden, Eds., Structural Health Monitoring: A
Machine Learning Perspective. West Sussex, United Kingdom: Wiley-Interscience, John Wiley & Sons, Inc., 2013.
[5] B. Rajani, Y. Kleiner, and R. Sadiq, “Translation of pipe inspection results into condition ratings using the fuzzy synthetic evaluation technique,” Journal of Water Supply Research and Technology, vol. 55, no. 1, pp. 11–24, 2006, translation of Pipe Inspection Results into Condition Ratings Using the Fuzzy Synthetic Evaluation Technique.
[6] Y. Kleiner and B. B. Rajani, “Comprehensive review of structural deterioration of water mains: Statisticalmodels,” Urban Water, vol. 3, no. 3, pp. 131–150, October 2001.
[7] Y. Kleiner and B. Rajani, “Comprehensive review of structural deteri-oration of water mains: Statistical models,” Urban Water, vol. 3, no. 3, pp. 131–151, 2001, comprehensive Review of Structural Deterioration of Water Mains: Statistical Models.
[8] B. Nestleroth, S. Flamberg, W. Condit, J. M. Battelle, L. Wang, and A. Chen, “Field demonstration of innovative condition assessment technologies for water mains: Leak detection and location,” U.S. Environmental Protection Agency, Cincinnati, Ohio 45268, Technical Report EP-C-05-057, March 2012.
[9] J. Thomson and L. Wang, “State of technology review report on condition assessment of ferrous water transmission and distribution systems,” U.S. Environmental Protection Agency, Cincinnati, OH, USA, Tech. Rep. EP-C-05-057, June 2009.
[10] D. Marlow, S. Heart, S. Burn, A. Urquhart, S. Gould, M. Anderson, S. Cook, M. Ambrose, B. Madin, and A. Fitzgerald, “Condition assess-ment strategies and protocols for water and wastewater utility assets,” Awwa Research Foundation, Tech. Rep., 2007, condition Assessment Strategies and Protocols for Water and Wastewater Utility Assets. [11] Z. Liu and Y. Kleiner, “State of the art review of technologies for pip
inspection,” Measurement, vol. 46, no. 1, pp. 1–15, January 2013. [12] Hydraomax, “Sset inspection: Side scanning evaluation technology,”
http://www.hydromaxusa.com/SSET.htm, 2006.
[13] RapidView, “Panoramo 3d optical scanner,” http://www.rapidview.com/ panoramo.htm, 2007.
[14] RedZone, “2D vs 3D lasers in large pipes,” http://www.redzone.com, retrieved June 2011.
[15] Creaform, http://www.creaform3d.com.
[16] J. W. Wilson, M. Kaba, and G. Y. Tian, “New techniques for the quantification of defects through pulsed magnetic flux leakage,” in
Proceedings of 17th
World Conference on Nondestructive Testing, Shanghai, China, 2008.
[17] B. Crouse, “Ndt resource center,” http://www.ndt-ed.org, 2009. [18] B. Mergelas and X. Kong, Electromagnetic Inspection of Prestressed
Concrete Pressure Pipe. Awwa Research Foundation and American Water Works Association, 2001, electromagnetic Inspection of Pre-stressed Concrete Pressure Pipe.
[19] Russell, “See snake brochure,” 2009, see Snake Brochure.
[20] C. S. Feeney, S. Thayer, M. Bonomo, and K. Martel, “State of tech-nology review report on condition assessment of wastewater collection systems,” Cincinnati, Ohio, USA, Tech. Rep., 2009, state of Technology Review Report on Condition Assessment of Wastewater Collection Systems.
[21] C. Waters, “Rtd-incotest- for the detection of corrosion under insulation,” http://www.pndt.com.au/files/brochure/40 INCOTESTTechnicalPaper.pdf, 2005.
[22] MB, “Pulsed eddy current system - incotest,” http://www.mbinspection. co.uk/index/incotest, 2008.
[23] S. B. Costello, D. N. Chapman, C. D. F. Rogers, and N. Metje, “Underground asset location and condition assessment technologies,”
Tunnelling and Underground Space Technology, vol. 22, pp. 524– 542, 2007, underground Asset Location and Condition Assessment Technologies.
[24] O. Hunaidi and P. Giamou, “Ground-penetrating radar for detection of leaks in buried plastic water distribution pipes,” Lawrence, Kansas, USA, 1998, 7th International Conference on Ground-Penetrating Radar. [25] WATERPIPE, “Integrated high resolution imaging ground penetrating radar and decision support system for water pipeline rehabilitation,” http://www.waterpipe-eu.org, 2009.
[26] E. N. Allouche, “Computer aided tomography: Inspecting buried struc-tures from inside out,” New Orleans, USA, 2007, 2007.
[27] A. Jaganathan, E. Allouche, and N. Simicevic, “Pipeline scanning: Novel technology for detection of voids and internal defects in non-conductive buried pipes,” pp. 1–8, 2006, access Date.
[28] CUES, “Sonar profiler system for submerged and semi-submerged pipes,” http://www.cuesinc.com/Sonar-Profiler.html, 2008.
[29] RedZone, “Multi-frequency sonar: Fine tuning your pipe inspection system,” http://www.redzone.com/education/multi-frequency-sonar, 2008.
[30] D. A. Sack and L. D. Olson, “Impact echo testing of in-situ precast concrete cylinder pipe.” San Diego, CA, USA: American Society of Civil Engineers, 1998, 1998.
[31] M. J. Sansalone and W. B. Streett, “The impact-echo method,” http: //www.ndt.net/article/0298/streett/streett.htm, 1998.
[32] PureTechnologies, “Smartball for water leak detection,” http://www. puretechnologiesltd.com/html/smartball water.php, 2009.
[33] S. T. Ariaratnam and M. Chandrasekaran, “Development of a free-swimming acoustic tool for liquid pipeline leak detection including evaluation for natural gas pipeline applications,” Arizona State Uni-versity and Pure Technologies Limited, Technical Report DTPH56-07-BAA-000002, August 2010, prepared for US DPT PHMSA. [34] B. Mergelas and G. Henrich, “Leak locating method for
pre-commissioned transmission pipelines: North american case studies,” Halifax, Canada, 2005, leakage 2005.
[35] PPIC, “Transmission main leak location (sahara),” http://www.ppic. com/home/sahara overview print.html, 2006.
[36] O. Hunaidi, A. Wang, M. Bracken, T. Gambino, and C. Fricke, “Acous-tic methods for locating leaks in municipal water pipe networks,” Dead Sea, Jordan, 2004, international Conference on Water Demand Management.
[37] O. Hunaidi, “Non-destructive testing of pipes,” USA, 2006, non-Destructive Testing of Pipes.
[38] J. L. Rose, J. Mu, and Y. Cho, “Recent advances on guided waves in pipe inspection,” Shanghai, China, 2008, october 2008.
[39] W. Luo and J. L. Rose, “Guided wave thickness measurement with EMATs,” Insight, vol. 45, no. 11, pp. 1–5, November 2003. [40] J. Bosch, A. Hugger, J. Franz, and S. Falter, “Phase array technology
for automated pipeline inspection,” Business Briefing: Exploration and
Production - The Oil & Gas Review, pp. 1–4, 2004.
[41] R/D Tech Corp., “Phased array technical guidelines: Useful formulas, graphs, and examples.”
[42] M. Beller and A. Barbian, “Combined in-line inspection of pipelines for metal loss and cracks,” Berlin, Germany, 2006, european Conference on Nondestructive Testing.
[43] Inversa Systems, “Backscatter computed tomography,” http://www. inversasystems.com, retrieved in December 2011.
[44] X. P. V. Maldague, Theory and Practice of Infrared Technology for
Nondestructive Testing, ser. Wiley Series in Microwave and Optical Engineering, K. Chang, Ed. John Wiley and Sons, Inc., 2001. [45] ANSI/AWWA C105/A21.5-99, American National Standard for
Polyethylene Encasement for Ductile-IronPipe Systems, American Wa-ter Works Association, 1999.
[46] Metalogic, http://www.metalogic.be/, 2003.
[47] B. Spickelmire, “Corrosion consideration for ductile iron pipe,”
Mate-rials Performance, vol. 41, pp. 16–23, 2002.
[48] Z. Liu and Y. Kleiner, “State of the art review of technologies for pipe structural health monitoring,” IEEE Sensors Journal, vol. 12, no. 6, pp. 1987–1992, June 2012.
[49] G. E. C. Bell and C. G. Moore, “Development and application of ductile iron pipe electrical resistance probes for monitoring under-ground external pipeline corrosion.” NACE International, 2007, recent Development and Field Experience in Corrosion and Erosion Monitoring.
[50] M. S. Higgins and P. Paulson, “Fiber optic sensor for acoustic moni-toring of pccp,” Chicago, Illinois, USA, 2006, pipelines 2006 - Service to the Owner.
[51] H. Kwun, “Back in style: Magnetostrictive sensors,” http://www.swri. org/3pubs/brochure/d17/magneto/magneto.htm, 1991.
[52] ——, “Technical background on mss,” Tech. Rep., 2000, technical Background on MsS.
[53] H. Kwun, S. Kim, and G. M. Light, “The magnetrostrictive sensor technology for long range guided wave testing and monitoring of structures,” Materials Evaluation, vol. 61, pp. 80–84, 2003, the Mag-netrostrictive Sensor Technology for Long Range Guided Wave Testing and Monitoring of Structures.
[54] A. E. Crouch and T. H. Goyen, “Defect assessment using conformable array data,” San Antonio, USA, Tech. Rep., 2003, defect Assessment Using Conformable Array Data.
[55] X. Chen and T. Ding, “Flexible eddy current sensor array for proximity sensing,” Sensors and Actuators, vol. 135, pp. 126–130, 2007, flexible Eddy Current Sensor Array for Proximity Sensing.
[56] M. Kobayashi, C.-K. Jen, and D. Levesque, “Flexbible ultrasonic transducers,” IEEE Transactions on Ultrasonics, Ferroelectrics, and
Frequency Control, vol. 53, no. 8, pp. 1478–1486, 2006, flexbible Ultrasonic Transducers.
[57] M. Kobayashi, C. K. Jen, J. F. Bussiere, and K. T. Wu, “High temperature integrated and flexible ultrasonic transducers for non-destructive testing,” NDT & E International, vol. 42, pp. 157–161, 2009, high Temperature Integrated and Flexible Ultrasonic Transducers for Non-Destructive Testing.
[58] M. J. S. Lowe and P. Cawley, “Long range guided wave inspection usage current commercial capabilities and research directions,” Depart-ment of Mechanical Engineering, Imperial College London, Technical Report, March 2006.
[59] A. Galvagni and P. Cawley, “Guided wave permanently installed pipeline monitoring system,” in Review of Progress in Quantitative
NDE, D. O. Thompson and D. E. Chimenti, Eds., vol. 31, Burlington, Vermont, USA, July 2011.
[60] T. Juliano, J. Meegoda, E. Niver, and D. Watts, “A conceptual frame-work for intelligent monitoring systems.” SPIE, 2005, 2005. [61] R. Munser, M. RoBner, M. Hartrumpf, and H. B. Kuntze,
“Mi-crowave back-scattering sensor for the detection of hidden material inhomogeneities e.g. pipe leakages,” Nuremberg, Germany, 1999, 9th International Trade Fair and Conference for Sensors, Transducers and Systems.
[62] S. Cauchi, T. Cherpillod, D. Morison, and E. McClarty, “Fiber-optic sensors for monitoring pipe bending due to ground movement,”
Pipeline & Gas Journal, vol. January, pp. 36–40, 2007, fiber-Optic Sensors for Monitoring Pipe Bending due to Ground Movement. [63] D. Misiunas, “Failure monitoring and asset condition assessment in
water supply systems,” Ph.D. dissertation, Lund University, 2005, failure Monitoring and Asset Condition Assessment in Water Supply Systems.
[64] MathWorks, “Thames water aims to reduce leaks by more than 25% using a matlab-based leak-location system,” 2007, retrieve Date. [65] Y. Jiao, Q. Yang, and G. Li, “Leak identification method for buried
gas pipeline based on spatial-temporal data fusion,” in Control and
Automation, 2007. ICCA 2007. IEEE International Conference on, Guangzhou, China, May 2007, pp. 774–777, 2007.
[66] S. R. Mouncea, A. Khan, A. S. Woodb, A. J. Dayb, P. D. Widdopb, and J. Machellc, “Sensor-fusion of hydraulic data for burst detection and location in a treated water distribution system,” Information Fusion, vol. 4, no. 3, pp. 217–229, 2003, sensor-fusion of hydraulic data for burst detection and location in a treated water distribution system. [67] B. Brunone, “Transient test-based technique for leak detection in outfall
pipes,” Journal of Water Resources Planning and Management, vol. 125, no. 5, p. 302306, 1999.
[68] J. Liggett and L. C. Chen, “Inverse transient analysis in pipe networks,”
ASCE Journal of Hydraulic Engineering, vol. 120, no. 8, pp. 934–955, 1994.
[69] J. Liou, “Pipeline leak detection by impulseresponse extraction,” ASCE
Journal of Fluids Engineering, vol. 120, no. 4, pp. 833–838, 1998. [70] X. J. Wang, M. Lambert, A. Simpson, J. Liggett, and J. Vitkovsky,
“Leak detection in pipeline systems using the damping of fluid tran-sients,” ASCE Journal of Hydraulic Engineering, vol. 128, no. 7, pp. 697–711, 2002.
[71] J. Liou, “Mass imbalance error of waterhammer equations and leak detection,” ASCE Journal of Fluids Engineering, vol. 116, no. 1, pp. 103–108, 1994.
[72] R. S. Whaley, R. E. Nicolas, and J. V. Reet, “A tutorial on software based leak detection methods,” Pipeline Simulation Interest Group, Tech. Rep., 1992.
[73] R. Silva, C. Buiatti, S. Cruz, and J. Pereira, “Pressure wave behaviour and leak detection in pipelines,” Computers & Chemical Engineering, vol. 20, no. 6, pp. 491–496, 1996.
[74] J. Zhang, “Statistical pipeline leak detection for all operating condi-tions,” Pipeline & Gas Journal, pp. 42–55, 2001.
[75] G. Wang, D. Dong, and C. Fang, “Leak detection for transport pipelines based on autoregressive modeling,” IEEE Transactions on
Instrumentation and Measurement, vol. 42, no. 1, pp. 68–71, 1993. [76] A. Lambert, “Assessing non-revenue water and its components: a
practical approach,” Water 21. Magazine of the International Water
Association, pp. 50–51, August 2003.
[77] E. Wylie, “The mircocomputer and pipeline transients,” ASCE Journal
of Hydraulic Engineering, vol. 109, no. 12, pp. 1723–1739, 1983. [78] R. Pudar and J. Liggett, “Leaks in pipe networks,” ASCE Journal of
Hydraulic Engineering, vol. 118, no. 7, pp. 1031–1046, 1992. [79] A. Benkherouf and A. Allidina, “Leak detection and location in gas
pipelines,” IEE Proceedings D - Control Theory and Applications, vol. 135, no. 2, pp. 142–148, 1988.
[80] Y. Kleiner, R. Sadiq, and B. B. Rajani, “Modelling the deterioration of buried infrastructure as a fuzzy markov process,” Journal of Water
Supply Research and Technology, vol. 55, no. 2, pp. 67–80, 2006, modelling the Deterioration of Buried Infrastructure as a Fuzzy Markov Process.
[81] Y. Kleiner, B. Rajani, and R. Sadiq, “Modeling deterioration and managing failure risk of buried critical infrastructure,” 2006, building Science Insight 2006 Sustainable Infrastructure: Techniques, Tools and Guidelines.
[82] ——, “Risk management of large-diameter water transmission mains,” Denver, USA, Tech. Rep., 2005, risk Management of Large-Diameter Water Transmission Mains.
[83] R. Sadiq, B. Rajani, and Y. Kleiner, “Fuzzy-based method to evaluate soil corrosivity for prediction of watermain deterioration,” Journal of
Infrastructure Systems, vol. 10, no. 4, pp. 149–156, December 2004. [84] H. Najjaran, R. Sadiq, and B. Rajani, “Fuzzy expert system to assess
corrosivity of cast/ductile iron pipes frombackfill properties,” Computer
Aided Civil and Infrastructure Engineering, vol. 21, no. 1, pp. 67–77, January 2006.
[85] Y. Zhou, K. Vairavamoorthy, and F. Grimshaw, “Development of a fuzzy based pipe condition assessment model using PROMETHEE,” Kansas City, Missouri, USA, 2009, the 29th World Environmental & Water Resources Congress.
[86] K. Vairavamoorthy, S. D. Gorantiwar, J. Yan, H. M. Galgale, M. A. Mohamed-Mansoor, and S. Moban, Risk Assessment of Contaminant
Intrusion into Water Distribution Systems. Leicestershire, UK: Water, Engineering and Development Cetre, Loughborough University, 2006, 1-84380-102-7.
[87] S. A. Sinske and H. L. Zietsman, “A spatial decision support system for pipe-break susceptibility analysis of municipal water distribution systems,” Water SA, vol. 30, no. 1, pp. 71–79, 2004, a Spatial Decision Support System for Pipe-Break Susceptibility Analysis of Municipal Water Distribution Systems.
[88] Z. Liu, D. S. Forsyth, J. P. Komorroski, K. Hanasaki, and K. Kiruba, “Survey: State of the art of NDE data fusion,” IEEE Transactions
on Instrumentation and Measurement, vol. 56, no. 6, pp. 2435–2451, December 2007.
[89] L. A. Klein, Sensor and Data Fusion Concepts and Applications. Bellingham, WA, USA: Society of Photo-Optical Instrumentation En-gineers (SPIE), 1999.
[90] Z. Liu and N. Mrad, “Data fusion for the diagnostics, prognostics, and health management of aircraft systems,” in Proceedings of the First
International Conference on Cognitive Systems and Information Pro-cessing: Foundations and Practical Applications of Cognitive Systems and Information Processing, ser. Advances in Intelligent Systems and Computing, F. Sun, D. Hu, and H. Liu, Eds., Beijing, China, December 2012.
[91] D. A. Savic and G. A. Walters, “Hydroinformatics, data mining and maintenance of uk water networks,” Anti-Corrosion Methods and
Materials, vol. 46, no. 6, pp. 415–425, 1999, hydroinformatics, Data Mining and Maintenance of UK Water Networks.
[92] Z. Liu, R. Sadiq, B. Rajani, and H. Najjaran, “Exploring the relation-ship between soil properties and deterioration of metallic pipes using predictive data mining methods,” ASCE Journal of Computing in Civil
Engineering, vol. 24, no. 3, pp. 289–301, May/June 2010.
[93] H. Bai, R. Sadiq, H. Najjaran, and B. Rajani, “Condition assessment of buried pipes using hierarchical evidential reasoning model,” Journal
of Computing in Civil Engineering, vol. 22, no. 2, pp. 114–122, 2008. [94] R. Polikar, L. Upda, S. Upda, and V. Honavar, “Learn++: an incremen-tal learning algorithm for supervised neural networks,” Systems, Man,
and Cybernetics, Part C: Applications and Reviews, IEEE Transactions on, vol. 31, no. 4, pp. 497–508, Nov 2001.
[95] S. Mandayam, R. Polikar, and J. C. Chen, “A data fusion system for the nondestructive evaluation of non-piggable pipes,” Rowan University, Glassboro, NJ, USA, Tech. Rep., 2006.
[96] D. Shaw, J. Mile, and A. Gray, “Genetic programming within civil engineering,” Clifton, Bristol, UK, 2004, organization of the Adaptive Computing in Design and Manufacture 2004 Conference.
[97] V. Babovic, J. Drcourt, M. Keijzer, and P. F. Hansen, “A data mining approach to modelling of water supply assets,” Urban Water, vol. 4, pp. 401–414, 2002, a Data Mining Approach to Modelling of Water Supply Assets.
[98] J. P. Vitkovsky, A. R. Simpson, and M. F. Lambert, “Leak detection and calibration using transients and genetic algorithm,” Journal of Water
Resources Planning and Management, no. July/August, pp. 262–265, 2000, leak Detection and Calibration Using Transients and Genetic Algorithm.
[99] G. C. Dandy and M. Engelhardt, “Optimal scheduling of water pipe replacement using genetic algorithms,” Journal of Water Resources
Planning and Management, vol. 127, no. 4, pp. 214–223, 2001, optimal Scheduling of Water Pipe Replacement Using Genetic Algorithms.
[100] H. Al-Barqawi and T. Zayed, “Condition rating model for underground infrastructure sustainable water mains,” Journal of Performance of
Constructed Facilities, vol. 20, no. 2, pp. 126–135, 2006, condition Rating Model for Underground Infrastructure Sustainable Water Mains. [101] D. Achim, D. Ghotb, and K. J. McManus, “Prediction of water pipe asset life using neural networks,” Journal of Infrastructure Systems, vol. 13, no. 1, pp. 26–30, 2007, prediction of Water Pipe Asset Life Using Neural Networks.
[102] O. Moselhi and M. Fahmy, “Discussion of ”prediction of water pipe asset life using neural networks” by d. achim, f. ghotb, and k. j. mcmanus,” Journal of Infrastructure Systems, vol. 14, no. 3, pp. 272– 273, 2008, discussion of ”Prediction of Water Pipe Asset Life Using Neural Networks” by D. Achim, F. Ghotb, and K. J. McManus. [103] S. Iyer and S. K. Sinha, “Automated condition assessment of buried
sewer pipes based on digital imaging techniques,” Journal of Indian
Institute of Science, vol. 85, pp. 235–252, 2005, automated Condition Assessment of Buried Sewer Pipes based on Digital Imaging Tech-niques.
[104] W. Wu, Z. Liu, and Y. He, “Classification of defects with ensemble method in automated visual inspection of sewer pipes,” Pattern Analysis
and Applications, December 2013.
[105] D. K. Arun, H. J. Yakir, S. M. Heidi, S. K. Jerry, G. V. Loganathan, and P. Khambhammettu, “Decision support system for distribution system piping renewal,” Denver, CO, USA, Tech. Rep., 2002, decision Support System for Distribution System Piping Renewal.
[106] M. Moglia, S. Burn, and S. Meddings, “Decision support system for water pipeline renewal prioritisation,” ITcon, vol. 11, pp. 237– 256, 2006, decision Support System for Water Pipeline Renewal Prioritisation.
[107] D. Davis and B. Sharp, “The application of expert system and agent technology to water mains rehabilitation decision making,” New Review
of Applied Expert Systems, vol. 5, pp. 5–18, 1999, the Application of Expert System and Agent Technology to Water Mains Rehabilitation Decision Making.
[108] WATERPIPE, “3rd waterpipe newsletter,” http://www.waterpipe-eu. org, 2009.
Zheng Liu received a doctorate in engineering from Kyoto University, Japan, in 2000 and earned a Ph.D. in electrical engineering from University of Ottawa in 2007. From 2001 to 2012, he was with the National Research Council (NRC) Canada, Ottawa as a research officer. Dr. Liu is currently a professor at the Toyota Technological Institute Japan. He also holds an adjunct professorship at the University of Ottawa. His research interests include image/data fusion, computer vision, pattern recognition, sen-sor/sensor network, structural health monitoring, and nondestructive inspection and evaluation. He is a senior member of the IEEE and a member of SPIE and IPSJ.
PLACE PHOTO HERE
Yehuda Kleiner is the group leader of the buried utilities research group and principal research officer at National Research Council Canada. Dr. Kleiner has been involved in developing methodologies for analysis and decision optimisation of water distribu-tion and sewer systems rehabilitadistribu-tion and renewal. He has authored and co-authored many papers and reports related to these subjects, some of which evolved into public/commercial computer applica-tions.
Prior to his current research position he has gained substantial international experience in the design, planning and analysis of urban, rural and agricultural water supply, sewage, drainage and irrigation systems, working for engineering consulting firms and equipment manufac-turers. He earned his B.Sc. and M.Sc. from the Technion - Israel Institute of Technology, and his Ph.D. from University of Toronto.

![Fig. 2. Summary of active technologies for leak detection and monitor- monitor-ing [63].](https://thumb-eu.123doks.com/thumbv2/123doknet/14098045.465267/4.918.483.827.81.206/fig-summary-active-technologies-leak-detection-monitor-monitor.webp)
![Fig. 4. An example of fuzzy condition rating (cf. [81]).](https://thumb-eu.123doks.com/thumbv2/123doknet/14098045.465267/6.918.460.841.84.291/fig-example-fuzzy-condition-rating-cf.webp)
![Fig. 10. The framework of hierarchical evidential reasoning ([93]).](https://thumb-eu.123doks.com/thumbv2/123doknet/14098045.465267/8.918.83.442.338.597/fig-framework-hierarchical-evidential-reasoning.webp)