Publisher’s version / Version de l'éditeur:
Vous avez des questions? Nous pouvons vous aider. Pour communiquer directement avec un auteur, consultez la première page de la revue dans laquelle son article a été publié afin de trouver ses coordonnées. Si vous n’arrivez pas à les repérer, communiquez avec nous à PublicationsArchive-ArchivesPublications@nrc-cnrc.gc.ca.
Questions? Contact the NRC Publications Archive team at
PublicationsArchive-ArchivesPublications@nrc-cnrc.gc.ca. If you wish to email the authors directly, please see the first page of the publication for their contact information.
https://publications-cnrc.canada.ca/fra/droits
L’accès à ce site Web et l’utilisation de son contenu sont assujettis aux conditions présentées dans le site LISEZ CES CONDITIONS ATTENTIVEMENT AVANT D’UTILISER CE SITE WEB.
2007 Canadian Acoustical Association Conference [Proceedings], pp. 1-2,
2007-10-09
READ THESE TERMS AND CONDITIONS CAREFULLY BEFORE USING THIS WEBSITE.
https://nrc-publications.canada.ca/eng/copyright
NRC Publications Archive Record / Notice des Archives des publications du CNRC :
https://nrc-publications.canada.ca/eng/view/object/?id=be84de7d-02d9-40da-90ef-72eba9d895f8 https://publications-cnrc.canada.ca/fra/voir/objet/?id=be84de7d-02d9-40da-90ef-72eba9d895f8
NRC Publications Archive
Archives des publications du CNRC
This publication could be one of several versions: author’s original, accepted manuscript or the publisher’s version. / La version de cette publication peut être l’une des suivantes : la version prépublication de l’auteur, la version acceptée du manuscrit ou la version de l’éditeur.
Access and use of this website and the material on it are subject to the Terms and Conditions set forth at
Statistical basis for rating speech privacy of closed rooms
http://irc.nrc-cnrc.gc.ca
S t a t i s t i c a l b a s i s f o r r a t i n g s p e e c h p r i v a c y o f
c l o s e d r o o m s
N R C C - 5 0 0 8 9
G o v e r , B . N . ; B r a d l e y , J . S .
A version of this document is published in / Une version de ce document se trouve dans: 2007 Canadian Acoustical Association Conference, Montreal, QC., Oct. 9-12, 2007, pp. 1-2
The material in this document is covered by the provisions of the Copyright Act, by Canadian laws, policies, regulations and international agreements. Such provisions serve to identify the information source and, in specific instances, to prohibit reproduction of materials without written permission. For more information visit http://laws.justice.gc.ca/en/showtdm/cs/C-42
Les renseignements dans ce document sont protégés par la Loi sur le droit d'auteur, par les lois, les politiques et les règlements du Canada et des accords internationaux. Ces dispositions permettent d'identifier la source de l'information et, dans certains cas, d'interdire la copie de documents sans permission écrite. Pour obtenir de plus amples renseignements : http://lois.justice.gc.ca/fr/showtdm/cs/C-42
S
TATISTICAL BASIS FOR RATING SPEECH PRIVACY OF CLOSED ROOMSBradford N. Gover and John S. Bradley
Institute for Research in Construction, National Research Council, Ottawa, ON K1A 0R6, Canada brad.gover@nrc-cnrc.gc.ca
1. INTRODUCTION
The degree of privacy offered by a closed room is an indication of how audible or intelligible conversations occurring within are in the adjoining spaces. This depends not only on the passive sound insulation provided by the building, but also on the levels of speech and background noise. The sound insulation is a fixed physical quantity that can be measured, but the speech and noise levels fluctuate from moment to moment: they are statistical quantities. The degree of privacy can therefore be described in a “risk” sense, where a particular level of sound insulation will be associated with a certain probability of a privacy lapse, when speech levels are high and/or noise levels are low. This paper describes results from using measured statistical distributions of speech and noise levels to rate and predict the privacy of closed rooms [1].
2. SPEECH
PRIVACY
METHOD
Previous investigations have identified a signal-to-noise index that is well correlated with the intelligibility of speech transmitted through walls [2]. This index (SNRUNI32) is the arithmetic average (i.e., uniformly-weighted sum) of the 1/3-octave band level differences of speech (LS,Rec) and noise (LN) at the listening position, over the 16 bands from 160 to 5k Hz:
=
∑
[
−
− kHz Hz N Rec S UNIL
f
L
f
SNR
5 160 32dB , 32(
)
(
)
16
1
]
. (1) The subscript –32dB indicates that the quantity in brackets is to be clipped to a minimum of –32 dB.The speech level at the listening position LS,Rec can be determined from the speech level inside the closed room LS and a measure of the sound insulation to the listening position, LD. In each 1/3-octave band, LD(f) is the difference in levels between a diffuse-field average test noise field in the closed room and the corresponding received level at the listening position. This is measured using broadband noise, several loudspeaker and microphone positions within the room, and microphones at receiving positions in the adjoining spaces, usually 0.25 m from the boundaries of the room [3].
Substituting LS,Rec = LS – LD into Eq. (1), the expression for the index becomes
[
]
∑
−
−
−=
kHz Hz N S UNIL
f
LD
f
L
f
SNR
5 160 dB 32 32(
)
(
)
(
)
16
1
(2) which, by ignoring the –32 dB limit and summing the terms individually, can be written32
)
(
)
(
)
(
N UNIS
avg
L
avg
LD
avg
SNR
L
−
=
+
, (3)where “(avg)” indicates the arithmetic average of 1/3-octave band values from 160 to 5k Hz. LD(avg), then, is a single-number indicator of the sound insulation. Through the index SNRUNI32, Eq. (3) relates the difference between average speech level inside the closed room and the background noise level at the listening position outside the room, to the sound insulation.
By setting SNRUNI32 = –16 dB (which is the threshold of intelligibility, where 50% of listeners could correctly identify at least one word) Eq. (3) becomes
dB
16
)
(
)
(
)
(
avg
−
L
avg
=
LD
avg
−
L
S N . (4)For given speech and noise levels, Eq. (4) indicates the required LD(avg) to obtain threshold conditions. That is, the minimum required sound insulation to ensure speech privacy. Conversely, for a known LD(avg), Eq. (4) indicates speech and noise level combinations that result in threshold conditions.
3.
SPEECH AND NOISE LEVELS
The cumulative distribution functions of speech and noise levels can be used to determine the probability that the speech will be loud enough and the noise will simultaneously be quiet enough so that speech will be intelligible. This probability then can be used in rating the speech privacy.
Fig. 1 shows the cumulative probability of occurrence of speech and noise levels (10 s Leq) measured for a large range
of meetings in different buildings [4]. It indicates that 10% of the time the speech level was higher than 64 dBA, and 10% of the time the noise level was lower than 33 dBA. Assuming independence, the joint probability of speech exceeding 64 dBA and the noise simultaneously being lower than 33 dBA was 1%. By assuming reasonable spectral shapes for the speech and noise (to convert dBA to dB(avg))
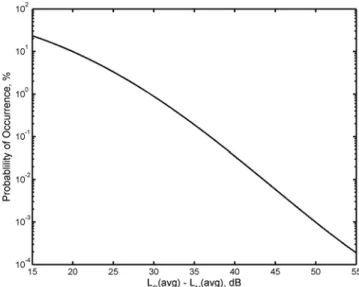
the data in Fig. 1 are converted to yield Fig. 2. The horizontal axis is the difference between the average speech level in the closed room and the average noise level at the listening position outside the room: precisely the quantity on the left-hand side of Eq. (4).
4. STATISTICAL
RATING
Using Eq. (4), the axes of Fig. 2 can simply be re-labelled as shown in Fig. 3. This graph indicates the probability of speech being intelligible for a given value of LD(avg)–16 dB, which is the single-number measure of sound insulation (from measurements) offset by 16 dB. The individual data points (♦) in Fig. 3 correspond to measurements of LD(avg) made through a real wall. There is one data point for each of 63 receiving positions tested (all were 0.25 m from the wall). The shaded areas and “Risk Category” labels were added to aid users in interpreting the results: for the measured data, most locations were “Risk Category 3” (1–5 likely privacy lapses per day) but several were “Risk Category 4” (5–26 lapses per day), corresponding to a higher likelihood of speech being intelligible, owing to lower sound insulation to those points. It is up to the user to decide on requirements.
5. CONCLUSIONS
To rate the speech privacy of a closed room, measurements of the sound insulation are required. Using distributions of speech and noise levels measured in meetings allows interpretation of the sound insulation measurements in a statistical manner. In this way, the physical measurements of sound insulation can be translated directly to a “risk” of privacy lapse.
REFERENCES
[1] J.S. Bradley and B.N. Gover, “Designing and Assessing the Architectural Speech Security of Meeting Rooms and Offices”, IRC Research Report RR-187, Aug. 2006. Available at http://irc.nrc-cnrc.gc.ca
[2] B.N. Gover and J.S. Bradley, “Measures for assessing architectural speech security (privacy) of closed offices and meeting rooms”, J. Acoust. Soc. Am., 116, 3480–3490 (2004). [3] J.S. Bradley and B.N. Gover, “Measurement of Sound Transmission from Meeting Rooms”, IRC Research Report, RR-220, Mar. 2006. Available at http://irc.nrc-cnrc.gc.ca
[4] J.S. Bradley and B.N. Gover, “Speech and Noise Levels Associated with Meeting Rooms”, IRC Research Report RR-170, Mar. 2004, revised Dec. 2004. Available at http://irc.nrc-cnrc.gc.ca
ACKNOWLEDGEMENTS
This work jointly funded by NRC Institute for Research in Construction, the Royal Canadian Mounted Police, and Public Works and Government Services Canada.
0.1 1 10 100 20 30 40 50 60 70 80 Le v e l, dBA
Individual probabilities of occurrence, % Speech
Noise
Fig 1: Probability of occurrence of speech and noise levels.
Fig 2: Joint probability of occurrence of speech–noise differences.