Publisher’s version / Version de l'éditeur:
Vous avez des questions? Nous pouvons vous aider. Pour communiquer directement avec un auteur, consultez la première page de la revue dans laquelle son article a été publié afin de trouver ses coordonnées. Si vous n’arrivez pas à les repérer, communiquez avec nous à PublicationsArchive-ArchivesPublications@nrc-cnrc.gc.ca.
Questions? Contact the NRC Publications Archive team at
PublicationsArchive-ArchivesPublications@nrc-cnrc.gc.ca. If you wish to email the authors directly, please see the first page of the publication for their contact information.
https://publications-cnrc.canada.ca/fra/droits
L’accès à ce site Web et l’utilisation de son contenu sont assujettis aux conditions présentées dans le site LISEZ CES CONDITIONS ATTENTIVEMENT AVANT D’UTILISER CE SITE WEB.
Proceedings of the Institute of Acoustics, 20, pt. 2, pp. 1-6, 2008-04-10
READ THESE TERMS AND CONDITIONS CAREFULLY BEFORE USING THIS WEBSITE.
https://nrc-publications.canada.ca/eng/copyright
NRC Publications Archive Record / Notice des Archives des publications du CNRC :
https://nrc-publications.canada.ca/eng/view/object/?id=224c0d07-773e-463b-a42b-dbe085d77619 https://publications-cnrc.canada.ca/fra/voir/objet/?id=224c0d07-773e-463b-a42b-dbe085d77619
NRC Publications Archive
Archives des publications du CNRC
This publication could be one of several versions: author’s original, accepted manuscript or the publisher’s version. / La version de cette publication peut être l’une des suivantes : la version prépublication de l’auteur, la version acceptée du manuscrit ou la version de l’éditeur.
Access and use of this website and the material on it are subject to the Terms and Conditions set forth at
A New procedure for assessing the speech security of meeting rooms
A n e w p r o c e d u r e f o r a s s e s s i n g t h e s p e e c h
s e c u r i t y o f m e e t i n g r o o m s
N R C C - 5 0 5 7 4
B r a d l e y , J . S . ; G o v e r , B . N .
A version of this document is published in / Une version de ce document se trouve dans: Proceedings Institute of Acoustics, Reading, U.K., April 10-11, 2008, v. 20, pt. 2, pp. 1-6
The material in this document is covered by the provisions of the Copyright Act, by Canadian laws, policies, regulations and international agreements. Such provisions serve to identify the information source and, in specific instances, to prohibit reproduction of materials without written permission. For more information visit http://laws.justice.gc.ca/en/showtdm/cs/C-42
Les renseignements dans ce document sont protégés par la Loi sur le droit d'auteur, par les lois, les politiques et les règlements du Canada et des accords internationaux. Ces dispositions permettent d'identifier la source de l'information et, dans certains cas, d'interdire la copie de documents sans permission écrite. Pour obtenir de plus amples renseignements : http://lois.justice.gc.ca/fr/showtdm/cs/C-42
Proceedings of the Institute of Acoustics
A NEW PROCEDURE FOR ASSESSING THE SPEECH
SECURITY OF MEETING ROOMS
J.S. Bradley National Research Council, Ottawa, Canada B.N. Gover National Research Council, Ottawa, Canada
1 INTRODUCTION
It is often desired that enclosed offices and meeting rooms be ‘speech secure’. That is, it should be difficult or impossible for eavesdroppers outside the room to understand or in some cases to even hear speech from the meeting room. ‘Speech secure’ simply implies a high level of speech privacy associated with the architectural aspects of speech propagation from the meeting room and the existing ambient noise. In addition to direct transmission through walls and floor-ceilings, speech can be transmitted from the meeting room via various paths with less sound attenuation such as through ventilation ducts. There are often sound leaks and weak components in the sound insulation of the room, such as those associated with doors. Thus, a measurement procedure is required that is capable of detecting weaknesses in individual components of the sound insulation of an office or meeting room and one that indicates whether an eavesdropper would be able to understand or hear speech from the room.
2
THE NEW PROCEDURE
The new procedure for assessing the architectural speech security of a meeting room is based on sound level differences from room-average levels in the meeting room to spot-receiver positions outside the meeting room. This is different than conventional sound insulation measurements that are based on differences between room-average levels in two adjacent rooms1, 2. The conventional approaches are not appropriate for assessing speech security for several reasons. First, conventional approaches assume diffuse sound fields in both rooms and measure only the average transmission characteristics. For speech security situations, the adjacent space is quite frequently not at all diffuse. For example, it could be very small or very large or of quite unusual dimensions. Second, we need to assess the sound transmission characteristics of individual components and not just the average properties of the separating partition. Third, an eavesdropper is not likely to stand in the middle of the adjacent space, but will listen more effectively by standing close to the outside of the meeting room at some weak point in the sound insulation such as near a door. In the source room, measurements are similar to those of a conventional test. Multiple source and receiver positions are used to accurately characterise the average source room sound levels in the
1
/3 octave bands from 160 to 5k Hz. In adjacent spaces sound levels of the same test source are
measured at positions where an eavesdropper might detect speech sounds from the meeting room. Most receiver positions would be located 0.25 m from the outside of the meeting room. Some would be specifically located to assess potential weak points in the sound insulation such as near doors but usually at a distance of 0.25 m from the door. A distance of 0.25 m was selected because it minimizes the effect of possible reverberant sound fields but is not so close to the test surfaces that small errors in positioning the microphone will cause large variations in the results. Although it was not known when this approach was developed, it is essentially the same as a Japanese standard3 that is used to measure sound transmission from indoors to outdoors through windows.
The measured transmitted sound levels 0.25 m from the outside of the meeting room (L0.25) can be
related to the sound transmission loss (TL) characteristics of the partition and the spatially averaged levels of the test sound in the source room (Ls) using equation (1). (Sound transmission loss is
equivalent to sound reduction index in ISO terminology). When arithmetically averaged over the speech frequencies 160 to 5k Hz, the frequency-averaged values are related as follows,
(1) dB k avg TL avg L avg L0.25( )= S( )− ( )+ ,
The constant k is estimated to be -3 dB in some textbooks4 for a free field receiving space. However, in this work it was determined experimentally by measuring the sound transmission characteristics of several walls in a reverberant test suite to provide standard TL values as a function of frequency. Sound transmission measurements were then made to an array of points 0.25 m from the test wall and the reverberation time of the test rooms were varied by adding sound absorption to them. This made it possible to determine the effect of reverberant sound levels on k for a wide range of conditions.
Figure 1 plots the resulting k values (from frequency averaged values over the speech frequencies from 160 to 5k Hz), versus the reverberant sound level (10 log{4T60(avg)/V}, where T60(avg) is
reverberation time, s; V is room volume, m3 ). Although the standard error about the regression line is quite small (±0.19 dB) and hence k values could be estimated quite accurately, for most common types of meeting rooms, k ≈ -1 ±0.5 dB. Equation (1) with a k value of -1 should usually provide good estimates of transmitted levels at points 0.25 m from the outside boundaries of a meeting room.
By substituting k ≈ -1 into equation (1), the measured level difference (LD(avg)) between the source room average level (LS(avg)) and the transmitted level (L0.25(avg)) can be related to sound
transmission loss (TL(avg)), (all averaged over speech frequencies from 160 to 5k Hz).
TL(avg) ≈ LD(avg) –1 (2)
This makes it possible to estimate transmitted levels at the design stage. (See also Section 5).
-14 -12 -10 -8 -6 -4 -2 -2 -1 0 1 2 3 k, dB 10log{4T60/0.161V}, dB Small room Large room
Figure 1. Experimentally determined values for k averaged over the speech frequencies 160-5k Hz. Boxes refer to the results expected in smaller meeting rooms (150 m3, T60 0.3 to 1.2 s) and larger
meeting rooms (500 m3, T60 0.5 to 1.6s).
3
ASSESSING THE AUDIBILITY AND INTELLIGIBILITY OF
TRANSMITTED SPEECH
The audibility and intelligibility of speech sounds transmitted into adjacent spaces will depend on the signal-to-noise ratio at the listener’s position outside the meeting room. New signal-to-noise ratio measures were developed5 from extensive listening tests because existing measures were not found to be sufficiently accurate predictors of the intelligibility and audibility of the transmitted speech sounds. The listening tests used the Harvard Sentences6 and exposed subjects to speech that was spectrally modified to represent the effects of transmission through various walls. The speech was heard in combination with simulated ambient noises.
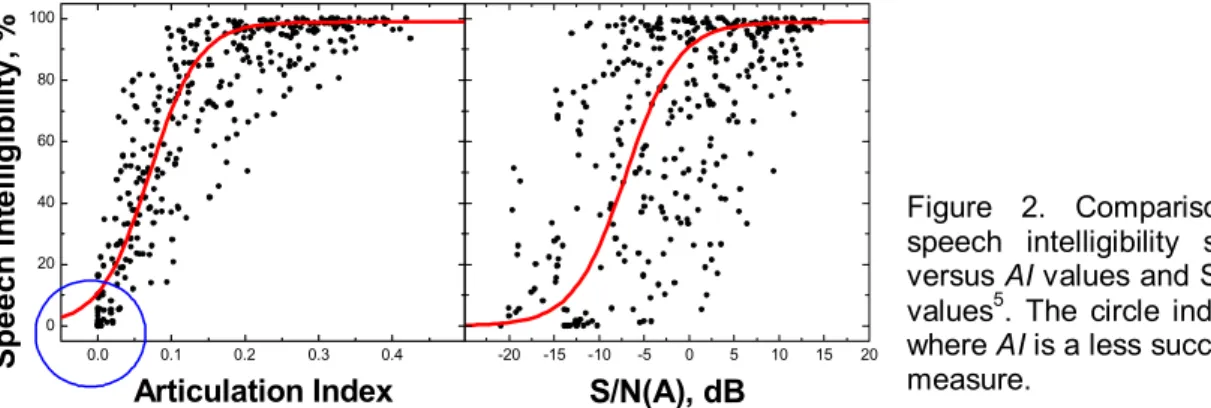
It is well known that the Articulation Index (AI) is a more accurate indicator of the intelligibility of speech than simple differences of the A-weighted speech and noise levels. Figure 2 illustrates this by comparing plots of speech intelligibility scores versus AI values and differences of A-weighted speech and noise levels (S/N(A)). There is an obvious difference in the amount of scatter in the two plots and AI values are clearly a more accurate predictor of the speech intelligibility scores.
Proceedings of the Institute of Acoustics
Although the AI values are superior to the S/N(A) values, the AI values do not provide accurate ratings of conditions close to AI = 0 and cannot rate conditions below AI = 0 where AI is not defined. For rating the speech security of meeting rooms, one is interested in rating conditions where the intelligibility of the transmitted speech is close to zero. In some cases one would like to determine whether the transmitted speech would be audible. This is not possible using AI values.
0.0 0.1 0.2 0.3 0.4 0 20 40 60 80 100 S p eech I n tel li g ib il it y, % Articulation Index -20 -15 -10 -5 0 5 10 15 20 S/N(A), dB Figure 2. Comparison of speech intelligibility scores versus AI values and S/N(A) values5. The circle indicates where AI is a less successful measure.
The new listening tests5 showed that frequency-weighted arithmetic averages of signal-to-noise ratios in decibels could be much better predictors of both the audibility and intelligibility of transmitted speech for conditions where close to 0 intelligibility is expected. Figure 3 shows results used to determine the thresholds of audibility, cadence and intelligibility of speech in terms of a uniform-weighted signal-to-noise ratio SNRuni32, given by the following equation, (where Sb and Nb
are the speech and noise levels respectively at the listener’s position in 1/3 octave band b).
∑
− − = b b b uni S N dB SNR max( , 32), 16 1 32 (3)Figure 3. Percentage of subjects: (a) just understanding one word (upper), (b) just detecting the cadence of the speech (middle) and (c) just able to hear any speech sounds (lower)
The points at which 50% of the listeners could just understand one word, just detect the cadence of the speech, or just hear any speech sounds at all, were defined as the ‘just noticeable thresholds’. These are obtained from Figure 3 and are listed in Table 1 for approximately free field conditions.
Threshold SNRuni32
Intelligibility -16 dB
Cadence -20 dB
Audibility -22 dB
Table 1. Just noticeable thresholds of: intelligibility, detection of cadence and audibility from laboratory study in approximately free field conditions.
Subsequent listening tests in real rooms have indicated that the threshold of intelligibility will be close to –11 dB in most meeting rooms, varying 1 or 2 dB with the reverberation time of the room. Designing a meeting room so that conditions will normally correspond to the just noticeable threshold of intelligibility should result in conditions for which transmitted speech is very infrequently understood by eavesdroppers outside the room.
4
THE STATISTICS OF SPEECH SECURITY
The audibility and intelligibility of speech sounds transmitted to adjacent spaces will depend on 3 factors: (1) the sound transmission characteristics of the room boundaries, (2) the speech levels in the meeting room (especially those incident on the boundaries of the room), and (3) the ambient noise levels at listening points outside the meeting room. The sound transmission characteristics can either be measured using the new measurement procedure or can be estimated using equation (1). Similarly the ambient noise levels at listener positions can be measured at appropriate times. The speech levels in the meeting room will vary from moment to moment and can be described statistically. We can think in terms of the probability of speech being heard or understood outside the room as related to the likelihood of particular higher speech levels occurring in the meeting room.
The distribution of speech levels in meeting rooms was determined by installing data loggers to provide sound levels in 10 s intervals for a range of meeting rooms and for a number of meetings7. Table 2 lists some details of the meeting rooms included. Data loggers were located around the periphery of the rooms so that the speech levels were representative of speech sounds incident on the room boundaries. Although data was acquired for meetings with and without sound amplification systems, the resulting speech levels were very similar and so the data were combined. Although amplification was used in some larger rooms, the speech levels incident on the room boundaries were similar to the unamplified speech levels found in smaller rooms. In total more than 100,000 measured speech levels over 10 s intervals were acquired.
Number of meeting room cases 32
Number of meetings measured 79
Number of people in each meeting 2 to 300 people
Range of room volumes 39 to 16,000 m3
Range of room floor areas 15 to 570 m2
Table 2. Summary of meeting rooms measured. The data includes 30 different rooms, 2 of which were measured with and without sound amplification systems.
The cumulative probability distribution of the combined speech data is shown in Figure 4. The dotted cross lines indicate the example that for 90% of the time, the measured speech levels were 64 dBA or less. That is, for only 10% of the time did the speech levels incident on the room boundaries exceed 64 dBA in the meeting rooms.
Ambient noise levels in spaces adjacent to meeting rooms were similarly sampled. Cumulative probability distributions of noise levels in spaces adjacent to meeting rooms and for different times of day were produced7. As would be expected, ambient noise levels were highest during the
Proceedings of the Institute of Acoustics
daytime and lowest late at night. The spectrum of the noises tended to approximate a ‘neutral’ spectrum decreasing with increasing frequency at 5 dB per octave. However in many cases it may be preferable to measure the actual noise levels during representative noise conditions.
30 40 50 60 70 80 0 20 40 60 80 100 C u mul a ti v e p roba bi li ty , % Level, dBA
Figure 4. Cumulative probability distribution of measured speech levels in meeting rooms.
5
CLASSES OF SPEECH SECURITY
From the definition of the uniform-weighted signal-to-noise ratio in equation (3), the following is approximately true, (where (avg) indicates averages over frequency from 160 to 5k Hz),
(4) dB avg L avg LD avg L SNRuni32 ≈ S( )− ( )− N( ),
where the averages are over frequency from 160 to 5k Hz, LS(avg) is the average speech level in
the source room and LN(avg) is the average noise level at the receiver position. LD(avg) is the level
difference indicating the attenuation of a test signal between the average source room level and the transmitted level at the listener position outside the room.
When the transmitted speech sounds are loud enough relative to the ambient noise at some listener position, the speech will be audible and sometimes also intelligible. The new measurement procedure measures the transmission characteristics in terms of the level difference (LD(avg)) between the source room-average and the level at spot receiver positions. The ambient noise
LN(avg) can also be measured. The speech levels in the meeting room will vary over time, but the
statistical characteristics of speech level variations are known as described in the previous section. For a given LD(avg) and LN(avg) the probability of transmitted speech being heard or understood is
related to the probability of the source room speech levels exceeding certain values.
If we wish to design to achieve SNRuni32 = -11 dB, or better (the threshold of intelligibility in meeting
rooms), then equation (4) can be re-written as,
(5)
11 )
(avg +LN ≥LS+
LD
If we select some higher speech source level with a corresponding probability of occurring, we can with equation (5) determine the combination of LD(avg) and LN(avg) required to meet or exceed the
threshold of intelligibility for that speech level. Conversely, the combination of LD(avg) and LN(avg)
can be interpreted in terms of the probability of transmitted speech being understood from the results in Figure 4. This combination is referred to as the Speech Privacy Class (SPC).
(6) N L avg LD SPC = ( )+
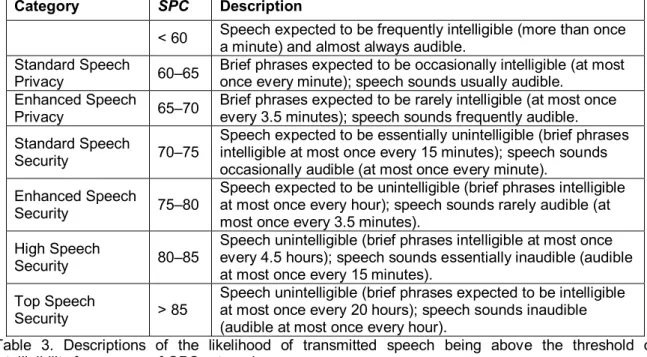
Following this approach a set of speech security rating classes has been produced starting with meeting room speech levels in 5 dB increments and corresponding SPC values. These are illustrated in Table 3. The descriptions of each category are based on the likelihood of transmitted speech being above the threshold of intelligibility from Figure 4.
Vol. 30. Pt.2. 2008
From the results in equation (2) in Section 2, we can relate TL(avg) and LD(avg). With some suitable estimate of the expected ambient noise level (LN) and LD(avg) we can estimate the Speech
Privacy Class at the design stage. As before, TL(avg) is an arithmetic average over the frequencies from 160 to 5k Hz.
Category SPC Description
< 60 Speech expected to be frequently intelligible (more than once
a minute) and almost always audible. Standard Speech
Privacy 60–65
Brief phrases expected to be occasionally intelligible (at most once every minute); speech sounds usually audible.
Enhanced Speech
Privacy 65–70
Brief phrases expected to be rarely intelligible (at most once every 3.5 minutes); speech sounds frequently audible. Standard Speech
Security 70–75
Speech expected to be essentially unintelligible (brief phrases intelligible at most once every 15 minutes); speech sounds occasionally audible (at most once every minute).
Enhanced Speech
Security 75–80
Speech expected to be unintelligible (brief phrases intelligible at most once every hour); speech sounds rarely audible (at most once every 3.5 minutes).
High Speech
Security 80–85
Speech unintelligible (brief phrases intelligible at most once every 4.5 hours); speech sounds essentially inaudible (audible at most once every 15 minutes).
Top Speech
Security > 85
Speech unintelligible (brief phrases expected to be intelligible at most once every 20 hours); speech sounds inaudible (audible at most once every hour).
Table 3. Descriptions of the likelihood of transmitted speech being above the threshold of intelligibility for a range of SPC categories.
6 CONCLUSIONS
The new procedure provides an accurate approach for measuring and predicting the expected speech privacy of enclosed rooms. It is applicable to all levels of speech privacy from minimal to highly secure conditions. The measured or predicted transmission characteristics and ambient noise level at the position of a potential eavesdropper outside the room can be used to estimate the likelihood of transmitted speech being understood.
7 REFERENCES
1. ASTM E336-97, “Standard Test Method for Measurement of Airborne Sound Insulation in Buildings,” American Society for Testing and Materials, West Conshohocken, PA, U.S.A. 2. ISO 140/III, “Laboratory Measurement of Airborne Sound Insulation of Building Elements –
Part IV: Field Measurements of Airborne Sound Insulation Between Rooms”, 1998-08-15. 3. JIS A 1520, “Method for Field Measurements of Sound Insulation of Windows and Doors”,
Japanese Industrial Standard, Japanese Standards Association.
4. Pierce, A.D., “Acoustics: An Introduction to its Physical Principles and Applications”, McGraw Hill, New York (1981).
5. Gover, B.N., and Bradley, J.S., “Measures for assessing architectural speech security (privacy) of closed offices and meeting rooms”, J. Acoust. Soc. Am., 116, (6), 3480-3490 (2004).
6. Anon, “IEEE Recommended Practice for Speech Quality Measurements”, IEEE Trans. On Audio and Electroacoust., pp. 227-246 (1969).
7. Bradley, J.S.; Gover, B.N. Speech and Noise Levels Associated with Meeting Rooms, Research Report, Institute for Research in Construction, National Research Council Canada, March 2004. (IRC-RR-170). http://irc.nrc-cnrc.gc.ca/pubs/rr/rr170/