CCMPACTCITIES: Analyzing the Urban Spatial Structure in Cities with Growth Restrictions
BY:AMIT OBEROI
Diploma in Architecture
Sushant School of Art and Architecture, 1998
!MASSAC(HUSETriS INSTITUTE OF TECHNOLOGY
1
OCT
2
7
2004
LIBRARIES
Submitted to the Department of Architecture + Department of Urban Studies and Planning in Partial Fulfillment of the Requirements for the Degrees of
ROTCH
MASTER OF SCIENCE IN ARCHITECTURE STUDIES
and MASTER IN CITY PLANNING
at the Massachusetts Institute of Technology, September 2004.
@ 2004 Amit Oberoi. All Rights Reserved.
Amit Oberoi
Department of Architecture + Department of Urban Studies and Planning May 19 2004 AUTHOR
CFRTTFIFD BY
Jean P. de Monchaux
Professor of Architecture and Planning Department of Architecture + Department of Urban Studies and Planning Thesis Supervisor
ACCEPTED BY
Julian Beinart Professor of Architecture + Chairman, Department Committee on Graduate Students Department of Architecture ACCEPTED BY
Dennis Frenchman
Professor of the Practice of Urban Design Department of Urban Studies and Planning 1
COMPACTCITIES:
Analyzing the Urban Spatial Structure in Cities with Growth RestrictionsBy AMIT OBEROI
Department of Architecture + Department of Urban Studies and Planning
Abstract
A compact city form is one that espouses high intensity development within a restrictive geographic area. Its perceived benefits include (a) saving agricultural land (b) inducing shorter commute trips, thus less consumption of fuel and lower emission of harmful gases (c) bringing about a better quality of life through greater social interaction and (d) causing economic benefits through economies of agglomeration.
In this thesis I analyze these claims based on literature review, economic models, statistical tools, and by
generating hypothetical transport scenarios. Based on this analysis, I conclude that high-density development
by itself has little significant association with the benefits claimed above. Further growth control mechanisms
have negative externalities such as increasing land rents and causing an immense strain on congestible amenities.
The thesis is divided into three parts. The first section is treated as an introduction to the concept of a "compact city". In the second section I analyze whether a compact city can deliver the benefits that its proponents claim.
I look at issues such as, (i) the effect of density on urban travel behavior factors like commute distances and
public transit usage; (ii) the economics at the urban edge; (iii) the claim that sprawl is inevitable, (iv) effect of growth restrictions on land rent and (v) the relevance of compaction in developing countries (most of which are already highly dense). The third section analyzes the growth management regulations and policies being
implemented in Delhi. I use the conclusions drawn from the second part to comment on the appropriateness of these policies, and suggest ways in which the city could better enforce these regulations.
I chose Delhi as the case study, in part due to my familiarity with the city, but also because it offers a unique
urban laboratory. Delhi's urban form could be described as the antithesis of the compact city form. Unlike most other cities, Delhi displays a positive (upward sloping) density gradient. The city is characterized by low-density development in the center and high-rise high-low-density at the periphery. The city owes this as much to its past as it does to its present political circumstances and planning policies.
growing population, the city in the past five decades has quadrupled in area. I evaluate the urban growth management tools such as taxation policy, land use policy, development of satellite towns and imposition of physical restrictions, used by the city to deal with its problem.
Thesis Supervisor: Jean P. de Monchaux
Professor of Architecture and Planning
Thesis Supervisor: JEAN P. de MONCHAUX
Professor of Architecture and Planning
Department of Architecture + Department of Urban Studies and Planning
Thesis Readers: RALPH GAKENHEIMER
Professor of Urban Planning
Department of Urban Studies and Planning
ANNA HARDMAN
Lecturer in International Development Planning Department of Urban Studies and Planning
TUNNEY F. LEE
Professor of Architecture and Urban Studies and Planning, Emeritus Department of Urban Studies and Planning
Acknowledgements
I would like to express my sincere gratitude to all my teachers, friends and colleagues at MIT, without whose help this endeavor
would not have been possible.
First and foremost I would like to thank Professor Jean de Monchaux for his guidance and encouragement throughout the thesis
process. I have learned immensely from his vast experiences and the thesis is richer for his valuable stimulating suggestions.
Many thanks to Professor Anna Hardman for her meticulous feedback on my disjointed ideas, which made it possible for the
thesis to achieve a semblance of coherence. I am also grateful to her for exposing me to urban economics literature and also for
her detailed comments on the draft.
I am grateful to Professor Ralph Gakenheimer for sharing his experiences and insights on his research on transportation policies
in developing countries. His interest, valuable comments and hints are much appreciated.
Thanks to Professor Tunney Lee for his comments and suggestions in improving the thesis.
A special thanks is due to Alain Bertaud for his kind words of encouragement during our brief meeting at MIT.
Finally, I am much indebted to Arvind Saraf for his support with the hypothetical model; Emily Greeves and Eleanor Fawcett for
providing me information on London; Susanne Seitinger for the German translations; Pankaj Kumar for the final edits,
Zhong-Ren Peng for sharing his study on Portland, and the staff at the Rotch library for helping me sift through tones of data.
Contents ABSTRACT 4 ACKNOWLEDGEMENTS 6 LIST OF FIGURES 9 LIST OF TABLES
IPROLOGUE
12
1.1 THE AGE OF MEGACITIES
1.2 WHAT MAKES CITIES ATTRACTIVE
Centrifugal Forces Centripetal Forces
1.3 THE COMPACT CITY CONCEPT
1.4 AIM OF THE THESIS
1.6 STRUCTURE OF THE THESIS
2
ANALYSIS - I: URBAN FORM AND TRAVEL BEHAVIOR -I 182.1 INTRODUCTION TO ANALYSIS SECTIONS - (Chapter - 2, 3 & 5)
A - Density and Travel Behavior
B - Congestion and Land Market
C - Effect of Sprawl on Agricultural Output
D - Relevance of compaction in Developing Countries
A - DENSITY AND TRAVEL BEHAVIOR
2.2 Arguments FOR Compaction
(i) brings work-home closer-more walk/bike trips - ELKIN (ii) reduces gasoline usage - NEWMAN/KENWORTHY (iii)positive correlation b/w city size and auto use - ECOTEC 2.3 Counter Arguments
(i) Difficult to mould desired density - Urban Density is a downward sloping curve.
(ii) Urban Form more than density plays an important role on transport behavior - Hypothetical Model (iii) Increased "family & personal" trips and more suburb to suburb trips.
(iv) Multi-family households and unpredictable future jobs (v) other factors - income, individual / cultural travel preferences.
3
ANALYSIS - II: URBAN FORM AND TRAVEL BEHAVIOR -Il 323.1 AIM OF THE EXERCISE
3.2 THE DATA SET
3.3 LIMITATIONS OF THE EXERCISE
3.4 OVERALL TRENDS
3.5 TRANSPORTATION and DENSITY
Correlation Analysis
- Density vs. Median Travel Time for Work Trips - Density vs. Modal Share of Public Transit - Density vs. Private Motorized Vehicle Ownership
Multivariate Regression Models
- Public Transit Model Split regressed with City Product per capita, gasoline price, city size & travel time.
3.8 CONCLUSION
4
ANALYSIS - III: URBAN FORM AND TRAVEL BEHAVIOR -Il 58(A) ECONOMICS OF THE EDGE CONDITION
4.1 EFFECT OF SPRAWL ON AGRICULTURAL OUTPUT
4.2 ECONOMIC THEORY OF SPRAWL
Rodriguez-Bachiller Model
4.3 CONTAINMENT AND LAND PRICES
Man-Cho Model Seoul example
(B) RELEVANCE OF CONTAINMENT IN DEVELOPING COUNTRIES
4.4 RELEVANCE OF COMPACTION IN DEVELOPING COUNTRIES
5
DELHI: INTRODUCTION 675.1 MASSIVE IN-MIGRATION
5.2 DELHI's URBAN SPATIAL STRUCTURE
5.3 LOCAL AGENCIES CONTROLLING DEVELOPMENT
5.5 5.6
6
EPILOGUETRANSPORT PROFILE
CITIES RESPONSE TO GROWTH
6.1 INCREASING THE HOLDING CAPACITY OF THE INNER CORE - Repealing ULCRA and imposition of Vacant Tax
- Political will need to convert bungalows to high rise structures - Improve infrastructure to accomodate intensified usage - Review reasons for high vacancy rates
- Repeal Rent Control
6.2 DENSIFICATION OF PERIPHERAL CENSUS TOWNS / SUBCITIES - Link transport and employment to new housing settlements
- Review role of DDA
- Strategize ways to prevent developers from undertaking leapfrog development
- Strengthen farming activities
6.3 TRANSPORTATION POLICY TO REDUCE TRAVEL LENGTHS AND AIR POLLUTION - Review policy of self-sustained neighborhoods
- Operation of Delhi Metro - Taxing policies
6.4 SATELLITE TOWNS TO ACT AS COUNTER MAGNETS FOR IN-MIGRATION - Better co-ordination needed between the various towns
- Review Squatter settlement policies
BIBLIOGRAPHY APPENDIX A. B. C. D. E. F
Code for Hypothetical Model
Data Set for Statistical Analysis Data Set for Statistical Analysis Delhi Census Data
Delhi Census Data Delhi Census Data
List of Figures
1. Prologue
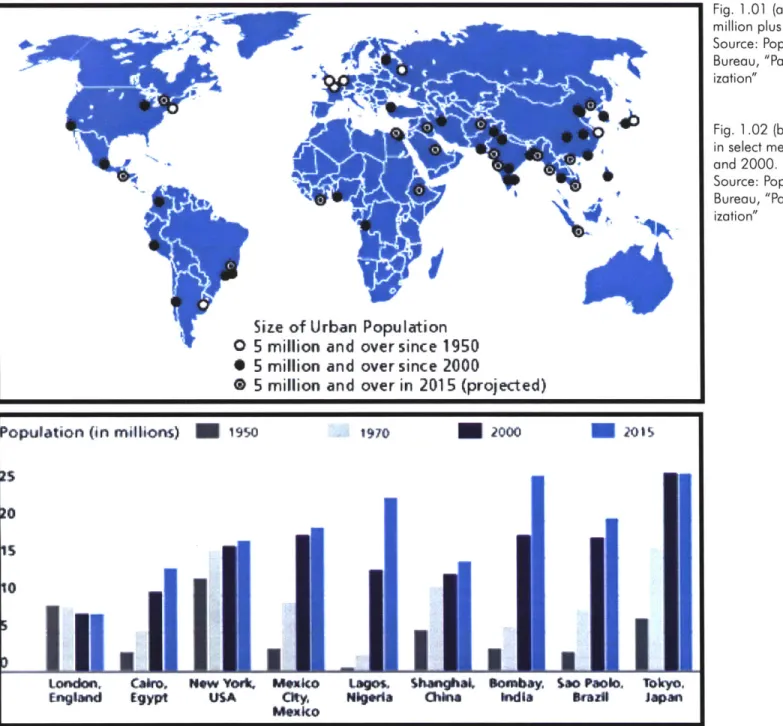
Fig. 1.01:
Five-million plus cities.
Source: Population Reference Bureau, "Patterns of World Urbanization"
Fig. 1.02:
Population trends in select mega-cities between 1950 and 2000.
Source: Population Reference Bureau, "Patterns of World Urbanization"
2. Analysis - IFig. 2.01:
Utility curves of walk and automobile trips.
Source: Boarnet, Marlon G., and Crane, Randall, (2001) "Travel By Design: The Influence of Urban
Form on Travel"
Fig. 2.02:
Population Density versus Annual Gasolene Consumption per capita.
Source: Newman, Peter and Jeffrey Kenworthy (1989) "Cities and Automobile Dependence: An
International Sourcebook."
Fig. 2.03:
Graphs showing historical density profile in cities around the world.
Source: Clark, Colin (1951) "Urban Population Densities" Journal of Royal Statistical Society. Series
-A (General) Vol. 114 Nos. 4 (pp. 490-496)
Fig. 2.04:
Density gradients in various cities around the world
Source: Bertaud, Alain and Malpezzi, Stephen (1999) "The Spatial Distribution Of Population in 35
World Cities: The Role of Markets, Planning and Topography", Wisconsin-Madison CULER
Working Papers, The Center for Urban Land Economics Research - University of Wisconsin.
Fig. 2.05:
Schematic representation of trip patterns within a metropolitan area.
Source: Bertaud, Alain (2002) "Note on Transportation and Urban Spatial Structure"
Fig. 2.06:
Conceptualised density gradients of polycentric and monocentric cities.
Source: Author
Fig. 2.07: Grid - Scenario 1: Monocentric city model
Source: Author
Fig. 2.08: Grid - Scenario 2: Polycentric city model - ideal case
Source: Author
Fig. 2.09: Grid - Scenario 3: Polycentric city model - worst case
Source: Author
Fig. 2.10
Result Hypothestical Model [1. Monocentric Model; 2. Polycentric Model (Ideal situation); 3. Poly
centric Model (Worst case situation)]
3. Analysis - II
Fig. 3.01:
Fig. 3.02:
Fig. 3.03:
Fig. 3.04:
Fig. 3.05:
Fig. 3.06:
Fig. 3.07:
Fig. 3.08:
Fig. 3.09:
Fig. 3.10:
Fig. 3.11:
Fig. 3.12:
Fig. 3.13:
Fig. 3.14:
Fig. 3.15:
Fig. 3:16:
Composition of data set by UN Region
Source: Compiled by author
Composition of data set by UN Sub Region
Source: Compiled by author
Composition of data set by countries
Source: Compiled by author
Urban Definitions: Metro (US), Metro (India) and UN GUO - urban agglomeration
Source: Author
Difference in desnsity definitions
Source: AuthorDensity in Tokyo, London and New York
Source: unknownBoxplot showing Median Travel Times to work in cities classified by the World Bank Income Levels
Source: Compiled by author
Scatter plot, Residential density on the x axis and median travel time to work on the y axis. Cities
color coded based on the World Bank Income Level.
Source: Compiled by author
Scatter plot, Residential density plotted against median travel time to work. Cities color coded
based on their location (UN Commision Region).
Source: Compiled by author
Scatterplot: Residential density and median travel time for work trips (All Income Level)
Source: Compiled by author
Scatterplot: Residential density and median travel time for work trips (Upper Income Level)
Source: Compiled by author
Scatterplot: Residential density and median travel time for work trips (Lower Middle Income Level)
Source: Compiled by author
Scatterplot: Residential density and median travel time for work trips (Lower Income Level)
Source: Compiled by author
Scatterplot: Public transit mode percentage to city product per capita. Color coded for income level
Source: Compiled by author
Boxplot of percentage public transit modes accounting for income level categorization.
Source: Compiled by author
Boxplot showing pedestrian work trip percentage in different Income Level cities.
Fig. 3.17:
Scatterplot of pedestrian mode of work trip vs. urban density with income level classification.
Source: Compiled by author
Fig. 3.18:
Walk trip against residential density. Color code based on regions.
Source: Compiled by author
Fig. 3.19:
Scatterplot and linear regression between residential density and median travel time for work trips
(All Income Level.)
Source: Compiled by author
Fig. 3.20:
Scatterplot and linear regression between residential density and median travel time for work trips
(Upper Income Level.)
Source: Compiled by author
Fig. 3.21:
Scatterplot and linear regression between residential density and median travel time for work trips
(Lower-Middle Income Level.)
Source: Compiled by author
Fig. 3.22:
Scatterplot and linear regression between residential density and median travel time for work trips
(Lower Income Level.)
Source: Compiled by author
Fig. 3.23
Scatterplot: Density vs. Automobile ownership per 1000 pop. Color coded by income IvI
Source: Compiled by author
Fig. 3.24
Scatterplot: Density vs. Automobile ownership per 1000 pop. Color coded by UNDP region
Source: Compiled by author
Fig. 3.25
Boxplot: Automobile ownership per 1000 pop. normalized by World Bank Income Level
Source: Compiled by author
Fig. 3.26
Boxplot: Automobile ownership per 1000 pop. normalized by UN Commission Region
Source: Compiled by author
Fig. 3.27
Relationship Matrix between car ownership, city product per capita and % non private car modal split.
Source: Author
Fig. 3.28
Scatterplot and linear regression between residential density and private motorized vehicle per 1000
population (All Income Level)
Source: Compiled by author
4. Analysis - III
Fig. 4.01:
Conceptual diagram explaining the Rodriguez-Bachiller concept.
Source: Rodriguez-Bachiller, Augustine (2000) "Discontiguous Urban Growth" in Simmonds, Roger
and Hack, Gary (eds) "Global City Regions"
Fig. 4.02
Stages of Development beyond the urban edge.
Fig. 4.03:
Fig. 4.04:
Fig. 4.05
Fig. 4.06:
and Hack, Gary (eds) "Global City Regions"
Urban growth in London and Paris.
Source: Jenks, Mike and Burgess, Rod (2000)"Compact Cities: Sustainable Urban Forms for Develop
-ing Countries"
Conceptual sketch of land price effect due to imposition of a greenbelt.
Source: Cho, Man (1997) "Congestion Effects of Spatial Growth Restrictions: A Model and Empirical
Analysis" Real Estate Economics Vol. 25.
Effect of the greenbelt on Seoul's density profile.
Source: http://www.megacities.uni-koeln.de/index.htm
Increasing gap between death and birth rates in developing countries
Source: Population Reference Bureau, "Patterns of World Urbanization"
5. Delhi - introductionFig. 5.01:
Land Acquired by the city between 1947 & 1997
Source: Unknown
Fig. 5.02:
Delhi density map.
Source: Kumar, Ashok (2003) "Inverted Compact City of Delhi" in Jenks, Mike and Burgess, Rod
"Compact Cities"
Fig. 5.03:
Typical cities with negative exponential density slopes.
Source: Bertaud, Alain (2002) "The Spatial Organization of Cities: Deliberate Outcome or Unforseen
Consequence?"
Fig. 5.04:
Density levels in relation with distance from the CBD in cities with poitive density curves.
Source: Bertaud, Alain (2002) "The Spatial Organization of Cities: Deliberate Outcome or Unforseen
Consequence?"
Fig. 5.06:
Map showing location of peripheral sub cities.
Source: Delhi Development Authority
Fig. 5.07:
Areas under various development agencies in Delhi.
Source: Tiwari, Geetam (2003) "Transport and Land Use Policies in Delhi" Bulletin of the World Health
Organization 81(5).
Fig. 5.08:
Map showing proposed routes for Delhi's metro rail.
Source: Delhi Metro Rail Corporation
Fig. 5.09:
Delhi Land Use Plan
Source: Master Plan for Delhi 2000
Fig. 5.10
National Capital Region- showing neighboring cities that fall under this category.
Source: Tiwari, Geetam (2003) "Transport and Land Use Policies in Delhi" Bulletin of the World Health
Fig. 5.11:
Planned growth in Delhi Metropolitan Region
List of Tables
2. Analysis - I
Table: 2.01
3. Analysis - IITabulated results of the Hypothetical Model
Source: AuthorTable: 3.01
Result of the Multiple Regression Model - % Pulic Transit Modal Split
Source: AuthorTable: 3.02
Coefficient Correlations of Independent Variables
Source: Author
Table: 3.03
Tabulated results of the linear regression between Automobile Ownership and city product per capita
normailzed by purchasing power parity.
Source: Author
5. Delhi - Introduction
Table: 5.01
Decennial Population Growth Rate
Source: Delhi Statistical Handbook, N.C.T.D., 1994.
Table 5.02:
Growth of Urban Areas in Delhi (1901-1991)
Source. India Stat.Table 5.03: Delhi - Share of Transport Mode
Source: Tiwari, Geetam (2003)
"Transport
and Land Use
Organization 81(5).
Table 5.04
Estimated share of transit modes by income groups.
Source: Tiwari, Geetam (2003) "Transport and Land Use
Organization 81(5).
Policies in Delhi" Bulletin of the World Health
1.1 AGE OF MEGA CITIES
PROLOGUE
CHAPTER OUTLINE
1.1 THE AGE OF MEGACITIES
1.2 WHAT MAKES CITIES ATTRACTIVE Centripetal Forces
Centrifugal Forces
1.3 THE COMPACT CITY CONCEPT
1.4 AIM OF THE THESIS
1.5 METHODOLOGY
In 1800, only 3% of the world's population resided in urban
areas. This figure rose to 14% by 1900 with only 12 cities having a population greater than 1 million. By 1950, urban inhabitors comprised 30% of the world's population and now there were 83 cities with 1 million or more people. The last few decades has seen an unprecedented growth in urban popula-tion. According to a report published by the United Nations1
in the year 2000, 47% of the world's population lived in urban
areas and there were 411 cities that had a million or more people. Developed countries had 76% of the population in cities, while the similar figure in less developed nations was 40%. In 1994, there werel 4 "mega-cities," defined as cities with at least 10 million inhabitants. Their number is expected to double by 2015. Bulk of these mega-cities will be in devel-oping countries - or in economies that are least capable of sustaining giant cities.
1.2 WHAT MAKES CITIES ATTRACTIVE
Urban Agglomerations are an outcome of the trade off be-tween centralizing [centripetal forces such as economies of scale, positive] and decentralizing pulls [centrifugal forces such as cheaper and more efficient transportation systems]. Some of
Population (in milions)
Lendon, England
M1950
CaV, NOW York. Mexko
Egypt USA cy.
Mexko 1970 Lbgo~ Nlgrla
U
2000M
2015I'll."'i
$hlanghal, Sombay $o Paolo, Tkyo,
Chkia India s-azo Japan
Size of Urban Population
0 5 million and over since 1950 * 5 million and over since 2000
0 5 million and over in 2015 (projected)
Fig. 1.01 (above): Location of 5
million plus cities.
Source: Population Reference Bureau, "Patterns of World Urban-ization"
Fig. 1.02 (below): Population trends in select mega-cities between 1950 and 2000.
Source: Population Reference Bureau, "Patterns of World Urban-ization"
the pull and push theories are summarized below. CENTRIPETAL FORCES:
ECONOMIES OF SCALE
The high concentration in cities provides firms with a greater effective aggregate demand for industrial products as com-pared to a sparsely populated area. Firms thus prefer to locate
in and around cities to produce cheaper and more efficiently,
goods and services in larger but fewer sites (economies of scale). Further, firms are encouraged to congregate close to each other to deriving the benefits of sharing - costs for
com-mon infrastructure, - a pool of specialized labor - and to
exchange ideas. This helps increase productivity and stimulates innovation. The labor benefits in locating close to industry for better job prospects while not having to change home loca-tions.
POLITICAL FORCES
Ades and Glazer in their paper "Trade and Circuses" argue "political forces, even more than economic factors drive ur-ban centralization." According to them political instability and dictatorship cause greater concentration in a single metropolis. They reason that increased distance lessens influence on the government because (i) threat of violence appears less direct when distance increases (ii) illegal political actions are difficult to conceal with distance (iii) access to information to political agents in the hinterland is less and (iv) distance hurts
com-munication between political agents and government. Their
hypothesis is that the political power of the capital's population induces the government to transfer greater resources (e.g. tax benefits, better education facilities) to the city, and these ben-efits in-turn attract migrants.
INNOVATION AND LIFESTYLE
Recently developed models of urban economics, indicate an increasing evidence of urban agglomeration based on "innovation" and "lifestyle". Indeed the 'global city' growth paradigm is strong enough to have allowed cities like London and New York to thrive despite the decline of their traditional industrial and transportation sectors. Sanyals argues that successful cities are multi-cultural; they have a high concentration of human capital; are consumer oriented; and have a lively cultural/social life. He further claims, "The role played by the cities as innovation/life style hubs compensate for the costs of congestion because the process of agglomeration and human interaction itself generates externalities that have tangible economic benefits."3
TRADE POLICY
Krugnab and Livas claim that protectionism generates larger central cities. While international firms serve both the city and hinterland equally well, domestic firms pay lower transport costs when serving their own locations. Hence it makes more sense for them to locate close to their market base (the cities). With protectionist trade policies in place, domestic suppliers take over the market. Since firms are located in the city, prices
net of transport costs are lower here and hence workers are at-tracted to the city to pay lower prices for the domestic goods. CENTRIFUGAL FORCES:
CHEAPER AND MORE EFFICIENT TRANSPORTATION
Urbanists argue that concentration in cities will be higher when transportation is expensive. Cheaper and more efficient trans-portation and communication offer people/firms an opportu-nity to move to a farther location and yet still have the same access to jobs/market. Increasingly people in the developed world are moving to larger plots of land in the suburbs.
Urbanization usually accompanies social and economic devel-opment. However rapid urban growth on today's scale strains the capacity of local and national governments to provide even the most basic of services such as water, electricity and sewer-age. Squatter settlements and over-crowded slums are home to tens of millions, like the favelas that cling to the hillsides of Rio de Janeiro and the tombs used as homes by tens of thousands
in Cairo's "City of the Dead".
Urban growth management has become a vital part in the planning of mega-cities. In this age of mega-cities, planners are seeking more sustainable - denser urban forms, with poli-cies such as the creation of poly-nucleated cities (cities with 4-5 satellite towns acting as magnets to attract some of the growth, e.g. Delhi); creation of physical boundaries such as greenbelts (e.g. London); guiding high density growth around
multiple district centers (e.g. Tokyo); by issuing ordinances that restrict development beyond a delineated boundary (e.g. Port-land); and creating linear corridors of high density transport zones leading to the CBD.
1.3 THE CONCEPT OF THE COMPACT CITY
The genesis of the compact city lies in the sustainability imperatives of resource conservation (e.g. fossil fuel energy) and waste-minimization (e.g. carbon emissions) as embodied in the Brundtland Commission report and the UNCED Agenda 21
proposals published in the late eighties and early nineties. Following the publication of the Brundtland Commission report
in 1987, a fundamental question is being asked amongst the
planning community, how do we use planning systems and tools to develop a sustainable urban development. A possible solution being offered is that of "compact city" development. Containment policy has two fundamental tenets, (i) preservation of open space and thus protection of agricultural output through the practice of delineating a firm urban edge and (ii) maximizing efficiency in resource consumption by increasing the density within the urban contiguous area.
The moot idea as described by Ewing was that "higher densities mean less space consumed per capita, and more land for
agriculture and for open space; bus and rail would better serve denser settlements, and there would be less reliance on the automobile; and higher densities reduce society's environmental footprint and slow the consumption of non-renewable resources."5 Proponents of the compact city ideas also point to the economic, social and cultural benefits.
The perceived benefits of a compacted city can be summarized as
-(a) Protect agricultural output - By containing the urban size,
compact cities preserve open spaces on the urban periphery and increase agricultural productivity. "Protecting agriculture on peripheral lands in turn, increases the capacity to generate food and forest products for export, while increasing agricultural output for domestic consumption."5
(b) Transport Benefits - Low urban density tend to go together
with a high level of reliance on private cars, low use of public transport, and low levels of walking and cycling. In contrast, Newman and Kenworthy6, claim that compact city forms offer the opportunity for shorter work trip commute; more efficient and economically viable public transport; promotes a high level of accessibility for non motorized modes of transport and due to all the three above mentioned factors produce low levels of energy use per person in transport. This they hope to achieve because (i) compaction would draw home and work spaces closer together, (ii) concentrated development would provide a
large market for public transit.
(c) Infrastructure Benefits - Proponents call for the slowing or
stopping of urban sprawl by confining growth in contiguous areas adjoining built up spaces or by directing the growth to similarly constraint areas. In such a scenario public services will be more efficiently delivered at less cost. Sprawl causes unnecessary extension of public infrastructure to serve outlying areas.
(d) Economic Benefits - Considerable evidence exists that agglomeration or clustering economies created in densely- settled areas lead to higher per capita incomes
and faster economic growth rates (Ciccone and Hall
1996, Glaeser 2000, lhlanfeldt 1995, Rupasingha et al. 2000). The conventional explanation is that (i) proximity facilitates exchange (spillovers) among workers, thereby raising
productivity and stimulating innovation; (ii) cities are productive as they move ideas. An example of this is the remarkable geographic localization of patent citations; (iii) firms and people come to the city to reap benefits of the creative milieu; and (iv)
cities lead to higher aspirations to improve standards of living. (With the increasing requirement of higher skill levels in cities, people are being encouraged to gain those skills to secure better jobs.)
(e) More vibrancy - As income levels rise cities are remaking
themselves as consumer cities. While people earlier preferred
to live in suburbs and work in the cities, a reverse trend is now evident, where-in people prefer to work in the suburbs and live
in the cities. This indicates the renewed desirability of living in
cities. Higher density fuels a greater supply of restaurants and stores.
(f) Better Quality of Life - Cities in order to sell themselves bet-ter, are being repackaged as places that are safer to live. An example pointed out is the reduced crime rates in New York. A legitimate question being asked is whether the compact city will deliver the gains mentioned above or not. The debate has
brought forth a number of reactions. These views can be
clas-sified into three categories.
* De-centrists - those that favor urban decentralization and
reject the gains made through containment as being either 'modest at best' or 'unpractical to achieve'. Many amongst them espouse the cause of free markets to shape urban spatial structures.
* Centrists - those that believe in the virtues of high-density cit-ies and decry urban sprawl. They favor citcit-ies with high density and a firm-restrictive edge that controls the city's footprint.
- Compromisers - those that advocate middle line between the policies advocated by the centrists and the de-centrists.
The four main arguments pointed out against the 'compact city' by the de-centrists are
1. The compact city will not deliver environment benefits being
claimed,
2. Urban decentralization is inevitable,
3. Stopping decentralization has negative consequences wth regards to congestion, land prices and infrastructure provision, and
4. It is unlikely that compaction will improve the quality of life.
1.4 THESIS AIM
The aim of this thesis is two fold
-A. Analyze the claims that containment policies (high intensity development within a restricitive geographic area) leads to the
following gains - (1) saves farm land beyond the city edge and
thus increases agricultural output (2) induces shorter commute trips, thus more pedestrian and public transit usage, which in-turn cause less consumption of fuel and lower emission of harmful gases (3) brings about a better quality of life through greater social interaction and (4) causes economic benefits through economies of agglomeration.
B. Evaluate and suggest improvements to growth management
regulations and policies being implemented by a city like Delhi, based on the conclusions from the primary aim.
physical restrictions, used by the city to deal with its problem The thesis is divided into three parts. The first section is
treated as an introduction to the "compact city" concept and
is used to set up the analysis of the merits that follow. In the
second section I analyze whether a compact city will deliver the benefits that its proponents claim. It looks into the effect of density on urban travel behavior factors such as commute distances and public transit usage; the economics of the edge
condition; the claim that sprawl is inevitable and the relevance of compaction in developing countries (most of which are
already highly dense). The third section uses conclusions drawn from the second part to comment on the growth management
policies of a city in the developing world.
I chose Delhi as this city to be my case study, in part due to my familiarity with the city, but also because it offers a unique urban laboratory. Delhi's urban form could be described as the antithesis of the compact city form. Atypically, the city has
a sparse low-density development in the center and high-rise high-density at the periphery. The city owes this as much to its past as it does to its present political circumstances and planning policies. The city faces massive strains on
its infrastructure due to the high in-migration rates. To accommodate the growing population, the city in the past five decades has quadrupled in area. I evaluate the urban growth management tools such as such as taxation policy, land
use policy, development of satellite towns and imposition of
1. United Nations Department for Economic and Social
Information and Policy Analysis (2001 - revision) "World Urbanization Prospects", United Nations, New York.
2. Ades, F. and Glaeser, Edward L. (1995) "Trade and Circuses: Explaining Urban Giants" The Quarterly Journal of Economics, Vol. 110, No. 1 (Feb., 1995), 195-227, The MIT Press.
3. Sanyal, S., (2002) "Singapore's Future and Economics of Urban Agglomeration", Deutsche Bank Research.
4. Krugman, P. (1988) "Increasing Returns and Economic
Geography", Journal of Political Economy XCIX (1991) 5. Ewing, R.H. (1995) "Characteristics, causes and effects of sprawl: a literature review." Environmental and Urban Issues, Spring, pp. 1-15
6. Clark, Thomas A. and Tsai, Te- Albert (2000) "The Agricultural Consequences of Compact Urban Development" in Jenks and Brugess (eds.) "Compact City: Sustainable Urban Forms for Developing Countries"
7. Newman, P W.G. and Kenworthy, J.R. (1996) "The Land Use Transport Connection - An Overview" Land
Use Policy, 13(1)
(A) DENSITY AND TRAVEL BEHAIOR
ARGUMENTS FOR COMPACTION ANALYSIS - I
URBAN FORM AND TRAVEL BEHAVIOR -I
CHAPTER OUTLINE
Arguments FOR Compaction
2.1 Brings work-home closer-more walk/bike trips - ELKIN 2.2 Reduces gasoline usage - NEWMAN/KENWORTHY 2.3 Positive correlation b/w city size and auto use - ECOTEC Counter Arguments
2.4 Difficult to mould density. - Urban Spatial Structure is the result of the interaction between land markets and regulation.
2.5 Influence of multi-family households and unpredictable future jobs on the dispersion of home and job locations.
2.6 Increased "family & personal" trips 2.7 More suburb to suburb trips. 2.8 Influence on income levels
2.9 Personal idiosyncracies and cultural preferences. 2.10 Hypothetical Model
Prominent amongst the centrists have been Newman and Ken-worthy. They claim that a compact city casues shorter work-trip commutes; fosters economically viable public transport; pro-motes a high level of accessibility for non motorized modes of transport. And due to all the three mentioned factors consume
less fuel and hence lower the emission of harmful gasses.
2.1 ELKIN, McLAREN and HELLMAN
Elkin, McLaren and Hillman espouse the cause of a compact city that leads to lower automobile dependence. They aim to achieve shorter commute trips (for all essential daily require-ments) by creating compact self-contained mixed use urban settlements. In their book Reviving the City: Towards Sustainable
Urban Development, they point out that "even a 4 mile radius
would put one in touch with most day to day requirements. School catchment areas are generally much smaller than that and in employment, a wide range of
job opportunities are
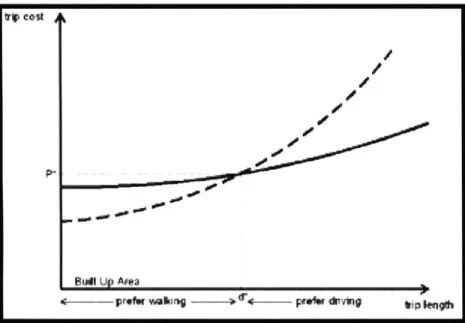
avail-able within that distance."1 They further argue that nearly three quarters of all commuting journeys in the UK are five miles or less in distance and the bicycle could be used to cover distances that cannot be met by foot.Fig. 2.01: Utility curves of walk and automobile trips.
Source: Boarnet, Marlon G., and Crane, Randall, (200 1) "Travel By Design: The
Influence of Urban Form on Travel"
Beyond a certain length "d*" the cost of a car trip becomes less than that of a walk trip. By adopting compaction policies, centrists hope to reduce work-home trip lengths to less than d*; or by policies such as raising fuel and parking expenses they hope to shift "d*" to the right.
2.2 NEWMAN and KENWORTHY
/
/ '9
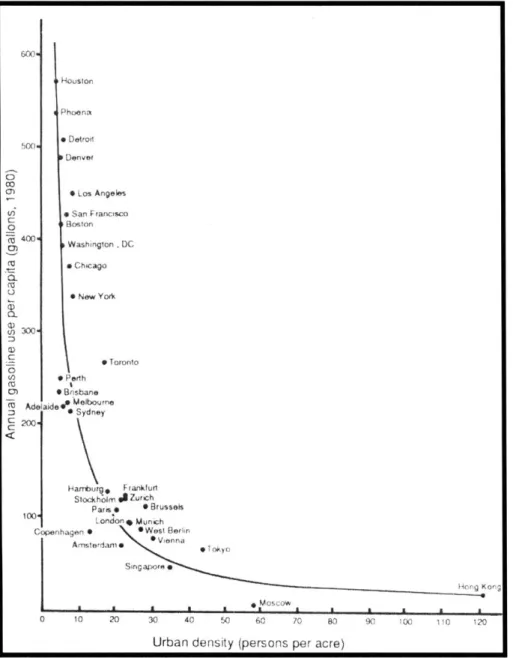
In 1989, Newman and Kenworthy published their book Cities
and Automobile Dependence; in which they claim that met-ropolitan density is the primary factor that determines auto dependence, and that auto use declines swiftly where overall densities exceed 30-40 persons per hectare. [Refer Fig. 2.02] They suggest that planners should redensify cities by means of infill development to reach the above mentioned density lev-els. Their findings were based on cluster and fractal analysis undertaken on a sample set of 32 global cities.
"Average gasoline consumption in U.S. cities was nearly twice as high as in Australian cities, four times higher than in Euro-pean cities and ten times higher than in Asian cities. Allowing
for variations in gasoline price, income, and vehicle efficiency
explains only half of these differences."2 They conclude that
land use intensity has the most significant correlation with gas-oline consumption. Newman and Kenworthy argue for more compact and more monocentric urban land use patterns and investment in urban rail transit systems.
2.3 ECOTEC REPORT
The 1993 study conducted by ECOTEC Research and Con-sulting Ltd. stated
tip IeI9
1. Higher residential densities within settlements were
associated with reduction in travel demand and encour-aged emission efficient modes of travel. Although it was
Hos"on difficult to reveal precisely the threshold density levels
Phoenm beyond which travel demand is reduced.
0 Detroit
500*
2. City size was positively correlated with travel
de-* Los Angeles mand. Hence the trip lengths in widely spread out rural
e San Fraisco areas was much higher than those in cities. However
B
ioston
00. Washington.Dc cities in UK with less than 50,000 inhabitants were
e Chicago less transport emission efficient as compared to larger
.NewYo* settlements.
3. Urban structures with centralized employment and 0 Toronto
0 other high travel generating activities significantly
in-eBnsbane creased the use of public transport.
-F Adelade Moun * Sydney C 200-C Harmburqg Frankfurt Stockhojm Zurich Paris e Brussels 10o London* Munich
Copenhagen 6 *West Berln
Amsterdame Vienna
Sing apore
-MI ong Kon g
0 10 20 30 40 50 60 70 80 90 ;00 110 120
Urban density (persons per acre)
Fig. 2.02: Population Density versus Annual Gasolene Consumption per capita. Source: Newman, Peter and Jeffrey Kenworthy (1989) "Cities and Automobile Depen-dence: An International Sourcebook."
COUNTER ARGUMENTS
A number of researchers such as Gordon and Richardson, Gomez-lbanez and David Hall to mention a few, argue that density by itself explains little for the amount of car usage, pub-lic transit usage and pedestrian trips.
2.4 ROLE OF URBAN FORM ON TRANSPORT BEHAVIOR
A primary flaw in the centrist's argument lies in the notion of density they portray. They look at density as the constant aver-age density over a city, while much research shows that density
in cities generally follows a negative downnward sloping curve
when graphed with the CBD as the origin. [Refer Plates xx, yy, zz]. Secondly, density cannot be molded as desired. It is an out-come of the interaction of land markets and regulations. According to literature on urban economics the downward
sloping curve can be explained
thus:-Choosing a home location is a trade-off between commute times and space requirements. Proximity is defined in terms of time and money required for transportation. The demand is thus greatest at the center of the city, since in the traditional mono-centric city model, work locations exist in the Central Business Districts. Now since the determination of the price of land is based on the demand, the land in the center is most expensive. The more expensive the land is, the more likely that it shall be
densely developed, as builders trade-off construction costs against unit land costs. This explains the high land cost and den-sity in the center and their progressive fall as one moves to the suburbs. As time passes, densities in the inner populous zones tends to fall, due to the flight of people to the suburbs. The city as a whole tends to spread out. The movement of people to the suburbs can be attributed to (a) reduction in prices and greater efficiency of transportation systems, (b) greater affinity for larger plot of land, (c) desire to co-locate next to business and labor market which might have moved out because of inner city con-gestion making it more expensive to transport goods and (d) cheaper land in the suburbs.
Density maps drawn by French scientist Meurot (1898) and Mark Jefferson (1909) and studies conducted by Colin Clark, (1951) [refer Fig. 2.03] and Alain Bertaud & Stephen Malpezzi (2003) [refer Fig. 2.04) corroborate this trend over a period of
time.
Compact City proponents assume that the city forms can be molded to desired shapes. However this is highly unlikely. Citie display a certain inherent inertia to chane. They are resilient and are not easily altered. The Urban Spatial Structure are cre-ated by the interaction of land markets and regulations. Very few cities have displayed a change in urban form. Curitiba can be sited as an exception and even in this case it took 15-20 years for the city to develop along linear transport corridors.
*~ARS Wnw.I -- ~A, I , , -V1.
64
. 4 i am biff 23 U Nd *
J.1 At 2 it 134
bL La I qW LNI W M MAL. r#wu LILMIM WM.& ffu LUINIF
ina 4 I ~ ~ Z ~ -~ IL 4 4 a ~ ~ * ;7-~ .414
jo
1
j
V4 2 ILL-_M '
i
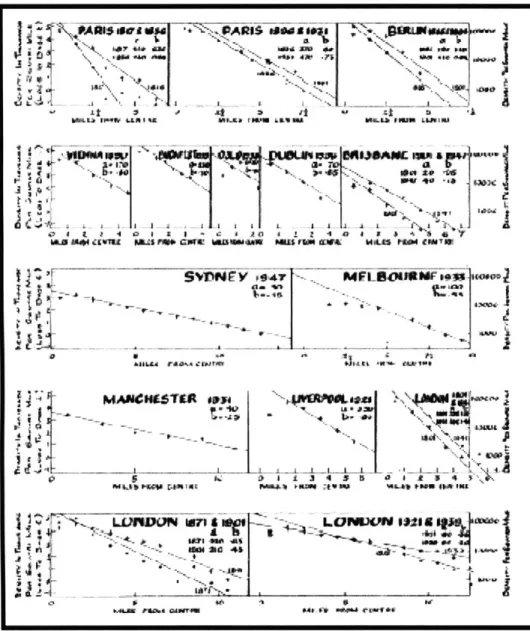
1HL PM- *rir11dtt 6" *LIN ~ A - I - t -- VS - 4In his paper, Colin Clark plots the average density in each tract against its distance from the centre of the city. Using this method for different cities, he shows that the falling off of densities follows an exponential decline, given by the formula
y = Ae - bx
where x is the distance from the center of the city and y is the residential density.
Through a series of graphs he shows that the negatively sloped curve of density was a phenomenon seen in most cities. [Refer Fig. 2.03]. However the slope of the curve varied widely between cities. A high value of b representing a sharp decline in densi-ties. The value of b was largely dependent on the cost of travel. The coefficient A represents the degree of overcrowding that the citizens were willing to accept in the center of the city (at x=0).
Fig. 2.03: Graphs showing historical density profile in cities
around the world.
Source: Clark, Colin (1951) "Urban Population Densities" Journal
of Royal Statistical Society. Series A (General) Vol. 114 Nos. 4
I 1'
BM-W
I.
Stephen Malpezzi and Alain Bertaud formu-lated the 'compactness index' -"rho" -the ratio between the average distance per person to the CBD, and the average distance to the center of gravity of a cylindrical city whose circular base
would be equal to the built-up area, and whose
height will be the average population density, p = (S, diw) / C
The p is used as a measure of sprawl in mono-centric cities and those polymono-centric cities where the CBD and the center of the city coincide.
Fig. 2.04: Density gradients in various cities around the world
Source: Bertaud, Alain and Malpezzi, Stephen
(1999) "The Spatial Distribution Of Population in
35 World Cities: The Role of Markets, Planning and Topography", Wisconsin-Madison CULER Working Papers, The Center for Urban Land Eco-nomics Research - University of Wisconsin.
The effect of Urban Form on Travel has intrigued urbanists. Alain Bertaud finds that "dense contiguously urbanized and dominantly monocentric cities are favorable to transit and may significantly reduce trip length and as a consequence the total amount of harmful gasses emitted." The reason being, that a geometrically central location will provide trips of a shorter length to all other
locations in the city. In a polycentric city each sub center
gener-ates trips from all over the built up area of the city. Trips show
a wide dispersion of origin and destination and tend to appear
random. [Refer Fig. 2.04]
Even though the density gradient of polycentric cities is negative,
their slope is much flatter as the proximity to center confers less of
an advantage as compared to the monocentric city.
distance from C BD CO distance from CBD
CBD
A, B, A' & B' - secondary, tertiary nodes
Fig. 2.04: (top- right) Schematic representation of trip patterns within a metropolitan area.
Source: Bertaud, Alain (2002) "Note on Transportation and Urban Spatial Structure"
Fig. 2.05: (below -left) Conceptualised density gradients of polycentric and monocentric cities. Source: Author distance from C BD -I. A' B'P A dAnce. fro CBD
2.5 INFLUENCE OF MULTI -WORKER HOUSEHOLDS AND
UNCERTAIN FUTURE JOB LOCATIONS
Compaction policies work on the premise that when choosing
a home location, each household will consider a trade-off
be-tween the value of access to their job against the cost of hous-ing. This standard model is based on a mono-centric city, i.e. a city with a single site for employment and declining equilibrium rents and densities with increasing length of the commute. However with increasing incidence of multi-worker households and multiple job locations, the task of choosing home loca-tions has become more complicated. In the US, 60% of
mar-ried households have both spouses working. Today most cities have employment sources in many centers and sub centers, changing the traditional single centered urban structure into a variety of multi-nucleated urban forms. Gordon and Richard-son (1989) state, "By 1980, only 7.5% of jobs in the largest
US urbanized areas remained in the Central Business District
(CBD)."3
Urban economists such as Curran (1982) and White (1977) hold that a two-worker household would potentially prefer to locate at a place accessible to both job markets. Thus leading to possible home locations which are in-between job centers and not necessarily adjacent to either of them.
Complicating the matter further, Crane (1 996) argues that in
an environment where job location may change and where it
is costly to move, people will consider future job options rather
than focus on minimizing current commute distances. He thus predicts, "shorter commutes for people with relatively small job change costs and relatively low home move costs" and "higher commuting costs per mile, and less job turnover" 4
On a similar line of thought, Brueckner (1981)5 points out the
relevance of local amenities (malls) and multiple employment
Fig. 2.06: Affect of multi-worker household and amenities in choosing home locations. [WI & W2 -Work locations and A -Location of Amenities]
Source: Author
dl, d2 and d3 represent the utility of factors W 1, W2 and A when deciding on a
centers when deciding between housing sites.
More trips today are made primarily for 'family', 'personal', 'social' and recreational'. The journey to work trip is no longer the defining travel experience. In the US considerably fewer than half the automobile trips are work-home trips.
Factors such as these lend credence to the idea of "wasteful" or "excessive commute". A number of research papers mention that aggregate commuting far exceeds the amount necessary to minimize the equilibrium work-home trips.
Piraski (1987) shows that most commuting in the US is suburb to suburb. The co-location of firms and households at decen-tralized locations has reduced and not lengthened commute times.
2.6 AUTO-DEPENDENCE and INCOME
Gomez-Ibanez7 writes that auto dependence is partly caused
by low land density; but also by other factors such as income
levels, gasoline prices and public policies to subsidize public transport and highway use. As income grows there is a greater demand for land-extensive housing and commercial building types. Rising incomes also encourage businesses to substitute capital and labor; for example - more office space per worker or single story manufacturing plants instead of a vertical
ex-Many research papers have indicated that while high den-sity neighborhoods do show low VMT's, at the same time these neighborhoods were also associated with low income
levels. Kulkarni (1996)8 finds that the statistically significant association between neighborhoods and car trip rates are
more an association between household incomes and car trip rates.
Building stock tends to reflect the incomes and transporta-tion price levels that prevailed when it was built. Even when income and price levels change it is seldom economical to tear down older buildings and rebuild new densities. For example, London and Los Angeles were built at different time periods. The later was built in an auto era and for a wealthier population.
2.7 TRAVEL PREFERENCES
It is difficult to account for personal preferences. For
exam-ple, shortening trip distances may promote walking, but they might also increase the number of trips taken by car. People may decide to shop more often and they may well continue using their cars to do so.
Further exploration needs to be done on how a change in
trip distance influences the individual desire and ability to take trips by various modes.
2.8 HYPOTHETICAL MODEL
I created a hypothetical model to study
* the influence of (or lack of) urban form on travel
* the effect of work-home location on distance commuted.
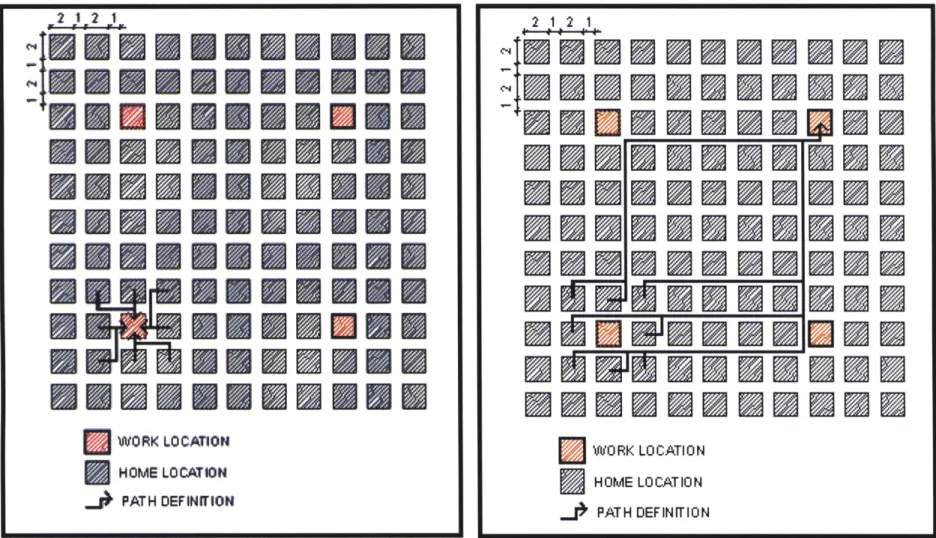
The model is based on an 11 x1 1 grid [refer fig. 2.xx] with an
average density of 2 blocks per grid (i.e. a total of 242 blocks). Each grid has been arbitrarily assigned as being 2 units in length and width. Each grid has a 1 unit wide street running on all four sides. To simplify calculations, each block is assumed to house one person. Hence by default it represents a single worker household.
To simulate the first part of the stated goal, i randomly assign blocks to the grid. The blocks are juxtaposed bearing in mind that the average density of 2 blocks per grid is maintained. Also, to simulate a realistic spread, further caveats are added - that the minimum coverage be more than 75% of the grids and that
no grid can have more than 25 blocks on it.
To resolve the second aim of the model, three different work-home location scenarios are created.
2121 r-trr
U"
44VA
WAU
N
M W1ORK LOCATION HOME LOCATION SPATH DEFearr10NNFig 2.07: Grid -Scenario 1: Monocentric city model Source: Author.
UZ
U
JW2= WOO am W E M M M UN E am Mliffim
W
E! NEI
aWORK
LOCATION INHOME LOCATIONUUIN11
11 Um
IsUmI
a
Um
INN
ME
Em
Is m
Im
m
In m
oil
U
U
U
PATH DEFINITIONFig 2.08: Scenario 2: Polycentric 'ideal' model. Source: Author
2 1
WORK LOCATION HOME LO CAT10N
PATH DEFINWrION
Fig 2.09: Scenario 3: Polycentric 'worst case' model Source: Author .. ... ... 2 1
19
Im
sm RE EmEl
Im Im
Im Im
Emmmagi
off
IN
11 IN
ffi
genmam
g
1. Recreating the monocentric city model, four blocks adjoining the
central grid are demarcated as work blocks, and all residents work in these central blocks. [Refer fig 2.07]
2. Representing the polycentric city model (or multiple employment
cen-ters), four blocks in each of the four corners grids are demarcated as work grids. Everyone is then assumed to work in one of the blocks near-est to his or her assigned home location. This is an ideal case situation for the multi-centric city. [Refer fig 2.08]
3. The third scenario is similar in set up to the second. It differs only in the fact that each resident is assumed to work in a block furthest to their home location. This represents the worst-case scenario for the polycen-tric city model. [Refer fig 2.09]
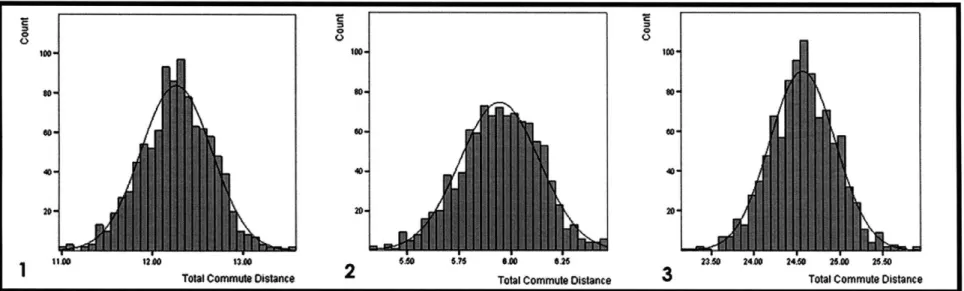
A thousand randomly assigned block permutations were then selected
in each of the three scenarios. The work trip distances were then
com-puted and results are shown in Table 2.01 and Fig. 2.10 Scenario 1 Scenario 2 Scenario 3
Monocentric Polycen- Polycen- Mean of Case 2
Model tric Model tric Model and Case 3
(ideal) (worst) Mean 12.27 5.95 24.57 15.26 Median 12.28 5.95 24.58 15.26 Maximum 10.96 5.32 23.15 14.23 Minimum 13.59 6.47 25.93 16.20 St. Deviation 0.39 0.19 0.38 0.29 N 1000.00 1000.00 1000.00 1000.00
Table: 2.01 Tabulated results of the Hypothetical Model.
RESULTS OF THE MODEL
* the manner in which blocks are placed on the grids
has a significant effect on total commute distances. The standard deviations are substantial, considering the fact that this is a miniature model dealing with a grid of 11
x 11. These will be magnified manifold on a true scale.
e As was expected the 'Ideal' scenario (Case 2) per-forms the best. Distance commuted is half of case 1 and a quarter of case 3. Which brings to focus the question, how realistic is the notion of self-contained neighborhoods? Or is it a utopian concept?
* For the polycentric models, a realistic situation would be somewhere between case 2 and case 3. Assuming that to be the average of the two, gives us an average of the mean values as 25.26 units. This value is far greater than the monocentric model. In such a stylized situation the monocentric city out-performs. However, such as a statement would be fallicious, since the range
for the mean of the total commute distance is between
5.95 and 24.57. The randomness of the dispersion of
work and home locations in a polycentric city adds a lot of ambiguity to any comparison between the monocen-tric and polycenmonocen-tric city models.
TtCom D0 n26
2
Total Commute 01stanceU3o 2400 24.C0 25 stanc
3
Total Commute DistanceFig 2.10: Result Hypothestical Model [1. Monocentric Model; 2. Polycentric Model (Ideal situation); 3. Polycentric Model (Worst case situation)] Source: Author
LIMITATIONS OF THE MODEL
The model represents hypothetical scenarios, hence has obvi-ous limitations due to the many assumptions built into it.
* For starters, it isn't able to account for individual
idiosyncra-sies or cultural preferences in travel behavior.
* It assumes all trips made will be work trips and that even
these shall be one stop - starting from home and culminating at work (and vice versa) with no other destinations in between.
Multiple trips and other trips such as "personal" & "family"
trips are not taken into consideration.
* Even though I did consider the fact that below a certain
threshold distance many of the work trips would be made on
foot or bikes. These should be accounted for. However it was
difficult to come up with a figure that could precisely represent
this "threshold distance." As mentioned before this threshold distance [Refer Fig. 2.01] could depend on a number of fac-tors such as price of parking and fuel costs.
The model has the potential of becoming more elaborate with some other factors (such as multi-worker households) being introduced to it. However, this would also lead to more assumptions being made, hence diluting the efficacy of the model.
1. Elkin, McLaren and Hillman, "Reviving the City: Towards
Sustainable Urban Development."
Total Commft 0Dstante I
1. Elkin, McLaren and Hillman, "Reviving the City: Towards
Sustainable Urban Development."
2. Newman, Peter and Jeffrey Kenworthy (1989) "Cities and Automobile Dependence: An International Sourcebook."
3. Gordon, P. and Richardson, H.W. (1997) "Are Compact Cities
a Desirable Planning Goal?" Journal of the American Planning
Association, 63.
4. Crane, Randall (1996) "The Influence of Uncertain Job Location on Urban Form and the Journey to Work" The Journal of Urban Economics, 39
5. Brueckner, J.K. (1981) "A Dynamic Model of Housing Production." Journal of Urban Economics, 10.
6. Boarnet, Marlon G. and Crane, Randall (2001) "Travel By Design: The Influence of Urban Form on Travel."
7. Gomez-Ibanez - Journal of American Planning Association 57(3).
3.1 AIM OF THE EXERCISE
ANALYSIS - II
URBAN FORM AND TRAVEL BEHAVIOR- Il
CHAPTER OUTLINE
The primary goal of this exercise is to ascertain whether there exists a correlation between urban density and transportation behavior factors such as 'median travel time (for work trips)', 'percent modal split by public transit, pedestrian and bike modes' and 'private motorized vehicle ownership'. To accomplish these objectives, statistical tools - univariate and multivariate regression, cluster and fractal analysis are undertaken on a global city data set.
3.1 AIM OF THE EXERCISE
3.2 THE DATA SET
3.2 THE DATA SET
3.3 LIMITATIONS OF THE EXERCISE
3.4 OVERALL TRENDS
3.5 TRANSPORTATION and DENSITY
Correlation Analysis
- Density vs. Median Travel Time for Work Trips - Density vs. Modal Share of Public Transit
- Density vs. Private Motorized Vehicle Ownership
Multivariate Regression Models
- Public Transit Model Split regressed with City Product
per capita, gasoline price, city size and travel time.
3.8 CONCLUSION
The data set has been drawn primarily from the UN Habitat's
GOU (Global Urban Observatory) database, which contains
data for more than 200 cities. The data was collected by local and national bodies in each city and represents a time period from 1993 to 1998. Other sources used in compiling the data include, the US Census data, World Bank - World Development Indicators, CEROI (City Environmental Indicators Encyclopedia), London Census Data and Hong Kong Census Data.
The data corresponds to 'urban agglomeration', which is defined by the UN GOU as the "built-up or densely populated area containing the city proper; suburbs, and contiguously settled commuter areas". This is different from the definition of a metropolitan area, which in turn corresponds to the administrative area delineated by the local city governments.