HAL Id: hal-03001876
https://hal.inria.fr/hal-03001876v2
Submitted on 28 May 2021
HAL is a multi-disciplinary open access
archive for the deposit and dissemination of
sci-entific research documents, whether they are
pub-lished or not. The documents may come from
teaching and research institutions in France or
abroad, or from public or private research centers.
L’archive ouverte pluridisciplinaire HAL, est
destinée au dépôt et à la diffusion de documents
scientifiques de niveau recherche, publiés ou non,
émanant des établissements d’enseignement et de
recherche français ou étrangers, des laboratoires
publics ou privés.
Passive Delay Measurement for Fidelity Monitoring of
Distributed Network Emulation
Houssam Elbouanani, Chadi Barakat, Walid Dabbous, Thierry Turletti
To cite this version:
Houssam Elbouanani, Chadi Barakat, Walid Dabbous, Thierry Turletti. Passive Delay Measurement
for Fidelity Monitoring of Distributed Network Emulation. 19th Mediterranean Communication and
Computer Networking Conference (MedComNet), Jun 2021, online, France. �hal-03001876v2�
Passive Delay Measurement for Fidelity Monitoring of Distributed
Network Emulation
Houssam ElBouanani, Chadi Barakat, Walid Dabbous, and Thierry Turletti
Inria, Université Côte d’Azur, France
Abstract— Emulation has become a popular approach for the validation and evaluation of network research. It provides researchers with a contained, customizable, and scalable testing environment, which can be easily packaged and published for potential readers to reproduce their results. However, as the network components are only virtual, emulation lacks the inherent realism of physical testbeds. In light of this, monitoring specific metrics of the emulated network has been proposed as a solution to mitigate to some degree inaccuracies caused by emulation. While this is not difficult to implement in a single-machine setting (e.g. with Mininet), monitoring is limited by the lack of time synchronization in scenarios where the emulation is distributed over multiple physical machines (e.g., Distrinet). In this paper we tackle the case of packet delay monitoring, to which we propose a methodology for passively measuring one-way delays with underlying assumptions about time synchronization, and round-trip delays otherwise. For an efficient implementation of our methodology, we propose an eBPF-based packet measurement tool that performs better than current packet sniffers under emulation-specific assumptions. We implement and evaluate our system in an open testbed and show that it can reach results within few microseconds of perfect accuracy and precision.
I. INTRODUCTION
The design and engineering of new network protocols and architectures require rigorous functional testing and evalu-ation to finely examine their implementability and perfor-mance in practice. Network emulators, such as Mininet [1], are becoming popular means to conduct network experimen-tation. These tools mimic the operation of network hardware using software tools, on which they can run actual application and operating system code. As such, they allow users to create and reproduce lightweight network testbeds on their computers through an easy-to-use Python interface.
However, researchers have shown that network emulators do not always provide perfectly accurate results [2]. In fact, as they are designed for running on everyday laptops, their emulation of multiple events (e.g., running code in emulated hosts, switching and routing multiple packets in parallel, etc.) is very limited by the available computing and network resources [3]. This renders them practically unusable for emulating latency-sensitive scenarios or those that require packet-level precision. Researchers have thus proposed fidelity monitoring [4] as a way to achieve more ac-curacy and precision by appropriately allocating computing and/or memory resources for emulated hosts and by finely monitoring the network packets throughout their journeys in the network. Essentially, as each packet at each hop of its path will experience multiple amounts of delay (propagation, transmission, queuing, switching, etc.), the experiment may
be labeled "inaccurate" if an unacceptable fraction of the packets were not appropriately delayed on each of the emulated links. Even though other performance metrics can be also monitored (e.g., bandwidth, queues’ sizes, etc.), the fine-grained monitoring of packet delays can ensure very high-fidelity emulation with good enough guarantee on ac-curacy, and can also be used to monitor overall performance and infer information about other metrics, especially the bandwidth and the queues’ sizes.
Emulators do not scale perfectly well either. In computing-intensive scenarios, Mininet cannot emulate more than a certain number of hosts and network hardware devices due to resource limitations inherent to the physical machines intended to run it. Several researchers have thus worked on distributed versions of Mininet, ones that let users emulate large-scale networks over a geographically localized cluster of multiple physical machines. Distrinet [5] is one such iter-ation that particularly focuses on reproducibility by natively allowing users to run their emulations on public clouds such as Amazon’s AWS or on private cluster of machines.
While each of the aforementioned solutions can offer either more reproducibility and scalability, or more accuracy, combining the two is a very complicated task. In fact, packet delay monitoring requires measuring packets’ delays between multiple nodes of the virtual network, but in a distributed setting, such virtual nodes can be hosted at different physical machines, which generally do not have the same perception of physical time even if geographically localized. Therefore, implementing fidelity monitoring on a distributed network emulator raises a complicated sub-problem: accurate passive delay measurement between phys-ical machines of a network. In this paper we focus at tackling this problem in the particular context of distributed network emulation. Specifically, we answer the following questions: how can one accurately monitor packet delays in a distributed environment? and in particular, how can one passively measure delays of packets exchanged between physical machines in a cluster?
Our contributions in this work are manifold: we present a methodology to passively measure the one-way delay (OWD) of packets –with an accuracy of up to mere microseconds– between physical machines and/or virtual machines hosted on separate physical machines, to be used for monitoring purposes in the context of distributed network emulation. We further present an extension of our methodology to the monitoring of the round-trip delay (RTD) in scenarios when accurately measuring the OWD is not possible due
to time synchronization assumptions. We also introduce a non-intrusive packet measurement tool based on the extended Berkeley Packet Filter (eBPF) [16], which is highly compat-ible with network emulators. The new packet measurement system is then evaluated on a real testbed to show that it can reach its objectives.
The remainder of this paper is organized as follows. In Section II we quickly present a background on delay measurement and time synchronization. We then move on to present our experimental setup in Section III. In Sections IV and V we introduce methods to passively measure one-way and two-one-way delays respectively with high accuracy. We finally benchmark our measurement tool against stan-dard packet sniffers in Section VI, before concluding and discussing our current and future work on high-fidelity distributed network emulation in Section VII.
II. BACKGROUND
A. Delay Measurement
Unlike the throughput which is a flow-level measure, the network delay characterizes either an individual packet, or a pair of request-response packets. Researchers have therefore identified two types of network delay: the OWD defined in [6] and the RTD in [7].
The OWD of a packet P between two machines A and B (which can be user terminals, servers, routers, switches, etc.) separated by a communication medium (wired or wireless) is the duration of (absolute) time between the instant when A sent the first bit of P , and the instant when B received the last bit of P . Three quantities contribute to the OWD:
• The equipment delay: which mainly consists of the amount of (absolute) time that the packet will spend in the queue waiting to be transmitted;
• The transmission delay: the amount of (absolute) time
needed for the transmitting hardware (NIC, router in-terface, switch port, etc.) to write the packet on the physical medium. This delay depends on the writing speed of the hardware, the transmission speed of the medium (also known as its bandwidth or capacity), as well as the size of the packet; and
• The propagation delay: the length of (absolute) time needed for the signal to travel from A’s transmission hardware to B’s receiving hardware. It is mainly char-acterized by the propagation speed of the signal and the dimensions of the medium and does not depend on the size of the packet.
Note that in cases where A and/or B are virtual hosts, switches, or routers separated by a physical network (e.g., A is a virtual machine hosted in a physical machine, and B, a virtual switch hosted in a different physical machine), the delay needs to be measured between the virtual NICs of A and/or B, not the physical NICs of their hosting physical machines. Thus when virtualization is involved, the delay of a packet also accounts for the delay between the virtual node’s virtual NIC and the hosting machine’s physical NIC. Accurately measuring packets’ OWDs and successfully decomposing them into their three components can give
useful information about the network: from the transmission delays of multiple packets, one can infer the bandwidth of the medium; a long equipment delay can signify congestion or saturation of computing resources; and a longer than anticipated end-to-end OWD can be evidence of network congestion or poor routing behavior. However, this is not always an easy task, and researchers have proposed many techniques to estimate the OWDs of probe packets up to varying degrees of accuracy, most of which require proper hardware (GPS systems, specialized NICs, etc.) [8].
An easier value to measure is the round-trip delay (RTD). The RFC 2681 [7] defines it for a pair of request-response packets P and Q as the duration of (absolute) time between the instant when A sent the first bit of P , and the instant when A received the last bit of Q. It is thus equal to the sum of the individual OWDs of packets P and Q, and the processing delay between the reception of the request packet by B and the sending of the response packet Q. Certainly, the information on the individual OWDs is lost when measuring the RTD, especially when the two ends are multiple hops away and therefore when the paths in the two directions cannot be safely assumed to be symmetric.
The use of ICMP echo probes is the de facto active method for measuring RTDs [9], [10]. It works by simply sending a probe "echo request" ICMP packet and waiting for the destination to answer with an equal size "echo response" ICMP packet. The source timestamps the instant when the request packet is sent and the instant when the response packet is received, and reports the round-trip time (RTT) as the difference between the two. It accurately measures the RTD with no need for time synchronization, and thus can be used in all cases without relying on external hardware. Other more powerful tools1,2 can be used to send upper-layers probes (UDP, TCP, or application-level protocols). B. Clock Synchronization
One-way delay measurement is intricately tied to the prob-lem of clock synchronization. Without specialized hardware to measure network delays, relying on software- or operating system-level mechanisms inevitably requires some degree of synchronization between clocks that ought to timestamp probe packets (or in the case of passive measurement, data packets) [11]. The problem particularly arises because the time dissimilarity between the clocks of different machines (called clock offset) changes over time. This is due to dif-ferences between the clock frequencies (called clock skew) which are sensitive to physical phenomena (such as hardware heating) that also change over time [12]. This problem has been extensively studied in the scientific literature, and numerous protocols based on different sets of assumptions have been proposed to continuously resynchronize clocks of machines connected by LANs or WANs.
The Network Time Protocol (NTP) is the most used solution for clock synchronization [13]. It organizes ma-chines into a tree-like hierarchy, where the root node is
1hping3: https://linux.die.net/man/8/hping3
the primary server which is generally connected to a highly reliable source of time (e.g., an atomic clock) and which will propagate its time to other nodes of the hierarchy through protocol messages; other nodes synchronize their clocks to the root server and eventually propagate the time to nodes in lesser levels of the hierarchy. The process reiterates as clocks naturally drift from each other. At the convergence of the algorithm, each node will be synchronized to its server with a precision on the order of the network jitter. Thus, in an Ethernet LAN, NTP can theoretically guarantee precision down to 100 or even 10 microseconds, provided it is given long enough time to converge.
As applications in distributed systems have become reliant on finer levels of time synchronization, a more powerful protocol was proposed: the Precision Time Protocol (PTP), also known as IEEE 1588 [14]. Just like NTP, PTP organizes nodes into a hierarchy of "masters" and "slaves" (where a node can be both a master and a slave) and uses protocol messages to exchange time information between nodes of the hierarchy. But unlike NTP, which can be implemented on any device with a Network Interface Card (NIC), PTP requires special NICs with integrated time clocks. This allows high-resolution synchronization by relying on the NIC clocks to timestamp protocol messages, thus avoiding all delays caused by software and operating system-level processing.
In [15], the authors show that with proper configuration of NTP and PTP software in a local Ethernet network, it is possible to achieve precision on the order of 10 microseconds with NTP, and on the order of 100 nanoseconds with PTP, without incurring much overhead on the network. In fact, they show that by synchronizing clocks every 8 seconds with NTP, the total overhead of protocol messages is 23B/s per client and the one of computing resources is negligible; and by using PTP, the total network overhead is 186B/s per client, and the one of computing is also negligible. In our work and in settings where time synchronization is needed, we will use their findings to configure our testbed.
C. Packet Monitoring
Packet timestamping is another inevitable requirement for passive packet delay measurement. Both end hosts need to record the instants each packet was seen by their NICs, and send that information to compute the delay from the indi-vidual timestamps. And as with clock synchronization, there are specialized hardware that can tap into NICs and extract information from data packets with minimal interference on the traffic. This solution, although most efficient in terms of performance, is not suitable for two main reasons:
• Firstly, it requires physical access to the machine on which the tap must be installed. This is especially restrictive in our context of network research where the user might be running her experiments on a remote grid or cloud; and
• Secondly, it cannot work in situations with virtualization
as packets must be timestamped at the virtual NIC level. It is also particularly ineffective when system-level traffic control mechanisms are in place to add
delay or bandwidth to physical or virtual links. Thus, any packet timestamping tool needs to be imple-mentable in virtual NICs and be compatible with traffic control mechanisms. To this end, using traffic sniffers (e.g., libpcap3) is the most straightforward solution. These tools simply capture packets as they go through the (physical or virtual) NICs for monitoring and analysis purposes. However, their intrusiveness in high-speed networks needs to be mit-igated by intelligent sampling. They are also not naturally compatible with traffic control, as they capture outgoing traffic after being shaped, but this too can be mitigated by system-level packet redirection.
Another solution is to leverage kernel tracers and the recent advances in kernel programming. The eBPF is one such solution that allows users run their code in kernel space through a secure and contained virtual machine with its own registers, memory space, and helper routines. More precisely, it allows users to attach pieces of code to certain kernel func-tions. Its use cases include monitoring and troubleshooting kernel operation, and high-performance packet processing (filtering, routing, etc.). It can also be integrated within the Linux Traffic Control suite [17] to perform powerful and flexible packet classification and traffic shaping with minimal overhead. We will use it in our work to implement a basic but efficient timestamping tool for passive delay measurements.
III. EXPERIMENTALSETUP
A. Testbed
All of the following testing has been performed on the open testbed R2lab 4. The platform includes a cluster of machines that are connected through Gigabit Ethernet wires and store-and-forward switches. In our tests, machines are running a Ubuntu 18.04 Linux distribution over a 4.15 kernel. Furthermore, we deactivate the machines’ processors’ C-states in order to avoid low-consumption modes that require waking them up whenever a packet arrives and needs to be processed. As we will use active delay measurement tools to compare and evaluate our method against, a constant processing frequency provided by the full-power mode lets them receive and timestamp packets as soon as they arrive to the NIC, and makes their reported measurements much more accurate and precise, which is a good reference point for our evaluations.
To evaluate how our delay measurement methodology behaves in different network settings, we leverage Linux Traffic Control [17], which is a standard tool used by network emulators to simulate links of different properties (band-width, propagation delay, packet loss, packet duplication, etc.). In parallel, we use ping, hping3, and tcpping as active RTD measurement tools to provide reference performance metrics to compare against. These tools allow for controlled probe sizes and sending rates, and will thus also serve as packet generators along our experimentation. We will also use netsniff-ng’s trafgen5 to customize packet generation
3libpcap: https://www.tcpdump.org/
4R2lab Anechoic Chamber: https://r2lab.inria.fr/ 5netsniff-ng: http://netsniff-ng.org/
when it is necessary. As for timestamping, we will use an eBPF program to capture and timestamp incoming or outgoing packets, and also the libpcap Linux utility for comparison. The collected data is later analysed by a Python program. We provide scripts6 to reproduce all our results. B. Packet Identification
Identifying packets is necessary for passive delay measure-ment. For both OWD and RTD measurement, timestamps at the source and destination hosts have to be matched to compute the delay. Ideally, the hosts can simply identify packets by their order, i.e. the first packet sent from a source A to a destination B corresponds to the first packet received at the destination B from the source A. But as packets can be lost or arrive unordered due to several reasons, more sophisticated mechanisms have to be implemented. The second easiest way is to tag all packets, either by a unique packet ID, or even directly by adding the packet timestamp to its header at the source. However, this requires unnecessary modifications to the operating system’s network module, and can incur non-negligible network overhead at scale.
In our context of distributed network emulation, all packets are encapsulated in UDP datagrams as soon as they leave the emulated host (Distrinet uses VXLAN while Mininet Cluster and Maxinet use GRE). We can therefore safely make the assumption that all packets are IPv4 packets, and for each flow of packets sent from a certain source to a certain destination, use the native ID field of IPv4 as identification tag. Unfortunately, this still has two major limitations: the ID field in IPv4 headers is shared between all fragments of a long packet and is encoded on 16 bits only which can lead to collisions. The first limitation can be managed by considering the pair (ID, Fragment Offset) as identification tag; the second limitation is trickier since packets with the same ID from the same source can arrive unordered. However this generally does not happen very often, but to assume this, we must ensure that packets take less time to get to their destination that it takes for their source to circle through the range of possible packet IDs. Formally, the assumption holds when ∆ < 216τ , where ∆ is an upper bound on the network delay, and τ is the average interarrival time of packets (equal to the average packet size over the bandwidth). It is generally the case as longer links (i.e. larger propagation delay) correlate with lower bandwidth (i.e. larger interarrival time). And even in our testbed with high bandwidth-delay product and small packets, this condition holds as 216τ = 30ms and ∆ < 1ms.
Thus in our delay measurement system, all packets are identified by a hash of the (Source Address, Destination Address, Packet ID, Fragment Offset)fields from their IPv4 header.
C. Workflow
The idea is simply to intercept and timestamp, by each machine, all sent packets as late as possible, and all received
6See https://github.com/helllb/delay
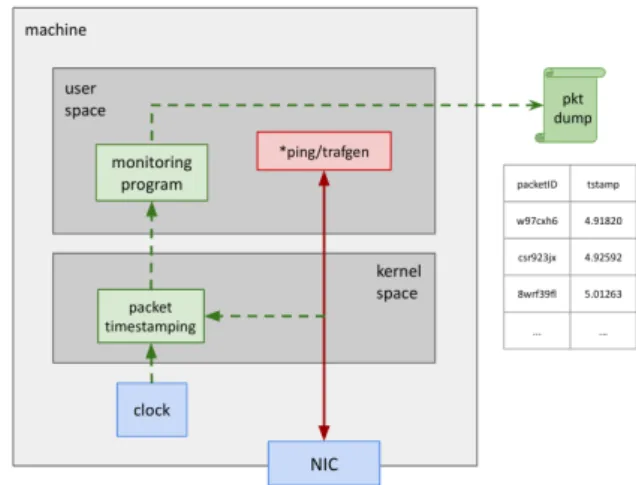
packets as soon as possible. This information is sent from the intercepting program to a user space agent that compiles it into a packet dump, from which a collector creates tables of (packet ID, timestamp) pairs that are matched to compute the delays as timestamp differences, see Figure 1.
Fig. 1. Estimated OWD under NTP.
IV. PASSIVEOWDMEASUREMENT
In this section we study the extent to which it is possible to passively measure the OWD, i.e., the delay of data packets exchanged between a pair of physical machines from the testbed. From the packet dumps generated in accordance with the previously described workflow, we measure the OWDs of packets using the method described in Algorithm 1.
Data: Packet dumps from A and B: dump_A, dump_B
Result: Array of (packet_ID, owd) pairs initialize array OWD;
foreach (packet_ID, timestamp_A) in dump_A do lookup matching packet_ID in dump_B with the
closest timestamp_B;
compute owd := | timestamp_B - timestamp_A | ; add (packet_ID, owd) to OWD;
end
Algorithm 1: Passive OWD measurement algorithm Following the definition in Section II, the OWD of a packet P between two machines A and B is the sum of the equipment and transmission delay introduced by A’s NIC and the switch’s egress port, and the propagation delay on the Ethernet cables connecting the two machines to the switch. By keeping the packet sending rate below the links’ capacity and the NIC and switch’s port transmission speed, we can eliminate packet queuing altogether. Further, in our setting of perfect symmetry, i.e., two machines with the same hard-ware and operating system configuration connected through symmetric links to identical switch ports, the delay can be safely assumed to be equal in both directions. Additionally, since ping is designed to send a response packet as soon
as the request packet is received, the processing time does not exceed 1µs and can therefore be considered negligible compared to the packets’ delays (larger than 80µs). Thus, for a pair of request-response packets P and Q of equal size (e.g., a ping echo), we have:
RT D(P, Q) ≈ OW D(P ) + OW D(Q) = 2 · OW D(P ). We can thus use half of the round-trip time (RTT) reported by ping as a ground truth, apply our method to passively measure the ping echo packets’ OWD, and compare the two to evaluate the accuracy of our passive method.
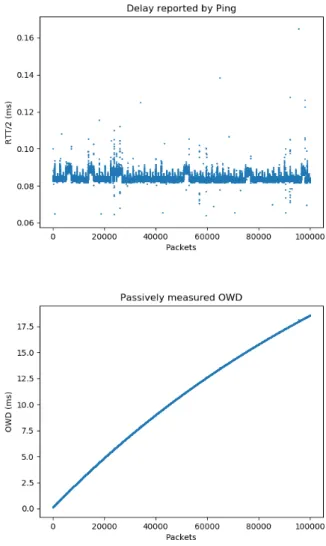
However, without proper time synchronization, it is prac-tically impossible to accurately measure the OWD between two physical machines of different clocks. Consider for example the plots in Figure 2. We compare the OWDs of ICMP echo request packets measured by our method with no clock synchronization (bottom), together with the halves of the RTTs as given by ping (top), for a large number of ICMP echo packets sent with 1 ms interval. We can clearly see how the two machines’ clocks drift over time, how this drift affects the measurement of the OWD, and how it is difficult to predict it as it changes from time to time. In general, the clock skew is variable with time as it depends on uncontrollable physical phenomena (e.g., hardware heating) which causes clock offset between the machine that changes in a non-linear fashion. Note also how the clocks largely drift (17 milliseconds in a 100 seconds-long run) relative to the standard deviation of the ping RTTs (few microseconds), making the noise caused by the clock offset hide all the information from the actual network delay.
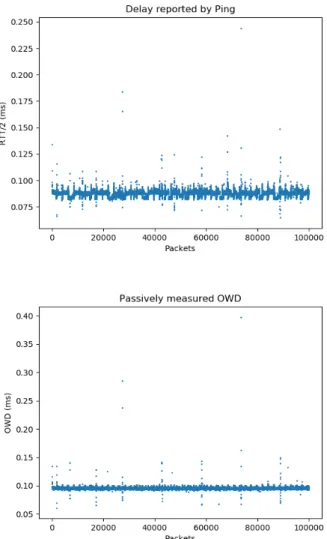
Nevertheless, running NTP on the testbed almost perfectly solves the problem. At the convergence of the NTP process for clock synchronization and frequency stabilization, the clock offset and skew are almost neutralized and our method starts reporting good results. We can see this in Figure 3, where we report on the results of our method after NTP has stabilized. We can notice how at convergence of NTP, the average measured OWD is only 8µs away from half the average RTT reported by ping, and its standard variation is even 800ns smaller. Although it is difficult to comment on the difference of averages which can be due to imperfect synchronization, our method gives more regular results (ex-pressed in smaller standard deviation) because it timestamps packets sooner than ping does, and therefore is not sensible to the variation of the added system delay. We will comment more thoroughly on this later in the paper.
V. PASSIVERTD MEASUREMENT
The OWD measurement method gives accurate results only if the end hosts’ clocks are highly synchronized. While this is not impossible in practice thanks to NTP, it requires that the machines be in a local network with reasonably low delay and jitter values to be able to reach high-resolution time synchronization. Furthermore, the NTP algorithm can take long time to converge. In our setting, the convergence of NTP was observed two hours after NTP had started. This makes OWD measurement difficult and inflexible. In this
Fig. 2. ping RTT (top) and measured OWD (bottom).
section we will propose a new method to passively measure the RTD that does not require such strong assumptions.
For the RTD to make sense in the case of passive mea-surement, we will extend its definition from simple request-response packets, to almost any pair of packets. For a couple of packets P and Q such that P was sent before Q was received (see below), we define the RTD as simply the sum of their individual OWDs, tB
P − tAP and tAQ − tBQ, without
accounting for the "processing" time tB
Q− tBP by B between
the reception of P and the sending of Q. The time elapsed between tB
P and tBQis not relevant in the general case since P
and Q do not need necessarily to be related packets (unlike ICMP echo request-response, TCP SYN-ACK, etc.).
A
B
tA P tBP P tB Q tAQ QFig. 3. ping RTT (top) and measured OWD (bottom) after clock synchro-nization.
The method for passively measuring the RTD and OWD follow a similar approach: a program that captures and timestamps packets between the NIC and the upper layers is installed on the machines, then the packets dumps are sent to a collector which is in charge of computing the RTDs from the information in the packets (namely their IDs) and their timestamps. In the case of the RTD, for each pair of machines A and B, and for each packet P sent from A at time tA
P (in A’s clock) and received on B at time tBP (in
B’s clock), and Q sent by B at time tB
Q (in B’s clock) and
received on A at time tAQ (in A’s clock), such that tAQ> tAP, the collector will report the RTD of packets P and Q as:
d RT D(P, Q) = (tAQ− tA P) − (t B Q− t B P).
Similar to the previous passive OWD measurement method, this does not always give perfectly accurate esti-mations of the RTD. In fact, while it does eliminate any inaccuracy due to constant clock drift between the two machines, (i.e., the clock drift at time t = 0) it is still vulnerable to its variation. In fact, the longer the time interval between the two packets P and Q, the more the clocks might
have drifted during that interval, and the larger the error that will be induced. Thus, in practice, the collector should only stick to pairs of packets sent and received within a small enough time interval τ so that the error caused by clock drifts on the estimation of RTD is no larger than a tolerance value δ. This ensures that whenever P and Q are such that tA
Q− tAP ≤ τ , we have:
| dRT D(P, Q) − RT D(P, Q)| ≤ δ.
Note that when NTP is active, it will periodically correct the clocks which could cause sudden drifting that can affect the accuracy of the method. However, as NTP is limited to one resynchronization every 8 seconds, the error is insignif-icant.
To evaluate this passive RTD measurement method, we conduct the same experiments as earlier, where we passively measure the delays of generated packets and compare the results to what is reported by ping. Figure 4 shows how the RTDs measured by our method, in the absence of time syn-chronization by NTP, compare to the RTT reported by ping. Since time synchronization –or rather time asynchronization– does not impact this RTD measurement method, we can safely give explanations as to the difference between the two measured quantities:
• Firstly and most importantly, the two methods (active measurement with ping vs our passive RTD measure-ment method) do not exactly measure the same thing. As mentioned earlier, the former measures the delay between emission of echo request packets and reception of their corresponding echo response packets, which includes the processing time at the destination. The latter only attempts to measure the network delay with-out accounting for system-added delays when possible, which makes it more accurate in our context of passive measurement of network delay; and
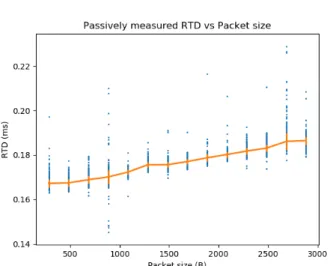
• Secondly, as our measurement solution runs in kernel space instead of user space, it does not suffer from any delay variation caused by random process scheduling and user space-to-kernel space communications. Furthermore, our method is precise enough that the trans-mission term (which corresponds to 100 ns per Byte in our high-bandwidth setup) can be easily extracted from the measured delay, and then be used to infer information about the bandwidth of the underlying transmission media. To show this, we generate with 1 ms interval (to avoid any queuing of packets) using trafgen, 10000 TCP probe packets of random sizes and measure the RTDs of each request-response pair
d
RT D(P, Q), that we plot in Figure 5 against the sum of their sizes S = |P | + |Q| (blue data points). We also plot the average RTD and a confidence interval for each summed size (orange curve). The figure shows how, as one would expect, the passively measured RTD is linear in the packet size due to the transmission term (τ =BS), with a high coefficient of determination (R2= 99.3%).
Fig. 4. ping RTT and Passively measured RTD.
Fig. 5. Transmission speed estimation from passive measurement of RTD.
VI. OTHERMEASUREMENTTOOLS
In the previous sections we have used our methodology with an eBPF-based timestamping tool. Its main strength compared to standard packet sniffing tools (such as the Linux libpcap library used by tcpdump and wireshark) is in its flexibility. In effect, as eBPF allows users to run code in kernel space, through kernel routines, and in parallel with kernel operations, much more can be achieved beyond simple timestamping of packets. For instance, and unlike with libpcap, it is possible to get information about the context surrounding the passage of each packet (e.g., NIC, system, or socket queues lengths) and correlate it with its delay for better analysis.
A second advantage of using eBPF for timestamping is that it is perfectly compatible with Linux Traffic Control (tc). In fact, we have chosen in our testbed to timestamp packets as they pass through the tc subsystem: our timestamping program is executed each time tc runs its qdisc_enqueue routine, unlike libpcap that captures and timestamps packets when they pass through the network device (see Figure 6).
This choice is not arbitrary as in the context of network emulation, emulators use tc to configure link parameters such as network delay, which cannot be captured by a measurement program if the packets are not timestamped before any emulated delay is added. To see this, consider Figure 7 that plots the passively measured RTD using both our eBPF program and libpcap as timestamping tools, in the same testbed as before but with an added 1 ms of delay in both ways. We can clearly see how libpcap only measures the propagation delay of the physical medium (around 170µs) and not the emulated delay (2 ms), unlike what ping and our eBPF-based method report.
Fig. 6. Measurement system with eBPF and libpcap.
Fig. 7. ping RTT and passively measured RTD with emulated delay.
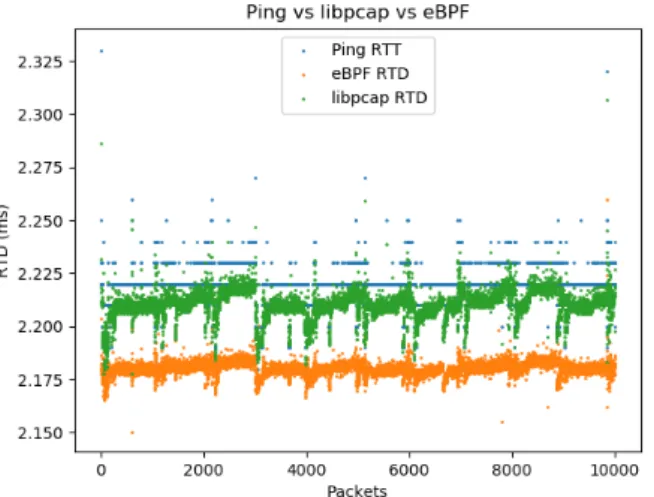
Having said that, one can mitigate this issue with libpcap by creating a virtual network device to intercept all packets before they go through tc (see Figure 8). The downside is that this solution will add system delay and jitter to the packets that will be counted in their delay measurements. Figure 9 shows this: while the measured RTD using libpcap is close to what our eBPF program measures (sum of the physical and the emulated delays), the complexity of the setup adds
delay (up to 50µs), and jitter (12µs) to the packets.
Fig. 8. Measurement system with eBPF and libpcap: modified setup.
Fig. 9. ping RTT and passively measured RTD: modified setup.
VII. CONCLUSION
Fine-grained fidelity monitoring is essential for reinforcing realism in network emulation. It relies on the accurate measurement of the emulated packet delay, which in dis-tributed scenarios is limited by clock offsets of the machines within the cluster. We have presented in this paper a new methodology for passively measuring delay of packets ex-changed between physical machines and/or virtual machines hosted by separate physical hosts. We have implemented this methodology within a delay monitoring system that relies on the extended Berkeley Packet Filter’s (eBPF) network and packet processing capabilities to extract information and timestamps from packets in an accurate, precise, and low-overhead manner, and which naturally integrates alongside existing network emulation tools. This system allows the passive measurement of packets’ one-way delays when as-sumptions about time synchronization can be made, and their two-way delays otherwise. In both cases, it can reach
microsecond-levels of accuracy and precision, which are necessary in our goal of monitoring data packets for fidelity purposes in distributed emulation scenarios.
Our current and future work is centered around the design of a lightweight fidelity monitoring system that uses the presented delay measurement methodology in large-scale emulated networks in distributed testbeds, to ensure that emulated experiments are carried out accurately. We will also import tools from statistics and signal processing to eliminate noise from passive delay measurements, in order to drop further assumptions about time synchronization.
REFERENCES
[1] Lantz, B., et al. (2010, October). A network in a Laptop: Rapid Prototyping for Software-defined Networks. In Proceedings of the 9th ACM SIGCOMM Workshop on Hot Topics in Networks, 1-6. [2] Ortiz, J., et al. (2016, October). Evaluation of Performance and
Scalability of Mininet in Scenarios with Large Data Centers. In 2016 IEEE Ecuador Technical Chapters Meeting (ETCM) (pp. 1-6). IEEE. [3] Muelas, D., et al. (2018). Assessing the Limits of Mininet-Based Environments for Network Experimentation. IEEE Network, 32(6), 168-176.
[4] Heller, B. (2013). Reproducible Network Research with High-fidelity Emulation (Doctoral dissertation, Stanford University).
[5] Di Lena, G., et al. (2021). Distrinet: a Mininet Implementation for the Cloud. ACM Computer Communication Review.
[6] Almes, G., et al. (1999, September). A One-way Delay Metric for IPPM. RFC 2679.
[7] Almes, G., et al. (1999, September). A Round-trip Delay Metric for IPPM. RFC 2681.
[8] De Vito, L., et al. (2008). One-way Delay Measurement: State of the Art. IEEE TIM, 57(12), 2742-2750.
[9] Postel, J. (1981). Internet Control Message Protocol DARPA Internet Program Protocol Specification. RFC 792.
[10] Muss, M. The Story of the PING Program. https://ftp.arl. army.mil/~mike/ping.html
[11] Spirent Communications. Remote Distributed Testing. http:// www.spirentcom.com/documents/185.pdf
[12] Schmid, T., et al. (2009). Temperature Compensated Time Synchro-nization. IEEE Embedded Systems Letters, 1(2), 37-41.
[13] Mills, D., et al. (2010). Network Time Protocol Version 4: Protocol and Algorithms Specification.
[14] Eidson, J. C., et al. (2002, December). IEEE-1588 Standard for a Pre-cision Clock Synchronization Protocol for Networked Measurement and Control Systems. In Proc. of the 34th PTTI meeting, 243-254. [15] Libri, A., et al. (2016, July). Evaluation of Synchronization Protocols
for Fine-grain HPC Sensor Data Time-stamping and Collection. In Proc. of HPCS, 818-825.
[16] Vieira, M. A., et al. (2020). Fast Packet Processing With eBPF and XDP: Concepts, Code, Challenges, and Applications. ACM Comput-ing Surveys (CSUR), 53(1), 1-36.
[17] Almesberger, W. (1999). Linux Network traffic con-trol—Implementation Overview.