Complementary Use of Computer Simulations and
Molecular-Thermodynamic Theory to Model
Surfactant and Solubilizate Self-Assembly
byBrian C. Stephenson
B.S., Brigham Young University (2000)
M.S.CEP, Massachusetts Institute of Technology (2004) Submitted to the Department of Chemical Engineering in partial ful…llment of the requirements for the degree of
Doctor of Philosophy at the
MASSACHUSETTS INSTITUTE OF TECHNOLOGY November 2006
c Massachusetts Institute of Technology 2006. All rights reserved.
The author hereby grants to Massachusetts Institute of Technology permission to reproduce and
to distribute copies of this thesis document in whole or in part.
Signature of Author . . . . Department of Chemical Engineering
27 November 2006 Certi…ed by . . . .
Kenneth Beers Visiting Assistant Professor Thesis Supervisor Certi…ed by . . . . Daniel Blankschtein Professor Thesis Supervisor Accepted by . . . . William Deen Chairperson, Committee for Graduate Students
Complementary Use of Computer Simulations and
Molecular-Thermodynamic Theory to Model
Surfactant and Solubilizate Self-Assembly
byBrian C. Stephenson
Submitted to the Department of Chemical Engineering on 27 November 2006, in partial ful…llment of the
requirements for the degree of Doctor of Philosophy
Abstract
Surfactants, or surface active agents, are used in many pharmaceutical, industrial, and environmental applications. Selection of the appropriate surfactant or mixture of surfac-tants for any given application is driven by the need to control bulk solution micellization and solubilization characteristics. The goal of this thesis has been to develop computer simulations and molecular-thermodynamic modeling approaches to predict these solution characteristics based on knowledge of surfactant and solubilizate chemical structure. The ability to make such predictions would give formulators in industry the ability to design and optimize surfactant formulations with a minimum of e¤ort and expense.
This thesis has explored the application of three theoretical approaches to model surfac-tant micellization and micellar solubilization. The …rst theoretical approach involves the use of computer simulations (CS) to obtain input parameters for molecular-thermodynamic (MT) modeling of surfactant micellization and micellar solubilization. This approach was motivated by the limitations inherent in computer simulations (the high computational expense of modeling self-assembly) and in MT modeling approaches (their restriction to structurally and chemically simple surfactants and solubilizates). A key input required for traditional MT modeling is the identi…cation of the hydrated and the unhydrated portions (head and tail) of surfactants and solubilizates in a self-assembled micellar aggregate. By conducting simulations of surfactants and solubilizates at an oil/water interface (modeling the micelle core/water interface) or in a micellar environment, I have determined head and tail input parameters for simple and complex surfactants and solubilizates. This informa-tion has been successfully used as an input to MT modeling, and has been shown to extend the applicability of the traditional MT modeling approach to more complex surfactant and solubilizate systems than had been possible to date. A wide range of surfactant and sol-ubilizate systems have been modeled with this approach, including ionic, zwitterionic, and nonionic surfactant/solubilizate systems. For each of the systems modeled, theoretical predictions were in reasonable agreement with the experimental data. A novel, alternative approach has also been developed to more accurately quantify the hydrophobic driving force for micelle formation by using atomistic molecular dynamics (MD) simulations to quantify the hydration changes that take place during micelle self-assembly. This new approach is referred to as the computer simulation/molecular-thermodynamic (CS-MT) model. In the
CS-MT model, hydration information determined through computer simulation is used in a new MT model to quantify the hydrophobic e¤ect, which is decomposed into two com-ponents: gdehydr, the free-energy change associated with the dehydration of hydrophobic
groups that accompanies aggregate self-assembly, and ghydr, the change in hydration free
energy experienced during aggregate self-assembly. The CS-MT model is formulated to allow the prediction of the free-energy change associated with the formation of aggregates of any shape and size after performing only two computer simulations — one of the surfac-tant/solubilizate in bulk water and the second of the surfacsurfac-tant/solubilizate in an aggregate of arbitrary shape and size. The CS-MT modeling approach has been validated by using it to model the formation of oil aggregates, the micellization behavior of nonionic surfactants in aqueous solution, and the micellization behavior of ionic and zwitterionic surfactants in aqueous solution. For each of the systems modeled, the CS-MT model predictions were in reasonable agreement with the experimental data, and in almost all cases were in better agreement with the experimental data than the predictions of the traditional MT model.
The second theoretical approach explored in this thesis is the application of computer simulation free-energy (FE) methods to quantify the thermodynamics of mixed micelle for-mation. In this theoretical approach, referred to as the CS-FE/MT modeling approach, the traditional MT modeling approach, or experimental data, is …rst used to determine the free energy of formation of a pure (single) surfactant micelle. Subsequently, computer sim-ulations are used to determine the free-energy change associated with alchemically changing the identity of individual surfactants present in the micelle to that of a second surfactant or solubilizate. This free-energy change, when added to the free energy of single surfac-tant micellization, yields the free energy associated with mixed micelle formation. The free energy of mixed micelle formation can then be used in the context of a thermodynamic description of the micellar solution to predict bulk solution properties such as the CMC and the equilibrium composition of the mixed micelle. The CS-FE/MT model has been used to model both binary surfactant micellization and micellar solubilization. The CS-FE/MT model was shown to be most accurate when the chemical structures of the mixed micelle components were similar and when small alchemical transformations were performed.
The third theoretical approach explored in this thesis is the use of all-atomistic computer simulations to make direct predictions of surfactant solution properties. Although the computational expense associated with atomistic-level MD simulations restricts their use to the evaluation of a limited subset of surfactant solution properties, these simulations can provide signi…cant insight into the structural characteristics of preformed surfactant aggregates and the self-assembly behavior of surfactant molecules over limited timescales. Simulation of monolayers of a homologous series of structurally complex ‡uorosurfactants has been conducted in order to explore their behavior at a water/air interface and the origin of their ability to reduce surface tension. In addition, atomistic-level MD simulations have been conducted to study the self-assembly behavior of the triterpenoids asiatic acid (AA) and madecassic acid (MA) in aqueous solution. The computer simulation results were used to obtain information about: i) the kinetics of micelle formation, ii) the structural characteristics of the self-assembled micelles, and iii) micellization thermodynamics.
This thesis presents a detailed, atomistic-level computer simulation and molecular-thermodynamic investigation of the micellar solution behavior of nonionic, zwitterionic, and ionic surfactants in aqueous solutions, as well as of the aqueous micellar solubilization of solubilizates by surfactants. It is hoped that the approaches developed in this thesis to
use computer simulations and molecular-thermodynamic theory in a complementary way will not only extend our ability to make accurate predictions of surfactant solution behavior, but will also contribute to our fundamental knowledge of the solution behavior of surfac-tants and solubilizates. It is further hoped that this thesis will provide a solid foundation for future research in the area of surfactant science, and, more generally, that it will assist future researchers working to connect atomistic-level computer simulation methods with continuum thermodynamic models.
Thesis Supervisor: Kenneth Beers Title: Visiting Assistant Professor Thesis Supervisor: Daniel Blankschtein Title: Professor
Acknowledgements
Many individuals have contributed to the research presented in this thesis. I would like to thank both of my research advisors, Professor Kenneth Beers and Pro-fessor Daniel Blankschtein. Kenneth Beers introduced me to the world of computer simulations and was always willing to provide insightful comments on my research and encouragement throughout the research process. Daniel Blankschtein introduced me to the world of colloids and surfactants, and gave me the freedom to pursue the research ideas I found most interesting. He also motivated me to pay careful atten-tion to every detail of my research, and worked very hard to provide feedback on each of the articles, grant proposals, reports, and talks I have prepared over the past four years.
I would also like to extend my sincere thanks to each of the collaborators I have worked with, each of whom have contributed greatly to this thesis. My sincere thanks to Kate Sta¤ord, who was very helpful in implementing the computer simulation/free-energy methods developed as part of this thesis. Her positive attitude and dedication to her work was a great help, and allowed me to manage the many research projects I juggled towards the end of my stay at MIT. I would also like to thank Professor Carlota Rangel-Yagui, who collaborated with me to experimentally and theoretically characterize ibuprofen solubilization behavior in surfactant solutions. I am also grateful to Dr. Arthur Goldsipe for his help with many aspects of my thesis research, including his assistance during the development of the CS-MT modeling approach. My sincere thanks go to Jonathan Mendenhall for providing invaluable assistance in implementing hybrid computer simulation/molecular-thermodynamic modeling ap-proaches to describe complex surfactant micellization and micellar solubilization be-havior. Without his help, it would not have been possible to realistically model many of the most complex surfactant/solubilizate systems considered in this thesis. I also greatly appreciate the feedback of Dr. Isaac Reif, who critically reviewed several of the papers which came out of my thesis research.
for providing a pleasant, collaborative place to work. In particular, I appreciate the helpful feedback I received from the Blankschtein group during my practice talks. I wish the present group members — Srinivas, Saswata, Jonathan, Amanda, Jennifer, Baris, and Shangchao — success in their future research. Jonathan Mendenhall is exploring a coupled-term mean-…eld modeling approach to enable more accurate estimation of the free-energy contributions associated with micelle self-assembly, and I wish him success with this novel area of research. Shangchao Lin is exploring several interesting applications of the CS-MT model, and I also wish him success in all his research endeavors.
Most of all I would like to thank my family, from grandparents to siblings, who have helped me through graduate school with their love and support. My parents in particular have contributed in many ways to the completion of this thesis, from always being supportive of my education to providing encouragement through the ups and downs of thesis research. This thesis is dedicated to them both.
Finally, I am grateful for the award of a Presidential Fellowship at MIT, and to MIT’s chemical engineering department for providing …nancial support for this research.
Contents
PART I: APPLICATION OF COMPUTER SIMULATIONS
TO OBTAIN MOLECULAR-THERMODYNAMIC INPUTS
1 Introduction 42
1.1 Motivation . . . 42 1.2 Introduction to Surfactant Micellization and Micellar Solubilization . 47 1.2.1 Surfactant Micellization . . . 48 1.2.2 Micellar Solubilization . . . 48 1.3 Theoretical Models of Micellization and Micellar Solubilization . . . 54 1.3.1 Molecular-Thermodynamic Models of Micellization . . . 54 1.3.2 Molecular-Thermodynamic Models of Solubilization . . . 55 1.3.3 Limitations of Previous Molecular-Thermodynamic Modeling
Approaches . . . 58 1.4 Introduction to Computer Simulation Methods . . . 60 1.5 Computer Simulation Studies of Micellization and Micellar Solubilization 77
1.5.1 Computer Simulation of Preformed Surfactant/Solubilizate Sys-tems . . . 64 1.5.2 Computer Simulation of Micelle Self-Assembly . . . 65 1.5.3 Determination of the Free Energy of Micelle Formation . . . . 67 1.6 Combined Computer Simulation/Molecular Thermodynamic Models . 68 1.7 Thesis Objectives . . . 70
1.8 Thesis Overview . . . 71
2 Complementary Use of Simulations and Molecular-Thermodynamic Theory to Model Micellization 95 2.1 Introduction . . . 95
2.2 Molecular-Thermodynamic Approach . . . 99
2.2.1 Thermodynamic Framework . . . 99
2.2.2 Molecular Model of Micellization . . . 101
2.3 Molecular Dynamics Simulations . . . 104
2.3.1 Computational Approach . . . 104
2.3.2 Simulation Parameters . . . 105
2.3.3 System Preparation and Equilibration . . . 106
2.3.4 Data Analysis Method . . . 107
2.4 Simulation Results and Discussion . . . 110
2.4.1 Sodium Dodecyl Sulfate (SDS) . . . 110
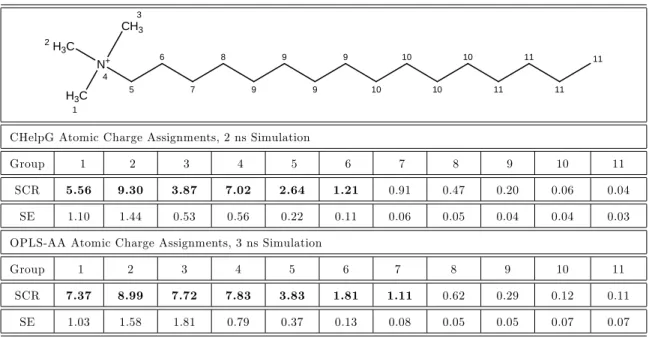
2.4.2 Cetyltrimetylammonium Bromide (CTAB) . . . 112
2.4.3 Dodecylphosphocholine (DPC) . . . 114
2.4.4 Dodecyl Poly(Ethylene Oxide) (C12E8) . . . 115
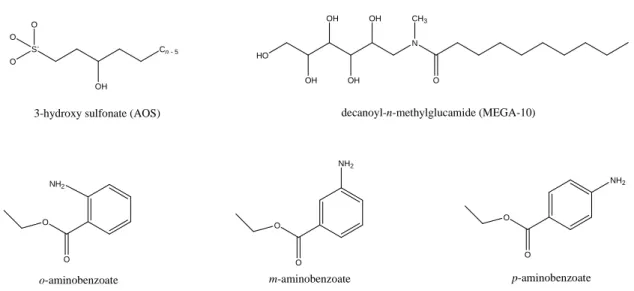
2.4.5 3-Hydroxy Sulfonate (AOS) . . . 117
2.4.6 Decanoyl-n-Methylglucamide (MEGA-10) . . . 120
2.5 Molecular-Thermodynamic Modeling Based on Computer Simulation Inputs . . . 121
2.5.1 Sodium Dodecyl Sulfate (SDS) . . . 122
2.5.2 Cetyltrimethylammonium Bromide (CTAB) . . . 124
2.5.3 Dodecylphosphocholine (DPC) . . . 126
2.5.4 Dodecyl Octa(Ethylene Oxide) (C12E8) . . . 127
2.5.5 3-Hydroxy Sulfonate (AOS) . . . 128
2.5.6 Decanoyl-n-Methylglucamide (MEGA-10) . . . 129
3 Experimental and Theoretical Investigation of the Micellar-Assisted
Solubilization of Ibuprofen in Aqueous Media 145
3.1 Introduction . . . 145
3.2 Materials, Experimental Methods, and Experimental Results . . . 149
3.2.1 Materials . . . 149
3.2.2 Experimental Methods . . . 149
3.2.3 Experimental Results . . . 151
3.3 Theoretical Modeling . . . 153
3.3.1 Molecular Dynamics Simulations . . . 158
3.3.2 Molecular-Thermodynamic Approach . . . 162
3.3.3 Molecular-Thermodynamic Modeling Based on Computer Sim-ulation Inputs . . . 165
3.4 Conclusions . . . 183
4 Complementary Use of Simulations and Molecular-Thermodynamic Theory to Model Solubilization. I. Theory 193 4.1 Introduction . . . 193
4.1.1 Introduction to Surfactant Micellization and Micellar Solubi-lization . . . 195
4.1.2 Theoretical Modeling Approaches . . . 197
4.1.3 Computer Simulation Approaches . . . 200
4.1.4 Combined Computer Simulation/Molecular-Thermodynamic Mod-eling Approach . . . 202
4.1.5 Motivation and Research Objectives . . . 204
4.2 Computer Simulations . . . 207
4.2.1 Methodology . . . 207
4.2.2 Simulation Methods and Parameters . . . 209
4.2.3 System Preparation and Equilibration . . . 212
4.3 Simulation Results and Discussion . . . 227
4.4 Molecular-Thermodynamic Theory of Solubilization . . . 233
4.4.1 Introduction . . . 233
4.4.2 Thermodynamic Framework to Model the Free Energy of the Micellar Solution . . . 234
4.4.3 Molecular Model of Micellar Solubilization . . . 237
4.5 Conclusions . . . 260
4.6 Appendix 4-A: Equilibration Results for the Cylindrical and Spherical Micelles . . . 263
4.7 Appendix 4-B: Contact Analysis Results . . . 280
5 Complementary Use of Simulations and Molecular-Thermodynamic Theory to Model Solubilization. II. Application 303 5.1 Introduction . . . 303
5.2 Overview of Computer Simulation Results . . . 305
5.3 Overview of Molecular-Thermodynamic Model for Micellar Solubilization306 5.4 Molecular-Thermodynamic Modeling Based on Computer Simulation Inputs . . . 309
5.4.1 Selection of Heads and Tails for Molecular-Thermodynamic Mod-eling . . . 309
5.4.2 Molecular Parameters Used in Molecular-Thermodynamic Mod-eling . . . 314
5.4.3 Implementation of Molecular Model . . . 316
5.5 Molecular-Thermodynamic Modeling Results . . . 324
5.5.1 Free-Energy Predictions . . . 326
5.5.2 Predictions of Micellar Solubilization Characteristics . . . 336
5.5.3 Sensitivity of the Predictions to Salt Concentration . . . 345
5.6 Conclusions . . . 348 6 Quantifying the Hydrophobic E¤ect: I. A Computer Simulation/
Molecular-Thermodynamic Model for the Self-Assembly of
Hydropho-bic and Amphiphilic Solutes in Aqueous Solution 357
6.1 Introduction . . . 357
6.2 Molecular-Thermodynamic Modeling Approach . . . 364
6.2.1 Introduction . . . 364
6.2.2 Thermodynamic Framework . . . 365
6.2.3 Traditional Molecular-Thermodynamic Model of Surfactant Mi-cellization and Micellar Solubilization . . . 367
6.3 The Computer Simulation/Molecular Thermodynamic (CS-MT) Mod-eling Approach . . . 373
6.3.1 Introduction . . . 373
6.3.2 Theoretical Framework . . . 373
6.3.3 The Free Energy of Dehydration, gdehydr . . . 375
6.3.4 The Free Energy of Hydration, ghydr . . . 377
6.3.5 Extension of the CS-MT Model to Predict Aggregate Shape and Size . . . 380
6.3.6 Evaluating the Validity and Accuracy of the CS-MT Model . . 381
6.4 Molecular Dynamics Simulations . . . 384
6.4.1 Introduction . . . 382
6.4.2 Modeling Approach . . . 383
6.4.3 Simulation Methods and Parameters . . . 383
6.4.4 System Preparation and Equilibration . . . 385
6.4.5 Data Analysis Method . . . 390
6.5 Simulation Results and Discussion . . . 396
6.5.1 Fractional Hydration Results . . . 396
6.5.2 Solvent Accessible Surface Area (SASA) Results . . . 401
6.6 Molecular-Thermodynamic Modeling Based on Computer Simulation Inputs . . . 404
6.8 Appendix 6-A: Extension of the CS-MT Model to Predict Aggregate
Shape and Size . . . 412
6.9 Appendix 6-B: Mathematical Demonstration of the Equivalence of the CS-MT Model and the Traditional MT Model for Completely Hy-drophobic Solutes . . . 417
7 Quantifying the Hydrophobic E¤ect: II. A Computer Simulation/ Molecular-Thermodynamic Model for the Micellization of Nonionic Surfactants in Aqueous Solution 430 7.1 Introduction . . . 430
7.1.1 Review of the CS-MT Model . . . 431
7.1.2 Modeling Nonionic Surfactant Micellization . . . 435
7.2 Molecular Dynamics Simulations . . . 437
7.2.1 Modeling Approach . . . 437
7.2.2 Simulation Methods and Parameters . . . 437
7.2.3 System Preparation and Equilibration . . . 439
7.2.4 Data Analysis Method . . . 443
7.3 Simulation Results and Discussion . . . 446
7.3.1 Octyl Glucoside (OG) . . . 447
7.3.2 Dodecyl Maltoside (DM) . . . 449
7.3.3 Octyl Sul…nyl Ethanol (OSE) . . . 451
7.3.4 Decyl Dimethyl Phosphine Oxide (C10PO) . . . 453
7.3.5 Decyl Methyl Sulfoxide (C10SO) . . . 453
7.3.6 Dodecyl Octa(Ethylene Oxide) (C12E8) . . . 455
7.3.7 Decanoyl-n-Methylglucamide (MEGA-10) . . . 458
7.3.8 Evaluation of Approximations Made in Traditional Molecular-Thermodynamic Modeling . . . 458
7.4 Molecular-Thermodynamic Modeling Based on Computer Simulation Inputs . . . 466
7.4.1 Using the CS-MT Modeling Approach to Predict Surfactant
Micellization Behavior . . . 466
7.4.2 Modeling Results for Octyl Glucoside (OG) . . . 471
7.4.3 Modeling Results for Dodecyl Maltoside (DM) . . . 475
7.4.4 Modeling Results for Octyl Sul…nyl Ethanol (OSE) . . . 476
7.4.5 Modeling Results for Decyl Dimethyl Phosphine Oxide (C10PO) 477 7.4.6 Modeling Results for Decyl Methyl Sulfoxide (C10SO) . . . 478
7.4.7 Modeling Results for Binary Mixtures of C10PO and C10SO . 479 7.4.8 Modeling Results for Dodecyl Octa(Ethylene Oxide) (C12E8) . 481 7.4.9 Modeling Results for Decanoyl-n-Methylglucamide (MEGA-10) 484 7.4.10 E¤ect of the De…nition of Hydrating Contacts on the Modeling Results . . . 485
7.5 Conclusions . . . 487
7.6 Appendix 7-A: Normalized SASA Pro…les . . . 490
8 Quantifying the Hydrophobic E¤ect: III. A Computer Simulation/ Molecular-Thermodynamic Model for the Micellization of Ionic and Zwitterionic Surfactants in Aqueous Solution 498 8.1 Introduction . . . 498
8.1.1 Overview of the CS-MT Model . . . 499
8.1.2 Modeling Ionic and Zwitterionic Surfactant Micellization . . . 503
8.2 Molecular Dynamics Simulations . . . 505
8.2.1 Modeling Approach . . . 505
8.2.2 Simulation Methods and Parameters . . . 505
8.2.3 System Preparation and Equilibration . . . 506
8.2.4 Data Analysis Method . . . 508
8.3 Simulation Results and Discussion . . . 511
8.3.1 Sodium Dodecyl Sulfate (SDS) . . . 511
8.3.3 Cetyltrimethylammonium Bromide (CTAB) . . . 515
8.3.4 Sodium 3-Hydroxy Sulfonates (AOS-12 and AOS-16) . . . 515
8.3.5 C12H25CNH2N +1N(CH3)2Br Surfactants (DC1AB-DC6AB) . . 517
8.4 Molecular-Thermodynamic Modeling Based on Computer Simulation Inputs . . . 521
8.4.1 Using the CS-MT Modeling Approach to Predict the Micelliza-tion Behavior of Ionic and Zwitterionic Surfactants . . . 521
8.4.2 Modeling Results for Simple Surfactants . . . 522
8.4.3 Modeling Results for Complex Surfactants . . . 529
8.5 Conclusions . . . 537
8.6 Appendix 8-A: Normalized SASA Pro…les . . . 540
PART II: FREE-ENERGY CALCULATIONS USING
COM-PUTER SIMULATION
9 Free-Energy Calculations Using Computer Simulations: Theory 548 9.1 Background . . . 5499.2 Overview of CS-FE/MT Modeling Approach . . . 552
9.3 Formulation of the Thermodynamic Framework Used in the CS-FE/MT Model . . . 553
9.4 Introduction to Computer Simulation Free-Energy Methods . . . 559
9.4.1 Methods for the Evaluation of Free-Energy Di¤erences . . . . 560
9.4.2 Thermodynamic Integration . . . 561
9.5 Free-Energy Calculations Made in the CS-FE/MT Model . . . 564
9.6 Conclusions . . . 568
10 Free-Energy Calculations Using Computer Simulations: Implemen-tation and Results 574 10.1 Implementation of Alchemical Free-Energy Calculations . . . 576
10.1.2 Single vs. Dual-Topology Approaches . . . 579
10.1.3 Description of Alchemical Topologies . . . 579
10.2 Simulation Methods and Parameters . . . 586
10.3 Simulation Preparation and Equilibration . . . 587
10.3.1 Aqueous Simulations . . . 587
10.3.2 Micellar Simulations . . . 588
10.4 Alchemical Simulations and Results . . . 594
10.4.1 Evaluation of Gfrom G1 and G2 . . . 592
10.4.2 G Results Based on Simulation at Additional Values . . 619
10.5 Conclusions . . . 539
10.6 Appendix 10-A: Validation of Alchemical Free-Energy Methods Used to Implement the CS-FE/MT Model . . . 627
PART III: DIRECT PREDICTION OF SURFACTANT
SOLUTION PROPERTIES USING COMPUTER
SIMU-LATIONS
11 Determination of the Interfacial Characteristics of a Series of Bo-laamphiphilic Poly(‡uorooxetane) Surfactants through Molecular Dy-namics Simulation 641 11.1 Introduction . . . 64111.2 Simulation Methodology . . . 646
11.2.1 Simulation Parameters . . . 646
11.2.2 System Preparation and Equilibration . . . 647
11.3 Results and Discussion . . . 654
11.3.1 Saturated Interfacial Areas per Surfactant Molecule . . . 654
11.3.2 Interfacial Areas per Surfactant Molecule as a Function of Ap-plied Surface Tension . . . 656
11.3.4 Interfacial Density Pro…les . . . 661
11.3.5 Degree of Hydration and Counterion Binding . . . 672
11.3.6 Order Parameters . . . 674
11.4 Conclusions . . . 676
12 Molecular Dynamics Investigation of the Self-Assembly of the Triter-penoids Asiatic Acid and Madecassic Acid in Aqueous Solution 686 12.1 Introduction . . . 686
12.2 Methods . . . 691
12.2.1 Simulation Methodology and Parameters . . . 691
12.2.2 System Preparation and Equilibration . . . 692
12.3 Computer Simulation Results and Analysis . . . 693
12.3.1 Self-Assembly Behavior . . . 693
12.3.2 Number of Micelles and Micelle Aggregation Number . . . 693
12.3.3 Monomer Concentration . . . 699
12.3.4 Micelle Principal Moments of Gyration . . . 701
12.3.5 Orientational Order Parameters . . . 703
12.3.6 Radial Distribution Functions . . . 705
12.3.7 Extent of Hydration . . . 707
12.3.8 Solvent Accessible Surface Area . . . 709
12.4 Computer Simulation/Molecular-Thermodynamic Model to Investigate Micellization Thermodynamics . . . 710
12.4.1 Thermodynamic Framework . . . 713
12.4.2 Molecular Model of Single-Surfactant Micellization . . . 715
12.4.3 Implementation of the CS-MT Model . . . 720
12.5 Conclusions . . . 724
13 Conclusions and Future Research Directions 736 13.1 Thesis Summary . . . 737
13.2 Future Research Directions: Application of Computer Simulation to Obtain Inputs for MT Theory . . . 745 13.2.1 Head and Tail Identi…cation through Water/Oil Interface
Sim-ulation . . . 746 13.2.2 Head and Tail Identi…cation through Micellar Simulation . . . 748 13.2.3 CS-MT Modeling of Surfactants and Solubilizates . . . 749 13.3 Future Research Directions: Application of Computer Simulation to
Determine Free-Energy Changes . . . 757 13.3.1 Selection of the Optimal Transition Path . . . 757 13.3.2 Alternative Free-Energy Methods . . . 759 13.4 Future Research Directions: Application of Computer Simulation to
Make Direct Predictions of Surfactant Solution Properties . . . 760 13.5 Concluding Remarks . . . 762
List of Figures
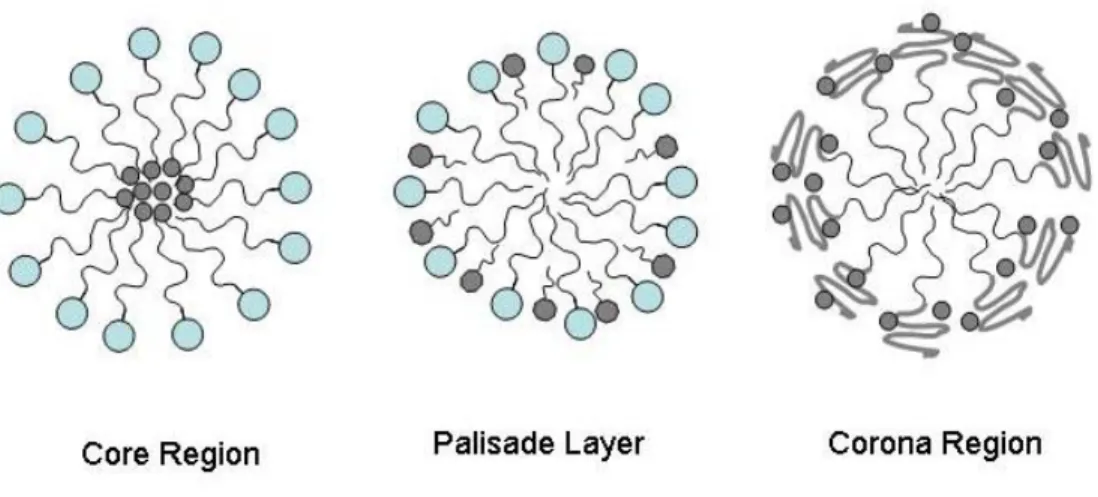
1-1 Regions of solubilization in a surfactant micelle. . . 52 1-2 Examples of challenging surfactants to model using
molecular-thermo-dynamic theory. . . 59 1-3 Sequence of steps involved in molecular dynamics (MD) simulation. . 62 2-1 Scaled contact ratios predicted using simulations for each SDS
surfac-tant group, where the scaled contact ratio is de…ned as the number of contacts of each surfactant group with water divided by the number of contacts of the same group with octane. . . 111 3-1 Chemical structure of the drug ibuprofen. . . 147 3-2 Experimentally-determined solubility curve of ibuprofen as a function
of SDS concentration in 5 mM phosphate bu¤er at pH 7.4 and 25oC. 152 3-3 Experimentally-determined solubility curve of ibuprofen as a function
of DTAB concentration in 5 mM phosphate bu¤er at pH 7.4 and 25oC. 154 3-4 Experimentally-determined solubility curve of ibuprofen as a function
of C12E8 concentration in 5 mM phosphate bu¤er at pH 7.4 and 25oC. 155
3-5 Predicted and experimental values of the micellar composition of ibupro-fen (Xibu), de…ned as the mole fraction of ibuprofen in the micellar
aggregate, as a function of SDS concentration in phosphate bu¤er at pH 7.4 and 25oC. . . 169 3-6 Predicted and experimental values of ibuprofen solubility as a function
3-7 Predicted and experimental values of micellar composition of ibupro-fen (Xibu), de…ned as the mole fraction of ibuprofen in the micellar
aggregate, as a function of DTAB concentration in phosphate bu¤er at pH 7.4 and 25oC. . . 176 3-8 Predicted and experimental values of ibuprofen solubility as a function
of DTAB concentration in phosphate bu¤er at 25oC. . . 178 3-9 Predicted and experimental values of micellar composition of
ibupro-fen (Xibu), de…ned as the mole fraction of ibuprofen in the micellar
aggregate, as a function of C12E8 concentration in phosphate bu¤er at
pH 7.4 and 25oC. . . . . 181
3-10 Predicted and experimental values of ibuprofen solubility as a function of C12E8 concentration in phosphate bu¤er at pH 7.4 and 25oC. . . 182
4-1 Chemical structures of the solubilizates modeled in this chapter. . . 182 4-2 Representative snapshot of a water/oil interface (A), a cylindrical
mi-celle (B), and a spherical mimi-celle (C) after equilibration. . . 213 4-3 Solvent accessible surface area (SASA) pro…les for the cylindrical (A)
and spherical (B) SDS/ibuprofen micelles and SDS/acetophenone mi-celles as a function of simulation time. . . 219 4-4 Distance between several surfactant groups de…ned in the text and
the micelle center of mass (dSO4 MICC O M, dCH2 MICC O M, dCH3 MICC O M)
and ibuprofen and the micelle center of mass ( dSOLC O M MICC O M) in the
cylindrical (A) and spherical (B) SDS/ibuprofen micelles. . . 221 4-5 Distance between several surfactant groups de…ned in the text and the
micelle center of mass (dSO4 MICC O M, dCH2 MICC O M, dCH3 MICC O M) and
acetophenone and the micelle center of mass (dSOLC O M MICC O M) in the
cylindrical (A) and spherical (B) SDS/ibuprofen micelles. . . 222 4-6 Head and tail identi…cations made from water/oil interface simulation. 228 4-7 Head and tail identi…cations made from cylindrical micelle simulation. 229 4-8 Head and tail identi…cations made from spherical micelle simulation. . 229
4-9 Two-dimensional representation of a spherical or cylindrical micelle core, depicting the L layers concentric to the micelle core and the three Euler angles describing the overall orientation of the surfactant tail with respect to the micelle core/water interface, , , and . . . . 249 4-A1 Solvent accessible surface area (SASA) for the cylindrical and spherical
SDS/ibuprofen micelles as a function of simulation time. . . 266 4-A2 Solvent accessible surface area (SASA) for the cylindrical and spherical
SDS/benzamide micelles as a function of simulation time. . . 267 4-A3 Solvent accessible surface area (SASA) for the cylindrical and spherical
SDS/acetophenone micelles as a function of simulation time. . . 268 4-A4 Solvent accessible surface area (SASA) for the cylindrical and spherical
SDS/benzonitrile micelles as a function of simulation time. . . 269 4-A5 Solvent accessible surface area (SASA) for the cylindrical and spherical
SDS/o-aminobenzoate micelles as a function of simulation time. . . . 270 4-A6 Solvent accessible surface area (SASA) for the cylindrical and spherical
SDS/m-aminobenzoate micelles as a function of simulation time. . . . 271 4-A7 Solvent accessible surface area (SASA) for the cylindrical and spherical
SDS/p-aminobenozate micelles as a function of simulation time. . . . 272 4-A8 Distance between several surfactant groups de…ned in the text and the
micelle center of mass (dSO4 MICC O M, dCH2 MICC O M, dCH3 MICC O M) and
the ibuprofen and the micelle center of mass (dSOLC O M MICC O M) in the
cylindrical (A) and spherical (B) SDS/ibuprofen micelles. The average value of each distance over 25 ns of simulation is reported in a table below the …gure. . . 273
4-A9 Distance between several surfactant groups de…ned in the text and the micelle center of mass (dSO4 MICC O M, dCH2 MICC O M, dCH3 MICC O M) and
the benzamide and the micelle center of mass (dSOLC O M MICC O M) in
the cylindrical (A) and spherical (B) SDS/benzamide micelles. The average value of each distance over 25 ns of simulation is reported in a table below the …gure. . . 274 4-A10 Distance between several surfactant groups de…ned in the text and the
micelle center of mass (dSO4 MICC O M, dCH2 MICC O M, dCH3 MICC O M) and
the acetophenone and the micelle center of mass (dSOLC O M MICC O M) in
the cylindrical (A) and spherical (B) SDS/acetophenone micelles. The average value of each distance over 25 ns of simulation is reported in a table below the …gure. . . 275 4-A11 Distance between several surfactant groups de…ned in the text and the
micelle center of mass (dSO4 MICC O M, dCH2 MICC O M, dCH3 MICC O M) and
the benzonitrile and the micelle center of mass (dSOLC O M MICC O M) in
the cylindrical (A) and spherical (B) SDS/benzonitrile micelles. The average value of each distance over 25 ns of simulation is reported in a table below the …gure. . . 276 4-A12 Distance between several surfactant groups de…ned in the text and the
micelle center of mass (dSO4 MICC O M, dCH2 MICC O M, dCH3 MICC O M) and
the o-aminobenzoate and the micelle center of mass (dSOLC O M MICC O M)
in the cylindrical (A) and spherical (B) SDS/o-aminobenzoate micelles. The average value of each distance over 25 ns of simulation is reported in a table below the …gure. . . 277
4-A13 Distance between several surfactant groups de…ned in the text and the micelle center of mass (dSO4 MICC O M, dCH2 MICC O M, dCH3 MICC O M) and
the m-aminobenzoate and the micelle center of mass (dSOLC O M MICC O M)
in the cylindrical (A) and spherical (B) SDS/m-aminobenzoate mi-celles. The average value of each distance over 25 ns of simulation is reported in a table below the …gure. . . 278 4-A14 Distance between several surfactant groups de…ned in the text and the
micelle center of mass (dSO4 MICC O M, dCH2 MICC O M, dCH3 MICC O M) and
the p-aminobenzoate and the micelle center of mass (dSOLC O M MICC O M)
in the cylindrical (A) and spherical (B) SDS/p-aminobenzoate micelles. The average value of each distance over 25 ns of simulation is reported in a table below the …gure. . . 279 5-1 Chemical structures of the solubilizates modeled in this chapter. . . . 304 5-2 Summary of head and tail identi…cation results presented in Chapter 4. 307 5-3 Head and tail identi…cations made for molecular-thermodynamic
mod-eling of gtr and gint. . . 311
5-4 Head and tail identi…cations made for molecular-thermodynamic mod-eling of gpack: . . . 313
5-5 Predicted values of gpack (in units of kBT) as a function of lc and mic
for o-aminobenzoate solubilization in cylindrical SDS micelles (A), m-aminobenzoate solubilization in cylindrical SDS micelles (B), and p-aminobenzoate solubilization in cylindrical SDS micelles (C). . . 330 5-6 Predicted values of gpack (in units of kBT) as a function of lc and mic
for o-aminobenzoate solubilization in spherical CTAB micelles (A), m-aminobenzoate solubilization in cylindrical CTAB micelles (B), and p-aminobenzoate solubilization in spherical CTAB micelles (C). . . . 333
5-7 Predicted values of Vcore (in units of Å3) as a function of lc and mic
for o-aminobenzoate solubilization in cylindrical SDS micelles (A), m-aminobenzoate solubilization in cylindrical SDS micelles (B), and p-aminobenzoate solubilization in cylindrical SDS micelles (C). . . 335 5-8 The e¤ect of NaCl concentration on the micelle/water partition coe¢
-cient for the solubililization of actophenone (Ks), benzamide (Ks), and
o-aminobenzoate (ln(Kx)) in SDS micelles. . . 346
5-9 The e¤ect of NaCl concentration on the micelle/water partition coe¢ -cient for the solubililization of actophenone (Ks), benzamide (Ks), and
o-aminobenzoate (ln(Kx)) in CTAB micelles. . . 347
6-1 Examples of surfactants and solubilizates for which making head and tail assignments is not trivial and which therefore are di¢ cult to model using the traditional molecular-thermodynamic modeling approach. 361 6-2 Sequence of steps followed in the molecular-thermodynamic cycle used
in the CS-MT modeling approach presented in the context of the mi-cellization of a cationic surfactant and a nonionic hydrophobic solubi-lizate. . . 368 6-3 Solvent accessible surface area (SASA) as a function of simulation
time for three representative simulated oil aggregates: a small octane sphere, a large octane cylinder, and an octane slab. . . 391 6-4 Snapshots of the post-equilibration structures of: (i) two dodecane
spherical aggregates (of aggregation numbers 17 and 33), (ii) two do-decane cylindrical aggregates (of periodic lengths 2.85 nm and 3.85 nm), and (iii) a dodecane slab. . . 392 6-5 The average fractional degree of hydration (f ) corresponding to each of
the groups in octane for each of the …ve simulated aggregate geometries: (i) a small spherical aggregate, (ii) a large spherical aggregate, (iii) a small cylindrical aggregate, (iv) a large cylindrical aggregate, and (v) a planar slab. . . 398
6-6 The average fractional degree of hydration (f ) corresponding to each of the groups in dodecane for each of the …ve simulated aggregate geome-tries: (i) a small spherical aggregate, (ii) a large spherical aggregate, (iii) a small cylindrical aggregate, ( iv) a large cylindrical aggregate, and (v) a planar slab. . . 399 6-7 The average fractional degree of hydration (f ) corresponding to each
of the groups in hexadecane for each of the …ve simulated aggregate geometries: (i) a small spherical aggregate, (ii) a large spherical gate, (iii) a small cylindrical aggregate, (iv) a large cylindrical aggre-gate, and (v) a planar slab. . . 400 6-8 The ratio of the solvent accessible surface area (SASA) to the
geometrically-de…ned surface area (A) for each of the octane, dodecane, and hexade-cane oil aggregates simulated, grouped according to geometry. . . 402 6-9 Theoretical predictions of the hydration free energy di¤erence ( gwc)
associated with hydrating contacts in the aggregate state and in the bulk water state are shown as a function of curvature made using: (i) theoretical predictions based on values of SASAcore=Acore computed
from the simulation results, and (ii) theoretical predictions based on values of SASAcore=Acore. . . 405
7-1 Solvent accessible surface area (SASA) normalized by the average value of SASA as a function of simulation time for micelles of three rep-resentative nonionic surfactants: dodecyl maltoside (DM), dodecyl octa(ethylene oxide) (C12E8), and decanoyl-n-methylglucamide
(MEGA-10). . . 444 7-2 Snapshots of the post-equilibration structures of the seven simulated
micelles considered in Chapter 7. . . 443 7-3 The average fractional degree of hydration for each of the groups in
7-4 The average fractional degree of hydration for each of the groups in dodecyl maltoside (DM), where results are reported for f , fwater, and
fhead. . . 450
7-5 The average fractional degree of hydration for each of the groups in octyl sul…nyl ethanol (OSE), where results are reported for f , fwater,
and fhead. . . 452
7-6 The average fractional degree of hydration for each of the groups in decyl dimethyl phosphine oxide (C10PO), where results are reported
for f , fwater, and fhead. . . 454
7-7 The average fractional degree of hydration for each of the groups in decyl ethyl sulfoxide (C10SO), where results are reported for f , fwater,
and fhead. . . 456
7-8 The average fractional degree of hydration for each of the groups in dodecyl octa(ethylene oxide) (C12E8), where results are reported for f ,
fwater, and fhead. . . 457
7-9 The average fractional degree of hydration for each of the groups in decanoyl-n-methylglucamide (MEGA-10), where results are reported for f , fwater, and fhead. . . 459
7-10 The number of hydrating contacts experienced in bulk water for 8 hy-drophobic CH2 or CH3 groups in hexadecane, in octyl glucoside (OG),
and in octyl sul…nyl ethanol (OSE). . . 464 7-11 The number of hydrating contacts experienced in bulk water for 12
hydrophobic CH2 or CH3 groups in hexadecane, in dodecyl maltoside
(DM), and in dodecyl octa(ethylene oxide) (C12E8). . . 463
7-12 Predicted and experimental CMCs of mixtures of C10PO and C10SO,
where theoretical predictions are made using both the CS-MT model and the traditional MT model. . . 480
7-13 Predicted and experimental values of the CMC, where theoretical pre-dictions have been made using the CS-MT model with: (i) f values taken as input to evaluate gdehydr and ghydr, and (ii) fwater values taken
as input to evaluate gdehydr and ghydr. . . 486
7-A1 Solvent accessible surface area (SASA) normalized by the average value of SASA as a function of simulation time for: octyl glucoside (OG), dodecyl maltoside (DM), dodecyl octa(ethylene oxide) (C12E8), and
decanoyl-n-methylglucamide (MEGA-10) during the 5 ns data-gathering simulation run. . . 489 7-A2 Solvent accessible surface area (SASA) normalized by the average value
of SASA as a function of simulation time for: octyl sul…nyl ethanol (OSE), decyl dimethyl phosphine oxide (C10PO), and decyl methyl
sulfoxide (C10SO) during the 5 ns data-gathering simulation run. . . . 491
8-1 Solvent accessible surface area (SASA) normalized by the average value of SASA as a function of simulation time for micelles of three rep-resentative ionic and zwitterionic surfactants: sodium dodecyl fate (SDS), dodecylphosphocholine (DPC), and 3-hydroxy dodecyl sul-fonate (AOS-12). . . 509 8-2 Snapshots of the post-equilibration structures of the simulated micelles
corresponding to each of the nine ionic and zwitterionic surfactants considered in this chapter. . . 510 8-3 The average fractional degree of hydration, f , of each of the groups in
sodium dodecyl sulfate (SDS). . . 512 8-4 The average fractional degree of hydration, f , of each of the groups in
dodecylphosphocholine (DPC). . . 514 8-5 The average fractional degree of hydration, f , of each of the groups in
8-6 The average fractional degree of hydration, f , of each of the groups in 3-hydroxy dodecyl sulfonate (AOS-12, see A) and 3-hydroxy hexadecyl sulfonate (AOS-16, see B). . . 518 8-7 The average fractional degree of hydration, f , of each of the groups in
decyltrimethylammonium bromide (DC1AB, see A), C12H25C2H5N(CH3)2
Br (DC2AB, see B), C12H25C4H9N(CH3)2Br (DC4AB, see C), and
C12H25C6H13N(CH3)2Br (DC6AB, see D). . . 519
8-8 Comparison of the CMCs predicted using the CS-MT model and the CMCs predicted using three traditional MT modeling limits with ex-perimental CMC data for decyltrimethylammonium bromide (DC1AB),
C12H25C2H5N(CH3)2Br (DC2AB), C12H25C4H9N(CH3)2Br (DC4AB),
and C12H25C6H13N(CH3)2Br (DC6AB). . . 533
8-A1 Solvent accessible surface area (SASA) normalized by the average value of SASA as a function of simulation time for: sodium dodecyl sulfate (SDS), 3-hydroxy dodecyl sulfonate (AOS-12), 3-hydroxy hexadecyl sulfonate (AOS-16), and dodecylphosphocholine (DPC) during the 5 ns data-gathering simulation run. . . 540 8-A2 Solvent accessible surface area (SASA) normalized by the average value
of SASA as a function of simulation time for: cetyltrimethylammo-nium bromide (CTAB), decyltrimethylammocetyltrimethylammo-nium bromide (DC1AB),
C12H25C2H5N(CH3)2Br (DC2AB), C12H25C4H9N(CH3)2Br (DC4AB),
and C12H25C6H13N(CH3)2Br (DC6AB) during the 5 ns data-gathering
simulation run (see text). . . 541 9-1 Computational strategy used in the CS-FE/MT model. . . 552 9-2 Comparison of alchemical pathways used to determine Gfor
substrate-enzyme binding and for composition change in a micelle. . . 565 10-1 Alchemical free-energy pathway used in the CS-FE/MT model . . . . 575 10-2 Comparison of the single and dual topology approaches . . . 582
10-3 Topologies for surfactant to solubilizate transformation: the sodium dodecyl sulfate (SDS)/ibuprofen (IBU) topology is shown on the left, and the octyl glucoside (OG)/p-aminobenzoate (PAB) topology is shown on the right. . . 583 10-4 Topologies for surfactant to cosurfactant transformation: the n-decyl
dimethyl phosphine oxide (C10PO)/n- decyl methyl sulfoxide (C10SO)
topology is shown on the left, the (octylsul…nyl) ethanol (C8SE)/
(decylsul…nyl) ethanol (C10SE) topology is shown in the center, and
the n-decyl methyl sulfoxide (C10SO)/n-octyl methyl sulfoxide (C8SO)
topology is shown on the right. . . 585 10-5 Solvent accessible surface area (SASA) as a function of simulation time
for the SDS (A) and OG (B) micelles during the 10 ns of equilibration conducted prior to beginning alchemical transformation. . . 591 10-6 Solvent accessible surface area (SASA) as a function of simulation time
for the C10PO (A), C8SE (B), and C10SO (C) micelles during the 10 ns
of equilibration conducted prior to beginning alchemical transformations.592 10-7 Snapshots of the post-equilibration structures of the SDS, OG, C10PO,
C8SE, and C10SO micelles used as the starting point for free-energy
calculations. . . 593 10-8 Computed values of @G=@ as a function of data gathering time for
the transformation of SDS into IBU in aqueous solution (A) and in the micellar environment (B) at three values of : 0.0, 0.5, and 1.0. . . . 604 10-9 Computed values of @G=@ as a function of data gathering time for
the transformation of OG into PAB in aqueous solution (A) and in the micellar environment (B) at three values of : 0.0, 0.5, and 1.0. . . . 605 10-10 Computed values of @G=@ as a function of data gathering time for
the transformation of C10PO into C10SO in aqueous solution (A) and
10-11 Computed values of @G=@ as a function of data gathering time for the transformation of C8SE into C10SE in aqueous solution (A) and in
the micellar environment (B) at three values of : 0.0, 0.5, and 1.0. . 608 10-12 Computed values of @G=@ as a function of data gathering time for
the transformation of C10SO into C8SO in aqueous solution (A) and in
the micellar environment (B) at three values of : 0.0, 0.5, and 1.0. . 609 10-13 Computed values of h@G=@ i as a function of for the transformation
of SDS into IBU in aqueous solution and in the micellar environment. 611 10-14 Computed values of h@G=@ i as a function of for the transformation
of OG into PAB in aqueous solution and in the micellar environment. 612 10-15 Computed values of h@G=@ i as a function of for the
transfor-mation of C10PO into C10SO in aqueous solution and in the micellar
environment. . . 614 10-16 Computed values of h@G=@ i as a function of for the
transfor-mation of C8SE into C10SE in aqueous solution and in the micellar
environment. . . 615 10-17 Computed values of h@G=@ i as a function of for the
transfor-mation of C10SO into C8SO in aqueous solution and in the micellar
environment. . . 616 10-A1 Pro…les of h@G=@ i calculated for hexane in vacuo and in water as
a function of the value of the coupling parameter . . . 628 10-A2 Schematic representation of the ethane to ethane and the propane to
propane self-transformation; below the schematics, pro…les of h@G=@ i calculated for the ethane to ethane and propane to propane “self-transformations” are shown as a function of the value of the coupling parameter . . . 630 10-A3 Schematic representation of the alchemical and non-alchemical
free-energy path used to evaluate the di¤erence in the hydration free ener-gies of benzene and hexane. . . 632
10-A4 Schematic representation of the alchemical and non-alchemical free-energy path used to evaluate the di¤erence in the hydration free ener-gies of benzoate and propionate. . . 633 11-1 Chemical structures of three poly(‡uorooxetane)s and 3M Fluorad
FC-129. . . 643 11-2 Sequence of steps followed to form and equilibrate simulation cells
con-taining monolayers of surfactants 1 -4. . . 649 11-3 Simulation cell x (or equivalently y) dimension [nm] equilibration curves
for 1) surfactant 1, 2) surfactant 2, 3) surfactant 3, and 4) surfactant 4. . . 653 11-4 Representative snapshots of surfactant 3 at the water/air interface at
(a) low surface concentration and (b) saturation. . . 658 11-5 Representative snapshot (from below the water surface) of a monolayer
of surfactant 2. . . 660 11-6 Number density pro…le for surfactant 1 at the water/air interface,
where S refers to the two sulfur atoms in each surfactant, O-S to each of the four oxygen atoms bonded to each sulfur atom, O-back to each oxygen atom present in the carbon-oxygen surfactant backbone, C-back to the average density of each carbon atom in the carbon-oxygen surfactant backbone, and O-Rf to the average density of each Rf group
(as de…ned in Figure 1) and the oxygen atom connecting the Rf group
11-7 Number density pro…le for surfactant 2 at the water/air interface, where S refers to the two sulfur atoms in each surfactant, O-S to each of the four oxygen atoms bonded to each sulfur atom, O-back to each oxygen atom present in the carbon-oxygen surfactant backbone, C-back to the average density of each carbon atom in the carbon-oxygen surfactant backbone, and O-Rf to the average density of each Rf group
(as de…ned in Figure 1) and the oxygen atom connecting the Rf group
to the surfactant backbone. . . 661 11-8 Number density pro…le for surfactant 3 at the water/air interface,
where S refers to the two sulfur atoms in each surfactant, O-S to each of the four oxygen atoms bonded to each sulfur atom, O-back to each oxygen atom present in the carbon-oxygen surfactant backbone, C-back to the average density of each carbon atom in the carbon-oxygen surfactant backbone, and O-Rf to the average density of each Rf group
(as de…ned in Figure 1) and the oxygen atom connecting the Rf group
to the surfactant backbone. . . 664 11-9 Number density pro…le for surfactant 4 at the water/air interface,
where CO2 refers to the carboxylate group, CH2-CO2 to the CH2
group attached to the CO2 group, N to the nitrogen atom, CH3CH2-N
to the ethyl group attached to the nitrogen atom, SO2 to the sulfur atom and the two oxygen atoms attached to it, and F(CF2)8 to the average density of the carbon and ‡uorine groups comprising the linear ‡uorocarbon chain. . . 665 11-10 Scaled density pro…les for surfactant 3 at the water/air interface, where
simulation data is shown as points, and the curve …ts are shown as solid lines. . . 669 11-11 Scaled density pro…les for surfactant 4 at the water/air interface, where
simulation data is shown as points, and the curve …ts generated by …tting are shown as solid lines. . . 670
11-12 Average degree of hydration for surfactants 1-4, as measured by the number of water oxygen atoms within 0.5 nm of selected groups of surfactant atoms, where results are presented for 1) surfactant 1, 2) surfactant 2, 3) surfactant 3, and 4) surfactant 4. . . 673 12-1 The chemical structures of asiatic acid (AA) and madecassic acid (MA).687 12-2 Starting and ending con…guration of the AA (A) and MA (B) simulations.694 12-3 The number of micellar aggregates identi…ed using the hydropohobic
contact criterion). . . 696 12-4 The average aggregation number of the AA and MA micelles). . . 698 12-5 The number of monomers identi…ed in the AA and MA simulation cells).700 12-6 The radial distribution functions g (r)O -H
2O and g (r)OH-H2O (see text)
for AA and MA. . . 706 12-7 The radial distribution function g (r)O -Na+ (see text) for AA and MA. 707
12-8 Degree of hydration for O , for OH, and for the carbon ring measured during 75 ns of molecular dynamics simulation. . . 708 12-9 The total, hydrophobic, and hydrophilic solvent accessible surface area
(SASA) measured during 75 ns of molecular dynamics simulation. . . 710 12-10 The thermodynamic cycle used to evaluate the free energy of micelle
List of Tables
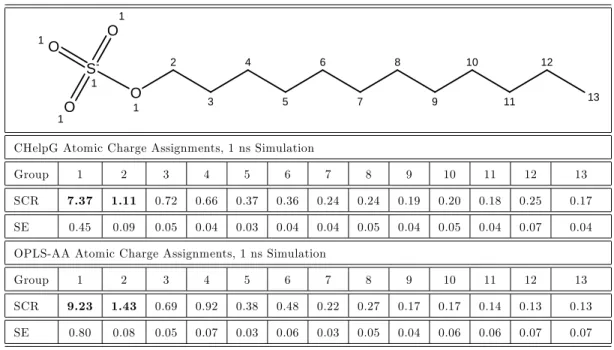
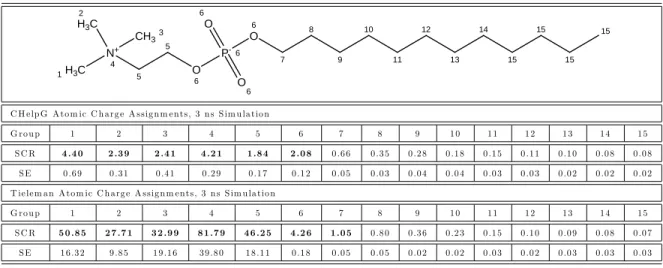
2.1 Simulated scaled contact ratios (SCR) and standard errors (SE) for SDS based on the assignment of: i) CHelpG atomic charges, and ii) OPLS-AA atomic charges. . . 113 2.2 Simulated scaled contact ratios (SCR) and standard errors (SE) for
CTAB based on the assignment of: i) CHelpG atomic charges, and ii) OPLS-AA atomic charges. . . 114 2.3 Simulated scaled contact ratios (SCR) and standard errors (SE) for
DPC based on the assignment of: i) CHelpG atomic charges, and ii) OPLS-AA atomic charges. . . 117 2.4 Simulated scaled contact ratios (SCR) and standard errors (SE) for
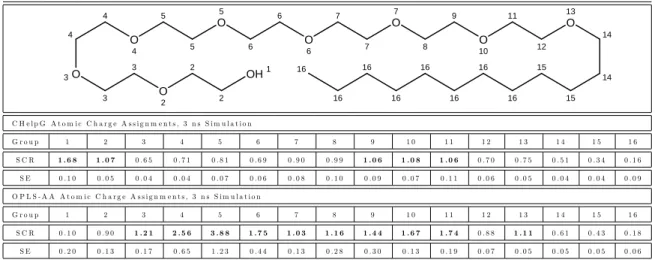
C12E8 based on the assignment of: i) CHelpG atomic charges, and ii)
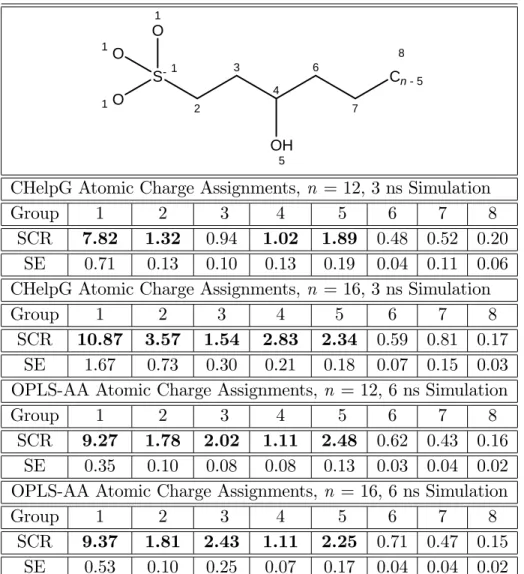
OPLS-AA atomic charges. . . 117 2.5 Simulated scaled contact ratios (SCR) and standard errors (SE) for n =
12 and n = 16 (where n is the alkyl chain length of group 8) 3-hydroxy sulfonate (AOS) based on the assignment of: i) CHelpG atomic charges, and ii) OPLS-AA atomic charges. Scaled contact ratios corresponding to the surfactant "head" are shown in bold. . . 119 2.6 Simulated scaled contact ratios (SCR) and standard errors (SE) for
MEGA-10 based on the assignment of: i) CHelpG atomic charges, and ii) OPLS-AA atomic charges. . . 121
2.7 Molecular-thermodynamic modeling results and experimental data for SDS using the head and tail identi…cations predicted based on com-puter simulation, including: (i) the predicted transfer (gtr), interfacial
(gint), packing (gpack), steric (gst), and electrostatic (gelec) contributions
to the free energy of micellization (gmic), (ii) the theoretical
predic-tions for the CMC and the weight-average micelle the weight-average aggregation number, and (iii) experimental data on the CMC and the weight-average micelle aggregation number. . . 123 2.8 Molecular-thermodynamic modeling results and experimental data for
CTAB using the head and tail identi…cations predicted based on: i) the CHelpG atomic charges, and ii) the OPLS-AA atomic charges, in-cluding: the predicted free energy of micellization (gmic), the predicted
transfer free-energy contribution (gtr), the predicted CMC, and the
predicted weight-average micelle aggregation number hNiw. . . 125
2.9 Molecular-thermodynamic modeling results and experimental data for DPC using the head and tail identi…cations predicted based on: i) the CHelpG atomic charges, and ii) the OPLS-AA atomic charges, includ-ing: the predicted free energy of micellization (gmic), the predicted
transfer free-energy contribution (gtr), the predicted CMC, and the
predicted weight-average micelle aggregation number hNiw. . . 127
2.10 Molecular-thermodynamic modeling results and experimental data for C12E8 using the head and tail identi…cations predicted based on: i)
the CHelpG atomic charges, and ii) the OPLS-AA atomic charges, in-cluding: the predicted free energy of micellization (gmic), the predicted
transfer free-energy contribution (gtr), the predicted CMC, and the
2.11 Molecular-thermodynamic modeling results and experimental data for n = 12 and n = 16 3-hydroxy sulfonates using the head and tail iden-ti…cations predicted based on: i) the CHelpG atomic charges, and ii) the OPLS-AA atomic charges, including: the predicted free energy of micellization (gmic), the predicted transfer free-energy contribution
(gtr), the predicted CMC, and the predicted weight-average micelle
aggregation number. . . 129 2.12 Molecular-thermodynamic modeling results and experimental data for
MEGA-10 using the head and tail identi…cations predicted based on: i) the CHelpG atomic charges, and ii) the OPLS-AA atomic charges, including: the predicted free energy of micellization (gmic), the
pre-dicted transfer free-energy contribution (gtr), the predicted CMC, and
the predicted weight-average micelle aggregation number. . . 132 3.1 Experimentally-determined critical micelle concentrations (CMCs) of
SDS, DTAB, and C12E8 in water, phosphate bu¤er at pH 7.4, and
ibuprofen-saturated (4 mM) phosphate bu¤er at pH 7.4. . . 151 3.2 Simulated scaled contact ratios (SCRs) and standard errors (SEs) for
groups of atoms in ibuprofen based on the assignment of: i) CHelpG atomic charges, and ii) OPLS-AA atomic charges. . . 162 3.3 Input parameters for the molecular-thermodynamic modeling of the
surfactants SDS, DTAB, and C12E8. . . 166
4.1 Oil/water interface, cylindrical micelle, and spherical micelle simula-tion results for ibuprofen. . . 281 4.2 Oil/water interface, cylindrical micelle, and spherical micelle
simula-tion results for benzamide. . . 282 4.3 Oil/water interface, cylindrical micelle, and spherical micelle
simula-tion results for acetophenone. . . 283 4.4 Oil/water interface, cylindrical micelle, and spherical micelle
4.5 Oil/water interface, cylindrical micelle, and spherical micelle simula-tion results for o-aminobenzoate. . . 285 4.6 Oil/water interface, cylindrical micelle, and spherical micelle
simula-tion results for m-aminobenzoate. . . 286 4.7 Oil/water interface, cylindrical micelle, and spherical micelle
simula-tion results for p-aminobenzoate. . . 287 5.1 Geometric parameters for all surfactants and solubilizates. . . 315 5.2 Molecular properties of the tail fragments of each surfactant and
solu-bilizate. . . 317 5.3 Molecular-thermodynamic modeling results for solubilization in anionic
surfactants. . . 328 5.4 Molecular-thermodynamic modeling results for solubilization in
non-ionic surfactants. . . 328 5.5 Molecular-thermodynamic modeling results for solubilization in cationic
surfactants. . . 328 5.6 Solubilization predictions made using the molecular-thermodynamic
model: solubilization in anionic surfactants. . . 340 5.7 Solubilization predictions made using the molecular-thermodynamic
model: solubilization in nonionic surfactants. . . 340 5.8 Solubilization predictions made using the molecular-thermodynamic
model: solubilization in cationic surfactants. . . 340 6.1 Geometric characteristics of each of the …ve octane aggregates
sim-ulated, including the aggregation number (n), the aggregate volume (V ), the aggregate surface area (A), the aggregate core-minor radius (lc), the periodic length (P L) of each cylinder and slab, and the degree
6.2 Geometric characteristics of each of the …ve dodecane aggregates sim-ulated, including the aggregation number (n), the aggregate volume (V ), the aggregate surface area (A), the aggregate core-minor radius (lc), the periodic length (P L) of each cylinder and slab, and the degree
of curvature (C). . . 387 6.3 Geometric characteristics of each of the …ve hexadecane aggregates
simulated, including the aggregation number (n), the aggregate volume (V ), the aggregate surface area (A), the aggregate core-minor radius (lc), the periodic length (P L) of each cylinder and slab, and the degree
of curvature (C). . . 388 6.4 Computer simulation/molecular-thermodynamic (CS-MT) and
tradi-tional molecular-thermodynamic (MT) modeling results for gdehydr, ghydr,
and gform corresponding to each of the …ve octane, dodecane, and
hexadecane aggregate geometries simulated and modeled in this chap-ter. . . 407 6.5 Predicted values of gtr,CS-MT for octane, dodecane, and hexadecane. . 414
6.6 Predicted values of gform, gform, max, and gform, min for the …ve simulated
geometries of dodecane obtained using the CS-MT model. . . 415 7.1 The number of surfactant and water molecules and the total number of
atoms corresponding to each of the seven nonionic surfactant micelles simulated in Chapter 7. . . 440 7.2 Simulation results for the number of hydrating contacts (Ncont), the
change in the number of hydrating contacts relative to the correspond-ing oil aggregate ( Ncont Ncont,oil agg), and the “Shielded Area”
corresponding to the area at the micelle core/water interface that is shielded from hydrating contacts by the surfactant heads for octane, octyl glucoside (OG), octyl sul…nyl ethanol (OSE), dodecane, dode-cyl maltoside (DM), and dodedode-cyl octa(ethylene oxide) (C12E8) in the
7.3 Computer simulation/molecular-thermodynamic (CS-MT) and tradi-tional molecular-thermodynamic (MT) modeling results for each of the seven simulated nonionic surfactant micelles considered in this article, where CS-MT model predictions are reported for gdehydr, ghydr, ^gint, and
gtr,CS-MT and traditional MT modeling results for gtr are presented for
comparison with gtr,CS-MT. . . 472
7.4 Computer simulation/molecular-thermodynamic (CS-MT) and tradi-tional molecular-thermodynamic (MT) modeling results for each of the seven nonionic surfactants considered in this article. . . 473 7.5 Comparison of the CS-MT and traditional MT model predictions for
gform and the CMC obtained using the values of gtr,CS-MT and gtr
re-ported in Table 3, respectively. . . 474 8.1 The geometry, the number of surfactant and water molecules, and the
total number of atoms corresponding to each of the ionic and zwitte-rionic micelle simulations discussed in Chapter 8. . . 507 8.2 The traditional MT model identi…cations of heads and tails and
molec-ular parameters used to model each surfactant using the CS-MT model and the traditional MT model (ah, the cross-sectional area of the
sur-factant head, dcharge, the distance between the beginning of the
surfac-tant tail and the location of the charge in the surfacsurfac-tant head, and lhg,
the length of the surfactant head). . . 523 8.3 Computer simulation/molecular-thermodynamic (CS-MT) and
tradi-tional molecular-thermodynamic (MT) modeling results for each of the nine simulated ionic and zwitterionic surfactant micelles considered in this article, where CS-MT model predictions are reported for gdehydr,
ghydr, ^gint, and gtr,CS-MT and traditional MT modeling results for gtr are
8.4 Computer simulation/molecular-thermodynamic (CS-MT) and tradi-tional molecular-thermodynamic (MT) modeling results for each of the nine ionic and zwitterionic surfactants considered in this article. . . . 525 8.5 Modeling results for the optimal micelles, where the CS-MT and the
traditional MT model predictions of gform were obtained using the
val-ues of gtr,CS-MT and gtr reported in Table 4, respectively. . . 526
10.1 The number of surfactant and water molecules, and the total num-ber of atoms corresponding to the starting point for each alchemical simulation in the micellar environment. . . 589 10.2 Transformation free energies computed using the CS-FE/MT model. 595 10.3 Transformation free energies computed using the CS-FE/MT model
with additional windows. . . 618 11.1 Values of the interfacial area per surfactant molecule at saturation
reported by Kausch et al. based on …tting experimental surface tension data to the Davies and Gibbs adsorption isotherms. . . 642 11.2 Computer simulation estimates of the interfacial area per surfactant
molecule at saturation for surfactants 1-4. . . 654 11.3 E¤ect of applied surface tension on the interfacial area per surfactant
molecule for surfactants 1-4. . . 657 11.4 Estimates of the amplitude of ‡uctuations for surfactants 1-4 at the
water/air interface expected based on 1 kBT of energy. . . 659
11.5 The width (wair) and location (zairo ) of the air interface in
nanome-ters, the width (wwater) and location (zwatero ) of the water interface in
nanometers, the width of the Gaussian distribution of surfactant den-sity and the location (zo
surf) of the peak of the Gaussian distribution
in nanometers, the separation distance between the location of the air and water interfaces, j zj, and values of the penetration parameter for each surfactant. . . 671
11.6 Order parameters with respect to the x, y, and z-axis for the side chains of surfactants 1-3 and the ‡uorocarbon chain of surfactant 4. 675 12.1 Principal moments of the gyration tensor ( x, y, z) and the radius
of gyration (Rg) computed for AA and MA micelles. . . 702
12.2 Micellar (Pmic) and nearest neighbor (Pn.n.) order parameters computed
PART I
— — — — — — — — — — — — — — — — — — — — — — — — — — — — — — — –APPLICATION OF COMPUTER
SIMULATIONS TO OBTAIN
MOLECULAR-THERMODYNAMIC
INPUTS
Chapter 1
Introduction
1.1
Motivation
Surfactants are used in many pharmaceutical, industrial, and environmental applica-tions because of their unique solution properties. When dissolved in water, at concen-trations that exceed the critical micelle concentration (CMC), surfactant molecules self-assemble into micellar aggregates, with their hydrophobic portions shielded from water in the aggregate interior, and their hydrophilic portions exposed to water at the aggregate surface. This self-assembly is driven primarily by the hydrophobic e¤ect, although van der Waals, hydrogen-bonding, and screened electrostatic interactions (in the case of charged surfactants) also play an important role in determining how micellization occurs [1].
The solubility of hydrophobic or partly hydrophobic substances in aqueous solu-tion can be increased through the addisolu-tion of surfactants to the solusolu-tion at concentra-tions that exceed the CMC and solubilization of the hydrophobic substances within the micelle interior [2–5]. In general, solubilization can be thought of as occurring in three general ways: (i) formation of a pure droplet of solubilizate in the micelle core, (ii) solubilization within the surfactant tails, or (iii) solubilization in the head-shell region. Solubilization may lead to changes in micelle shape and size and can there-fore in‡uence the bulk solution properties of micellar solutions. For example, the
solubilization of aromatic hydrocarbons can result in a micelle shape transition from spherical to rodlike. Such a shape transition serves to increase the bulk viscosity of the surfactant solution [3].
A wide variety of industrial, pharmaceutical, and biological processes make use of surfactants [2, 3]. The ability of surfactants to aid in the mixing of hydrophobic and hydrophilic molecules is used extensively in the chemical industry in applications such as the removal of oily materials from a substrate, reaction rate enhancement in polymerization reactions, and separation processes [2, 3, 6]. Surfactants also have po-tential application in the pharmaceutical industry to solubilize water-insoluble drugs in aqueous solutions for subsequent injection into a patient’s body [7]. Examples of biological processes involving surfactants include the role of phospholipid biosurfac-tants in the gastrointestinal tract during digestion, and the body’s use of bile salts to solubilize cholesterol [2].
Because micellar solubilization is such a broadly applicable phenomenon, gaining a fundamental understanding of the factors that a¤ect micellar solubilization is of great academic as well as practical interest. Frequently, a speci…c set of micellar solution and solubility characteristics are desired for a given application. These characteristics include the CMC and the shape and size of the micellar aggregates that form in solution. Other characteristics include the extent of solubilization, which can be quanti…ed in a number of ways, and the location of the solubilizate within the micelle, referred to as the locus of solubilization.
The development of theoretical modeling approaches that both (i) provide fun-damental, molecular-level understanding of micellization phenomena, and (ii) enable prediction of bulk solution (CMC, extent of solubilization) and microstructural (lo-cus of solubilization, micelle shape and size) properties would signi…cantly reduce the e¤ort and cost associated with surfactant solution formulation. For example, in de-tergency applications, it is important to maximize the amount of material solubilized. For this application, theoretical prediction of the extent of solubilization for various classes of surfactants is directly relevant. For drug delivery, a wide range of criteria
must be met, including: (i) low toxicity, (ii) su¢ cient residence time in the body, (iii) high solubilization capacity, and (iv) the ability to deliver the drug to the desired site in the body. To develop a surfactant solution capable of meeting each of these criteria, it is important to know the extent of solubilization, the micelle shape and size, and the locus of solubilization. In many cases, theoretical predictions of bulk micellar solution properties such as the CMC and the extent of solubilization, and the theoretical prediction of micelle microstructure can be correlated with other bulk solution properties of practical relevance. For example, researchers have reported correlations between the geometry and size of micelles with solution viscosity, and between the monomer and micelle concentrations with the potential of a surfactant to induce skin irritation [8].
With the above motivation in mind, this thesis explores the application of three approaches to model surfactant micellization and micellar solubilization. The …rst approach involves the use of computer simulations (CS) to obtain input parame-ters for molecular-thermodynamic (MT) modeling of surfactant micellization and micellar solubilization. Development of a hybrid computer simulation/molecular-thermodynamic modeling approach is motivated by the limitations inherent in com-puter simulations (namely, the high computational expense of modeling self-assembly) and MT modeling approaches (their restriction to structurally and chemically simple surfactants and solubilizates). A key input required for traditional MT modeling is the identi…cation of the hydrated and the unhydrated portions (head and tail) of sur-factants and solubilizates in a self-assembled micellar aggregate. Prior to this thesis, no approach was developed to determine this information for structurally complex surfactants and solubilizates. By conducting simulations of surfactants and solu-bilizates at a water/oil interface (modeling the water/micelle core interface) or in a micellar environment, we have determined hydration information for both simple and complex surfactants and solubilizates. This information has been successfully used as an input to MT modeling, and has been shown to extend the applicability of the traditional MT modeling approach to more complex surfactant and solubilizate
systems than had been possible to date. In total, 46 surfactant and solubilizate sys-tems have been modeled with this approach, including syssys-tems of anionic, cationic, zwitterionic, and nonionic surfactants. For each of the systems modeled, theoretical predictions have been compared with experimental data available in the literature and with experimental data gathered by our research collaborators in São Paulo, Brazil. A novel, alternative approach has also been developed to more accurately quantify the hydrophobic driving force for micelle formation. This new approach is referred to as the computer simulation/molecular-thermodynamic (MT) model. In the CS-MT modeling approach, atomistic molecular dynamics (MD) simulations are used to quantify the hydration changes that take place during self-assembly. This hydration information is then used in a new MT model to quantify the hydrophobic e¤ect, which is decomposed into two components: (1) the free-energy change associated with the dehydration of solute hydrophobic groups that accompanies aggregate self-assembly (as captured in gdehydr), and (2) the change in hydration free energy experienced by
these same hydrophobic groups during aggregate self-assembly (as captured in ghydr).
The CS-MT model is formulated to allow the prediction of the free-energy change associated with aggregate formation of solute aggregates of any shape and size by performing only two computer simulations — one of the solute in bulk water and the second of the solute in an aggregate of arbitrary shape and size. The CS-MT model-ing approach has been validated by usmodel-ing it to model the formation of 15 di¤erent oil aggregates of various shapes and sizes in aqueous solution, the micellization behav-ior of seven di¤erent simple and complex nonionic surfactants in aqueous solution, and the micellization behavior of nine di¤erent ionic and zwitterionic surfactants in aqueous solution. For each of the systems modeled, the CS-MT model predictions were in reasonable agreement with the experimental data, and in most cases, were in better agreement with the experimental data than the predictions of the traditional MT model.
The second approach explored in this thesis involves the use of computer simula-tion free-energy methods in the context of micellizasimula-tion and micellar solubilizasimula-tion.