Comparison of Methods for Evaluating Impacts of
Aviation Noise on Communities
by
Morrisa Adelle Brenner
S.B. Aerospace Engineering with Information Technology Massachusetts Institute of Technology, 2013
Submitted to the Department of Aeronautics and Astronautics in Partial Fulfillment of the Requirements for the Degree of
Master of Science in Aeronautics and Astronautics at the
Massachusetts Institute of Technology June 2017
C 2017 Massachusetts Institute of Technology. All rights reserved.
Signature of Author: Certified by: Accepted by: MASSACHUSETTS INSTITUTE OF TECHNOLOGY
JUL 112017
LIBRARIES
ARCHIVES
_
Signature redacted
Department of Aeronautics and Astronautics May 25, 2017
Signature redacteQ.
R. John Hansman T. Wilson Professor of Aeronautics and Astronautics Thesis Supervisor
Signature
redacted-(/
Youssef M. MarzoukAssociate Professor of Aeronautics and Astronautics Chair, Graduate Program Committee
Page Intentionally Left Blank
Comparison of Methods for Evaluating Impacts of
Aviation Noise on Communities
by
Morrisa Adelle Brenner
Submitted to the Department of Aeronautics and Astronautics on May 25, 2017 in Partial Fulfillment of the
Requirements for the Degree of Master of Science in Aeronautics and Astronautics
Abstract
Community opposition to the noise concentration from precise NextGen Performance-Based Navigation (PBN) aircraft arrival and departure procedures poses a significant threat to the future of these procedures in the U.S. National Airspace System. A substantial number of complaints concerning airport noise come from locations outside the 65dB Day-Night Level (DNL) contour considered the significant noise exposure threshold in U.S. federal regulation. This indicates that this threshold does not sufficiently capture areas that experience annoyance related to more concentrated, lower level overflight noise at distances farther from the airport. This thesis assesses the effectiveness by which different noise analysis methods capture the locations of these airport noise complaints through examination of the noise exposure for three representative scenarios at Boston Logan International Airport using DNL and number of overflights above a noise threshold (Nabove) metrics. The three scenarios examined include the standard noise analysis methodology scenario (annual average day) as well as a day of heavy usage of a noise-sensitive runway (33L for departures), and a scenario representing a peak hour of departures on this runway. The results indicate that the 33L peak day scenario does a better job of capturing a substantial fraction of the complainants sensitive to the 33L departure trajectories (66%-87% at the 45dB-5OdB DNL thresholds) than the standard annual average day scenario. Results for the 33L peak day scenario indicate that the Nabove metric is also effective at capturing noise complaints at the 60dB day/50dB night noise threshold at exposure rates in the 25-50 overflight range (78%-84% complainant capture).
Thesis Supervisor: R. John Hansman
Acknowledgements
First, I would like to thank Professor Hansman for his academic and professional guidance and support throughout my career at MIT. His extensive experience in academia and aviation research was immensely valuable in the preparation of this thesis and has helped me refine my approaches to solving problems and presenting results.
Second, I would like to thank my collaborators in ICAT and LAE for their technical and moral support throughout the projects I have been a part of during my graduate career. I would like to particularly thank Luke Jensen, Jacquie Thomas, and Cal Brooks, with whom I collaborated closely on aviation noise research and many of whom contributed to work used or referenced in this thesis. Although I cannot thank everyone else individually, I sincerely appreciate the support and guidance of all those I had the pleasure of working with during my graduate career at MIT.
I would like to thank Massport for access to the complaint data that made the analysis in this thesis possible as well as their insights.
I would also like to thank the Federal Aviation Administration, especially project managers Joseph DiPardo and Christopher Dorbian at the FAA Office of Environment and Energy, for their feedback and insights.
This work was sponsored by the Federal Aviation Administration (FAA) under ASCENT Center of Excellence Project 23, Cooperative Agreement 13-C-AJFE-MIT-008. Opinions, interpretations, conclusions, and recommendations are those of the authors and are not necessarily endorsed by the United States Government.
Finally, I would like to thank my family and friends for their support of all my endeavors. Although he never had the opportunity to see me pursue a career in aeronautics, I would like to specifically thank my grandfather for helping inspire me to pursue engineering and aerospace.
Table of Contents
Chapter 1 Introduction ... ... 15
1.1 Motivation... 15
1.2 Research Objective and Scope... 18
Chapter 2 Background... 19
2.1 Sound and Loudness... 19
2.2 Introduction to Aviation Noise Analysis... 20
2.2.1 Single Event Aviation Noise Metrics ... 21
2.2.1.1 Maximum Sound Level Metric: LAmax.--... ---... 21
2.2.1.2 Exposure-Based M etric: SEL ... 21
2.2.2 Multiple Event Aviation Noise Metrics... 22
2.2.2.1 Maximum Sound Level Metric: Nabove ... 22
2.2.2.2 Exposure-Based M etric: DNL ... 23
2.2.2.3 DNL and Nabove in the Context of Annoyance... 25
2.3 U.S. Federal Airport Noise Regulation and Reporting ... 26
2.3.1 U se of D N L ... 26
2.3.2 Federally-Mandated Aviation Noise Analysis Tool: AEDT ... 27
2.4 Past Studies of Aviation Noise and Annoyance... 27
Chapter 3 Overview of Case Studies... 31
3.1 Scenario 1: Annual Average Day... 34
3.2 Scenario 2: 33L Peak Day ... 36
3.3 Scenario 3: 33L Peak Hour ... 41
3.4 Quantification of Scenario Noise Impact: DNL and Nabove ... .. .44
3.5 Evaluation of the Effectiveness of Noise Impact Metrics with Respect to Complainant Location... 44
3.5.1 Calculation of Population Exposure ... 45
3.5.2 Calculation of Complainant Coverage... 45
Chapter 4 Noise M odeling M ethodology ... 47
4.1 Rapid Aviation Environmental Impact Modeling Framework Overview... 47
4.2 Representative Fleet Selection ... 49
4.3 Trajectory Definition... 50
4.3.1 Lateral Track Generation and Runway Assignment... 50
4.3.2 Vertical Profile Definition ... 54
4 .3 .2 .1 A rriv a ls ... 5 5 4 .3 .2 .2 D epartures ... 59
4.4 Calculation of Single Flight Noise Results... 63
Chapter 5 Comparison of Annual Average Daily Operations DNL Contours ... 65
Chapter 6 Case Study Results ... 69
8
L 6 ... SaauaJaJH
S6...
...
J.UoluoaXq
a~gUaAO3juvu!jdtuo3 pule 'ainsodx~l uopindoj
",&av
-noluoa jo salqujL
pui3 sdIN
Jfnojuoa:slfnsa-J
SIOS1JI9UV .IflOf IBM~ r7W731 xipuaddV
...
6l~OXq
a~tVjlAOjuvu~ivdtuo punt 'linsodx~l uopljfldol
'lv
.nowuo3 jo
salqqujL puns sdivpj nojuo3 :sjnsa-d sisXIvuV
A~j ijiaj r! (Ixipuaddy
16...
...
J.fnluoD Xqa28.JaAO3juicu!iudmoa pun 'ainsodx~l uo!iundod
'lvJy.nojuo3 Jo salqiujj
putr sdv~
Jfojuo3
:sjlnsaH SISSIpRUyXR~j aI~.UAVprenuuy
a xipuaddV
C8...salpjoij adX
1ll~usad-
a
xipuaddV
6 ...
Uu~ssV Ulf[ JJ.1JV a~jjasia Vxipuaddy
...
uO!l~luO3Liajvq
EL... ... Aoqt NJO UO!Wl1A3l C-9
List of Figures
Figure 1: Changes in Flight Track Dispersion Due to Implementation of RNAV PBN Procedure for Runway 33L Departures at BOS. Source: Massport [2]... 16 Figure 2: 2015 Departure Flight Tracks at BOS, with Complaint Locations and Official
Annual Average DNL Contours; Regulatory Significant Exposure Contour of 65dB DNL is Purple. Overlay Source: Massport [3]. Complainant Map Source: Hansman [2 ] ... 17 Figure 3: 2015 Arrival (left) and Departure (right) Flight Tracks at BOS, with Complaint
Locations in Red. Source: Hansman [2] ... 17 Figure 4: Common Sounds on an Instantaneous A-Weighted dB Scale. Source: OSHA [5] ... 19 Figure 5: SEL Calculation for a Single Flyover Event. Source: Trani [8] ... 22 Figure 6: Relationship Between Average Time Between Overflights and Daily Nabove... 23
Figure 7: DNL vs. Number of Operations for Different SEL Values... 25 Figure 8: Percent of People Highly Annoyed by DNL. Source: HMMH [12]... 28 Figure 9: Locations of Noise Complaints at BOS, August 2015 - July 2016 ... 33 Figure 10: FAA Airport Diagram for BOS with Annotation For Runway 33L Departures.
Airport Diagram Source: FAA [18]... 37 Figure 11: BOS Runway 33L Departures and Complaints. Source: Hansman [2]... 38 Figure 12: Northwest Quadrant Complainants at BOS, August 2015 - July 2016 ... 39 Figure 13: Diagram of Rapid Aviation Environmental Modeling Toolset. Adapted from
[2 1] ... 4 8 Figure 14: Clusters of Arrival (left) and Departure (right) Tracks at BOS from 20 days of
A SD E-X data 2015-2016... 51
Figure 15: Centroids and Representative Tracks for Arrival (left) and Departure (right) C lu sters ... 5 1
Figure 16: Arrival (left) and Departure (right) Cluster Membership... 52 Figure 17: Arrival Profile Altitudes from 20 days of ASDE-X data for the Boeing
737-8 0 0 ... 5 6 Figure 18: Arrival Profile Altitudes and Matched Arrival Profile for the Boeing 737-800
... 5 9 Figure 19: Departure Profile Altitudes from 20 days of ASDE-X data for the Boeing
737-8 0 0 ... 6 0 Figure 20: Graphical Depiction of Departure Profile Definition... 61 Figure 21: Departure Profile Altitudes and Matched Departure Profile for the Boeing
7 3 7 -8 0 0 ... 6 3 Figure 22: Modeled Annual Average DNL Contours (left) and 2015 BOS Environmental
Data Report DNL Contours (right). Source for right-hand image: Massport [3]... 65 Figure 23: 2015 BOS Environmental Data Report DNL Contours Overlaid on Modeled
Annual Average DNL Contours. Note: maps do not have perfect alignment. Source for overlay: M assport [3] ... 66 Figure 24: Annual Average Day DNL Contours ... 70 Figure 25: Annual Average Day DNL Contours ... 72
Figure 26: 33L Peak Day DNL Contours ... 72
Figure 27: 33L Peak Hour DNL Contours... 72
Figure 28: 33L Peak Day DNL Contours ... 75
Figure 29: 33L Peak Day Nabove 60dB Day/50dB Night Contours ... 75
List of Tables
Table 1: Annual Average Day Departures Per Runway by Aircraft Type Bin -Day ... 35
Table 2: Annual Average Day Departures Per Runway by Aircraft Type Bin -Night .... 35
Table 3: Annual Average Day Arrivals Per Runway by Aircraft Type Bin -Day ... 35
Table 4: Annual Average Day Arrivals Per Runway by Aircraft Type Bin -Night ... 36
Table 5: 33L Peak Day Departures Per Runway by Aircraft Type Bin -Day... 40
Table 6: 33L Peak Day Departures Per Runway by Aircraft Type Bin -Night ... 40
Table 7: 33L Peak Day Arrivals Per Runway by Aircraft Type Bin - Day ... 40
Table 8: 33L Peak Day Arrivals Per Runway by Aircraft Type Bin -Night... 41
Table 9: 33L Peak Hour Departures Per Runway by Aircraft Type Bin -Day ... 42
Table 10: 33L Peak Hour Departures Per Runway by Aircraft Type Bin -Night... 43
Table 11: 33L Peak Hour Arrivals Per Runway by Aircraft Type Bin -Day ... 43
Table 12: 33L Peak Hour Arrivals Per Runway by Aircraft Type Bin -Night... 43
Table 13: Fleet Selection and Daily Operations Counts... 49
Table 14: Track Allocation by Runway - Arrivals... 53
Table 15: Track Allocation by Runway - Departures ... 54
Table 16: Approach Profile Definition. Adapted and Updated from [23]... 58
Table 17: Departure Profile Definition. Adapted and Updated from [23]... 61
Table 18: Annual Average Day Complainant Coverage by DNL Contour Level... 70
Table 19: 33L Departures Complainant Coverage for All Scenarios by DNL Contour L ev e l ... 7 2 Table 20: Contour Area and Population Exposure for All Scenarios by DNL Contour L ev e l ... 72
Table 21: 33L Departures Complainant Coverage for 33L Peak Day Scenario by Contour Level, Nabove 60dB Day/50dB Night and Nabove 65dB Day/55dB Night... 75
Table 22: Contour Area and Population Exposure for 33L Peak Day Scenario by Contour Level, Nabove 60dB Day/50dB Night and Nabove 65dB Day/55dB Night... 75
List of Equations
Equation 1: Equation 2: Equation 3: Equation 4: Equation 5: Formula for Formula for Formula for Formula for Formula for LA,max. Source: HMMH [7] ... 21SEL. Source: Trani [8]... 22
N above ... 22
DNL. Source: HMMH [7]... 23
Introduction
1.1
Motivation
The rollout of Performance-Based Navigation (PBN) procedures as part of the FAA's NextGen program paves the way for improvements in safety and efficiency within the U.S. National Airspace [1]. As PBN-based arrival and departure procedures have been implemented at airports around the country, however, changes in noise patterns for the areas surrounding these airports have led to increases in community opposition to the use of these new procedures. In some places, new procedures have been rolled back due to this organized community opposition to aviation procedural changes.
One area of particularly strong interest and a focus of community activism against implementation of PBN procedures at airports across the nation relates to changes in the dispersion of aircraft flying published procedures - as PBN procedures are implemented the degree of accuracy to which aircraft follow required lateral paths increases substantially. This leads to a concentration of aircraft lateral trajectories flying PBN procedures compared to those flying non-PBN procedures, an effect that can be seen in Figure 1.
5nuary .10, 15. 2O15Fg t Tracks
January 17, 22. & 27, 2013 IG Tracks on
Pre RNAV
?ost RNAV
Figure 1: Changes in Flight Track Dispersion Due to Implementation of RNAV PBN Procedure for Runway 33L Departures at BOS. Source: Massport [2]
While analysis of noise impacts is required as part of the process for approval for new approach or departure procedures, the level of community opposition to the rollout of these procedures despite this analysis indicates that limitations exist in this analysis process. This can be seen in Figure 2. In this figure, the base map shows the location of noise complainants between August 2015 and July 2016 at Boston Logan International Airport (BOS) on top of ASDE-X departure flight tracks for 12 days in 2015-16. The overlay shows the official noise exposure contours for BOS in 2015, with the purple contour corresponding to the 65dB DNL level of noise considered significant according to U.S. federal regulation. The fact that such a substantial fraction of complainants occur outside this 65dB DNL contour considered the significant aviation noise exposure level underscores the need for more careful examination of the methods used to evaluate noise impact. The left-hand map of Figure 3 shows the same complainant locations and flight tracks as Figure 2, and the right-hand map of Figure 3 shows the same complainant locations on top of ASDE-X arrival flight tracks from the same 12 days in 2015-16.
These maps show that the locations of complaints tend to be tied to particular streams of departure or arrival flights, as most of the clusters of complaint locations are near either a large number of departure flight tracks or near a large number of arrival flight tracks.
- * %
Eac Marker Reprent On ddress
Figure 2: 2015 Departure Flight Tracks at BOS, with Complaint Locations and Official Annual Average DNL Contours; Regulatory Significant Exposure Contour of
65dB DNL is Purple. Overlay Source: Massport [3]. Complainant Map Source: Hansman [2]
Departures Arrivals
~y
EaCh MRnpusets One Add s
EA rN
Ewm* Mkr Reprmms One Addam
Figure 3: 2015 Arrival (left) and Departure (right) Flight Tracks at BOS, with Complaint Locations in Red. Source: Hansman [2]
17 A
1.2
Research Objective and Scope
This research seeks to examine a series of noise impact analysis methods in the context of community resident reactions to noise and to examine their effectiveness in identifying hotspots of annoyance. A series of representative scenarios at Boston Logan International Airport (BOS) based on actual flight tracks and schedule data will be modeled using a combination of tools developed at MIT and industry-standard noise analysis methods. Three scenarios will be examined: an annual average day, a representative day of heavy usage of a single runway for departures (runway 33L), and a day reflecting the peak hour of departure operations on this 33L peak day. Scenarios representative of actual daily usage of particular runways are examined in addition to the annual average day typically utilized for noise impacts analysis since complaint locations are often associated with utilization of specific runways for departures or arrivals. Noise impact results will then be compared to the locations of complaints regarding noise at BOS using a series of noise metrics, and results will be evaluated based on the degree to which the quantified noise exposure captures these complaint locations. The complaint data used is from a 12-month period similar to that from which the flight tracks and scenario schedules are drawn. Complaint locations are used as they represent the best available data for measuring annoyance and also likely capture the level of activism and opposition of citizens in different areas. If a goal is to understand or predict the level of community activism that prevents PBN-enabled benefits from being rolled out at an airport, complaint locations are likely to be a useful basis for the evaluation of noise impacts.1
Annual average noise exposure results will also be compared to official annual average noise exposure results to provide context for the modeled results. Observations will then be made regarding the degree to which each of these representative scenarios captures complaint locations, and regarding the degree to which noise exposure captures complaint locations when measured using two different metrics.
1 It is critical to acknowledge that while complaints likely identify hotspots of active opposition to airport procedural changes, they may not accurately capture all areas that experience adverse impacts from noise exposure, including any potential health impacts.
Chapter 2
Background
2.1
Sound and Loudness
Humans perceive fluctuations in atmospheric pressure as sound, and noise is unwanted sound [4]. The perceived loudness of a sound is related to the amplitude of these fluctuations as well as the frequency [4]. There is a specific range of frequencies audible to humans, and this narrows somewhat with age [4]. Since humans are annoyed to different extents by sound from similar amplitudes of different frequency fluctuations, various frequency-weighting scales have been developed to capture the annoyance experienced by humans as a response to different spectral compositions of sound [4]. These, along with the metrics used to capture the sound "experience" of an event, will be discussed further in the following sections. The relative sound levels of a variety of specific noise sources using a common frequency-weighting scheme are shown in Figure 4.
Typical Sound Levels (dBA)
140 - Threshold of Pain
130 -Jet Takinq Off (200 ft. away) 120 - Operating Heavq Equipment
110 - Niqht Club (w/ music)
100 - Construction Site 90 - Boiler Room 80 - Frglqht Train (100 ft. awjat) 70 - Classroom Chatter 60 - Conversation (3 ft. awat4) 50 - Urban Residence
40 - Soft Whisper (5 ft. awa.)
30 - North Rim of Grand Conpon 20 - Silent Studtk Room
10
0 - Threshold of Hearinq (1000 Hz)
Figure 4: Common Sounds on an Instantaneous A-Weighted
[5]
2.2
Introduction to Aviation Noise Analysis
As explained in Section 2.1, the loudness of a noise depends on the frequency and amplitude composition of a sound. To allow for comparison of noise between sounds with different frequency compositions, different frequency-weighting schemes have been developed. Three of these are sufficiently well recognized in the context of aviation noise analysis to have been included in common aviation noise analysis tools. These three types of sound spectral weighting are A-weighting, C-weighting, and tone-corrected perceived noise [6]. A-weighting is designed to reflect people's perceptions of the loudness of events, C-weighting is designed to do something similar but focuses on distinctions among already loud events (above 90 decibels (dB)), and tone-corrected perceived noise aims to capture the loudness of events with aircraft-like spectral compositions [6]. A-weighted metrics are the most commonly used, however, and as will be discussed in Section 2.3, they are the basis for much of the noise-related aviation regulation in the United States. For this reason, metrics based on an A-weighted frequency spectrum will be the only ones discussed in this thesis.
Aviation noise metrics fall into a few categories, two of which will be explored in this thesis: exposure-based metrics and maximum sound level metrics [6]. Exposure-based metrics aim to capture a combination of the duration and peaks of noise events, while maximum sound level metrics focus on the magnitude of the peaks of events. Most quantitative impact results derived from these metrics are expressed on the logarithmic decibel (dB) scale, where an increase of roughly 3dB corresponds to a doubling in the intensity of a sound [4].
The noise impact of aviation activity around an airport is ultimately driven by the noise impact of each discrete aviation event. Section 2.2.1 will provide an overview of some commonly used metrics for measuring the impact of individual flight operations (single event noise metrics) and Section 2.2.2 will introduce multiple event impact metrics derived from these single event impact metrics.
2.2.1 Single Event Aviation Noise Metrics
2.2.].] Maximum Sound Level Metric: LAmax
The A-weighted maximum sound level noise metric is known as LA,max (or
LAMAX) and is simply the maximum instantaneous A-weighted sound level at a given observer location [6]. A mathematical representation for LA,max at an observer location is
given in Equation 1, where L(t) is the sound pressure level over time and T is the end of the aviation overflight of interest.
Equation 1: Formula for LA,max- Source: HMMH [71
LA,max = max(L(t)), t E [0, T]
2.2.1.2 Exposure-Based Metric: SEL
The A-weighted single event exposure-based noise metric is called Sound Exposure Level, or SEL [6]. The goal of SEL is to quantify the overall noisiness of an overflight by combining both the duration and peak sound levels of the event. This is accomplished by integrating the portions of the sound pressure level (SPL) time trace of an aviation overflight within 10dB of LA,max2 and normalizing the integral by a fixed time
period (usually one second) [8] [7]. A graphical depiction of SEL computation is shown in Figure 5 from Trani [8], where the orange shaded region represents the region that is integrated to generate SEL. The formula used to calculate SEL follows in Equation 2, where L(t) is the SPL over time, ti and t2 bound the region where sound is within 10dB of
the peak, and to is the reference time over which the integral is normalized.3
2 This implies that for SEL to be defined for an overflight, LA,max must be at least 10dB
higher than whatever SPL is considered the floor. If this were not the case, SEL would be infinite.
3 As will be discussed in Section 2.3.2, however, the standard method used for calculation of SEL in aviation industry noise analysis is not directly from a time history of sound pressure level.
90
L A m ax
...
...
... ... ...
LAm
x-10
db
-~75
7 A319 landing event in
recorded at PUJ in 2012 65 -60, A
tI
t2
5 10 15 20 25 30 Time (s)Figure 5: SEL Calculation for a Single Flyover Event. Source: Trani [81 Equation 2: Formula for SEL. Source: Trani [81
1 t2 L(t)
SEL = 10 * 1og 10 - 10 10 dt
2.2.2 Multiple Event Aviation Noise Metrics
2.2.2.1 Maximum Sound Level Metric: Nbove
A maximum sound level noise metric often used in aviation noise analysis is the number of flights above a threshold LA,max, called Nabove. Since Nabove essentially just counts the number of individual events with noise above a selected threshold at a given observer location, it is very simple to compute and to understand. A mathematical
representation for Nabove at a given observer location is given in Equation 3. Nabove is
commonly calculated on the basis of total overflights during a 24-hour period.
Equation 3: Formula for Nabove
nday nnight
Nabove = Xi,ay + Xi,night
1=1 i=1
Xi,day = 1 if LA,max > thresholdday, Xi,day = 0 otherwise
It is often useful to think about Nabove in terms of the average time between overflights during the interval of interest. The relationship between the average time between overflights and daily Nabove is shown in Figure 6.
60 50 40 0 E 20 10 0 0 100 200 300 400 500
Number of Flights Above Threshold Per Day (Nabve)
Figure 6: Relationship Between Average Time Between Overflights and Daily Nabo,,
2.2.2.2 Exposure-Based Metric: DNL
The multiple event exposure-based metric most commonly used in aviation noise analysis is called the Day-Night Level (DNL). DNL is a logarithmic summation of noise exposure from individual noise events quantified using SEL. DNL takes the SEL values for a series of individual events at an observer location and logarithmically adds and averages these values over a 24-hour period, applying a noise penalty to night operations (which are defined as those occurring between 10pm and 7am local time) [6] [7]. This 10dB penalty is captured by applying by a weighting factor of 10dB to the SEL for each nighttime operation [6] [7]. Computation of DNL from SEL is shown in Equation 4, where the time constant T refers to the overall analysis time scale. For typical analysis using DNL, T = 24 hours = 86,400 seconds.
Equation 4: Formula for DNL. Source: HMMH [7]
1 d1ygSELi,day +ngtSELixnight+10
DNL = 10 * loglo - 0 U 10 10
In practice, the analysis period T is often removed from the inside of the logarithm and added to the un-weighted logarithmically added SEL. This equation, which is mathematically equivalent to Equation 4, is shown in Equation 5.
Equation 5: Formula for DNL with Separated Time Constant. Source: HMMH [7]
/rnday unight
SELi,day S _ELi _ight+104
DNL = 10 * log o 10 10 + 10 10 ]- 10 * loglo(T)4
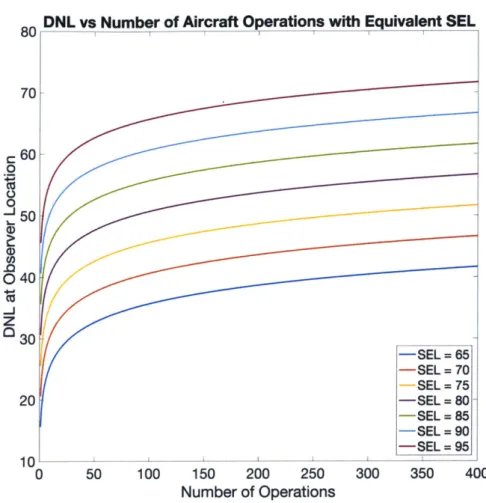
As a result of the logarithmic addition of SEL that forms the basis for DNL, the contribution to DNL of an additional overflight decreases with the total number of overflights. This can be seen in Figure 7, where each curve shows the DNL from a given number of operations at the same SEL. This shows that as the number of operations with equivalent SEL increases, each additional operation increases DNL by a smaller and smaller amount.
4 AEDT, which will be introduced later in Section 2.3.2, uses a rounded value for the separated time constant of 49.37 [6]. The toolset used for analysis in this thesis, however, does not round the time constant and uses 10 * logio(86,400) in each calculation. This has been seen to lead to a small difference in DNL values computed using the thesis analysis toolset and those calculated directly in AEDT.
80 70 C 0 0 a 60 50 40 30 20
DNL vs Number of Aircraft Operations with Equivalent SEL
-SEL = 65 -SEL = 70 -SEL = 75 -SEL = 80 -SEL = 85 -SEL = 90 -SEL = 95 10 1 0 50 100 150 200 250 300 350 400 Number of Operations
Figure 7: DNL vs. Number of Operations for Different SEL Values
In practice, DNL is often evaluated on an annualized basis. Since DNL typically requires analysis on a 24-hour time scale, this is accomplished by averaging total daily operations over the course of a year to obtain an annual average day of operations. While this allows for analysis using the standard DNL metric, the annual average day for which DNL is calculated does not actually represent a real day of operations but rather a fictitious day designed to reflect operational patterns on an annual basis. Since airports often utilize runways unequally on a day-to-day basis, as was explained in Chapter 1, this annual average day may therefore not effectively capture noise patterns actually experienced by communities on a typical day of operations over their neighborhood.
2.2.2.3 DNL and Nabove in the Context ofAnnoyance
Communities often cite the repetitiveness of overflight noise, particularly with specific runway configurations, as a key factor in noise-related annoyance, particularly
for certain operational changes like the concentration of flight tracks on certain newer types of flight procedures [9]. Since Nabove is directly related to the average frequency of
overflights while DNL is not, Nabove may better represent these operational changes in a manner consistent with the mechanisms through which communities are impacted by the noise from overflights.
2.3
U.S. Federal Airport Noise Regulation and Reporting
U.S. regulations governing aviation can be found in Title 14 of the Code of
Federal Regulations (14 CFR). These regulations include rules that require assessment of noise impacts as a part of airport planning, which are enumerated in 14 CFR Part 150
[10] [11].
2.3.1 Use of DNL
In 14 CFR Part 150, DNL is identified as the primary metric for consistent noise exposure analysis for U.S. federal regulatory purposes [10]. In this Part, the lowest DNL threshold relevant for noise abatement or compatibility planning is 65dB DNL [10]. The study often cited as the basis for the 65dB significant noise threshold is discussed in Section 2.4 [12]. The continued validity of this metric and threshold as the basis for federally-mandated noise abatement is a topic of current and active discussion [12].
The U.S. National Environmental Policy Act (NEPA) provides additional guidance for aviation noise regulatory analysis using DNL. While 65dB DNL is considered the threshold for significant noise exposure by the FAA, NEPA analysis can require analysis at noise levels down to 45dB DNL [13]. This analysis creates no restrictions on implementation of procedures as the result of changes in population exposure at levels below 65dB DNL, however, as this analysis is required only for reporting purposes [13]. NEPA requires that changes only be reported if the change in noise exposure is greater than a certain threshold, which changes depending on the baseline noise level impacted [13]. A change must be greater than 5dB to need reporting between a 45dB and 60dB DNL baseline and greater than 3dB between 60dB and 65dB
2.3.2 Federally-Mandated Aviation Noise Analysis Tool: AEDT
14 CFR Part 150 also identifies a specific noise-modeling tool for use when conducting all analysis required by regulation. This was originally the Integrated Noise Model (INM), although INM has since been replaced by a successor, the FAA's Aviation Environmental Design Tool (AEDT) [6].
AEDT contains modules for analyzing aviation noise, fuel bum, and emissions at both the single flight and multi-flight levels [6]. The noise analysis module of AEDT leverages data from the AEDT fleet database, which includes data from the ICAO Aircraft Noise and Performance Database (ANP) and the Eurocontrol Base of Aircraft Data (BADA), to model aircraft performance in different phases of flight and to calculate noise [6]. AEDT noise calculations are based on data contained in noise-power-distance (NPD) curves, which provide noise levels in dB measured at different distances from a specific aircraft for different thrust settings and operational modes [6]. The operational modes include approach, departure, and level flight, to account for the fact that different sources of noise dominate in different phases of flight [6]. The NPD database directly includes curves for both SEL and LA,max5 and the methods in AEDT correct these curves
for deviations due to factors including atmospheric attenuation, duration of exposure (for SEL only), and reflectivity off the ground [6]. As mentioned previously in Section 2.2.1, this means that SEL and LA,max are not computed directly from physics-based analysis of sound pressure level over time but rather from empirically-derived aircraft type-specific reference data sets for each metric.
2.4
Past Studies of Aviation Noise and Annoyance
Studies have been conducted over the years looking at human responses to aviation noise. One of these studies, by Schultz published in 1978 [14], is often cited in the context of describing the history of the use of DNL for regulatory purposes in the
5 LA,max NPD data does not exist in AEDT for all aircraft. AEDT uses an empirical
equation derived from aircraft with complete NPD data sets to calculate the equivalent
LA,max NPD values from the SEL NPD data [6] but still does not necessarily equate them
United States [12] The key element of the paper often used is a curve developed by Schultz based on data from a number of prior studies of noise and annoyance. This curve associates a percentage of respondents from each survey considered highly annoyed with the DNL levels at which they were exposed to the noise [14]. A version of this curve that also includes some more recent data points is shown in Figure 8.
100%_ . 1963 -1976 . 90%-+ 1981 -2002 80% - -Schultz . 70% * C# C 60%,
6
50% *. " 0 40% :78 30% -. * 20% * IL 10%_ 0% +* We-40 50 60 70 80 90Day-Night average sound level (dB)
Source: L&B, 2010
Figure 8: Percent of People Highly Annoyed by DNL. Source: HMMH [12]
Schultz found that a correlation existed between the median level of annoyance in an area and the noise level of that area, but no correlation between individual responses and noise level [14]. Interestingly, although Schultz's paper is often cited as part of the justification for the use of DNL as a regulatory metric [12], Schultz actually states in his paper that audibility of a noise event is probably more closely related to peak sound than time-averaged sound like DNL and that occurrences of individual noisy events are also likely important in understanding annoyance due to noise [14].
A more recent study published in 2014 looking at the impacts of aviation noise in terms of both annoyance and sleep disturbance found little correlation between
cumulative exposure metrics like DNL and levels of sleep disturbance [15], supporting Schultz's conclusion regarding maximum sound levels, DNL, and annoyance.
Chapter 3
Overview of Case Studies
This thesis seeks to explore in a systematic manner the effectiveness with which different representative scenarios and noise metrics capture patterns of noise-related annoyance and potential community opposition to airport policy and procedure modifications. In order to do this, three different representative days of operations will be modeled. These three scenarios evaluated will be an annual average day, a representative day of heavy use of a specific departure runway, and a day representative of the hour of peak departures during this day. This modeled noise will then be compared with the number of noise complaint locations from a similar time period exposed to different levels of noise during a similar time period to assess the effectiveness by which analysis using each of these representative scenarios captures annoyance patterns.
As was introduced in Section 2.2.2.2, annual average day noise analysis is often used for understanding the aggregate impacts of airport operations on local communities. This annual average day, however, is fictitious as it reflects a full year of operations condensed to a daily timescale for noise impact analysis rather than representing an actual day of operations. This is due to the fact that airports often use particular runways and combinations of runways (called a runway configuration) unequally on a day-to-day basis based on wind direction or other operational or environmental factors [16]. Therefore, if a particular runway configuration is utilized for an extended period of time, the noise in particular locations during this time may differ substantially from that of the annual average day. This means that while the annual average day may reflect the time-averaged noise impacts on communities over the course of a year, it does not necessarily reflect the overflight patterns experienced by communities during the periods when they are impacted by noise. In other words, the annual average day averages out periods of heavy usage of particular runways with periods during which those runways are not used at all and will often show only moderate average noise impacts due to operations from that runway configuration. In some situations, even daily operations on a day of heavy usage of a single set of runways may not capture annoyance during the periods of peak operations during the day. Understanding the magnitude of these dilution effects is the primary motivation for comparing a day and hour of heavy usage of a particular runway
with an average annual day scenario. It is important to note that since these scenarios each specify a different total number of operations, the results will reflect both these different total numbers of operations and changing modeled runway use.
The airport used for these case studies will be Boston Logan International Airport (BOS). BOS was chosen as the airport of study due to the availability of both individual flight data and complaint data through ongoing work assessing noise impacts and potential mitigations at Boston Logan International Airport (BOS) in collaboration with Massport.6 This complaint data, including a location for each complaint, comes from the
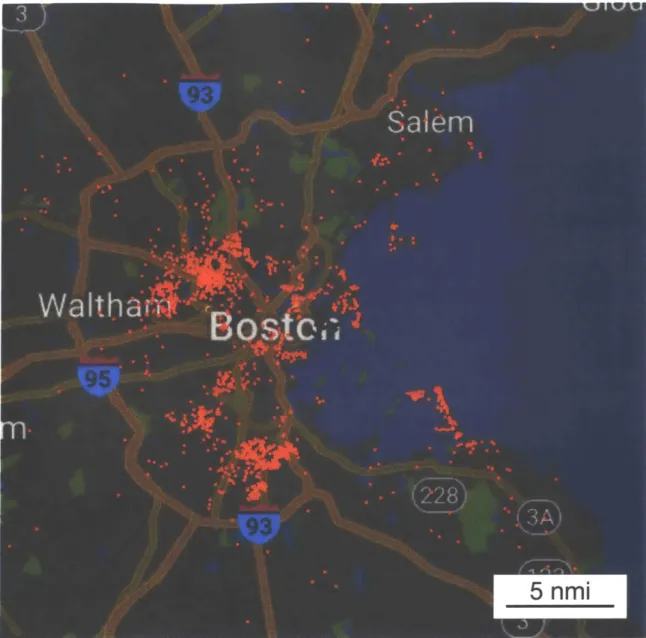
records of calls made to the Massport noise complaint line and a web-based noise complaint form [17]. Given the available periods of complaint data and flight data, the case studies all use complaint data from August 2015-July 2016 and flight data from time periods in 2015 and 2016. This complaint data includes a total of 28,204 recorded complaints from 1,994 unique addresses. A map showing the locations of these noise complaints is given in Figure 9.
Figure 9: Locations of Noise Complaints at BOS, August 2015 - July 2016
Both DNL and Nabove will be examined for each of these scenarios at a variety of
noise levels. The effectiveness by which either multiple event noise metric captures annoyance as measured by number of people submitting complaints (number of complainants) will be measured using the methods outlined in Section 3.5. Details on the methods used for calculating the DNL and Nabove noise impacts of each scenario can be found in Chapter 4.
For each case study, noise data is generated using a fleet of representative aircraft flying representative lateral tracks using case study-specific flight schedules. The
schedules for each case study are presented as part of the case study descriptions in Sections 3.1-3.3. To develop these schedules, analysis of flight records was conducted using a data set from the BOS-specific Noise and Operations Monitoring System (NOMS), which includes aircraft type, date, time of day, and runway used for each individual flight in 2015. Each of these schedules assigns flights to a particular runway, representative aircraft type, and time of day based on flight data for the time period of analysis for a scenario. Multiple aircraft types with similar characteristics are grouped into representative type bins, and all flights operated by aircraft in a particular bin are assigned to their representative aircraft type to develop the schedule for each scenario. The representative aircraft types used in this analysis are: the Boeing 777-300 (B773), the Airbus A320-212 (A320), the Boeing 737-800 (B738), the Boeing 757-200 (B752), the McDonnell Douglas MD-88 (MD88), the Embraer 170LR (E170), and the Embraer E-145LR (E145). Further discussion of the selection of these representative types and the aircraft binning process can be found in Section 4.2.
3.1
Scenario 1: Annual Average Day
The first case study analysis will look at an overall average annual 2015 day at BOS. This analysis defines a representative single day by dividing total annual 2015 operations by 365 to generate a schedule representative of total annual operations that is on the 24-hour timescale appropriate for DNL analysis.
To develop the schedule for this case study, all flights in 2015 were grouped by type bin, runway used, operation type (arrival or departure), and time of day (day or night). The resulting allocation of departures by day and night is shown in Table 1 and Table 2, respectively, and the allocation of arrivals by day and night is shown in Table 3 and Table 4, respectively. Any operations assigned to runways with no assigned tracks for that operation type are excluded from analysis; however, this only occurs for a very small number of operations and is expected to have had a negligible impact on results.
-- I
Table 1: Annual Average Day Departures Per Runway by Aircraft Type Bin -Day
2.37 3.35 2.75 0.54 0.35 1.68 0.64 1.89 5.52 6.35 0.84 0.31 1.09 1.54 1.82 28.15 18.02 4.46 6.59 37.02 5.95 16.72 3.05 16.68 11.65 2.63 2.66 14.29 9.80 1.53 3.19 3.43 0.25 0.07 0.10 0.06 3.38 31.64 21.42 5.17 6.65 37.26 22,72 0.47 11.38 6.65 1.48 3.00 14.65 5.47
Table 2: Annual Average Day Departures Per Runway by Aircraft Type Bin - Night
2.35 2.90 3.35 0.45 0.53 1.37 0.69 0.44 0.55 0.83 0.13 0.09 0.23 0.10 0.73 2.56 2.16 0.51 0.85 3.11 0.21 0.49 l.20 2.07 2.00 0.44 0.70 0.96 0.78 00' 0.24 0.41 0.06 0.02 0.02 0.02 -1 1 3.61 3.25 0.86 1.31 4.01 1.03
0
2.68 2.58 0.41 0.59 3.25 0.33Table 3: Annual Average Day Arrivals Per Runway by Aircraft Type Bin -Day
FRepresentative1R 4 4 9 4 1L33 22 22 27 23R Aircraft Type B773 9 8.10 Q.06 057 6.07 S 1.22 28.48 3.29 12.06 21.45 0.02 22.20 0.85 21.62 1.67 7113 11.32 0.0-1 200 _ 0.24 5.37 0.22 1.62 3.18 4.02 0.28 6.39 0.73 3.01 3.60 6.08 1.52 32.61 6.46 16.24 24.24 0.04 27.05 2.67 0.01 0.75 10.94 12.51 7.94 16.85 0.53 10.33 4.34 0.14 35
Table 4: Annual Average Day Arrivals Per Runway by Aircraft Type Bin -Night ir r s nta t p e 1 54L4 132R 72 3 0.02 0.48 0.68 0.79 0.08 0.58 5.26 0.06 7.81 9.93 3.35 0.48 4.21 0.03 7.85 7.85 2.77 0.08 0.67 0.01 1.14 1.29 0.43 0.07 0.90 0.01 1.57 1.31 0.48 0.33 2.48 0.06 2.36 4.48 1.89 0.08 0.80 0.08 1.11 1.42 0.45 0.01 0.01
3.2
Scenario 2: 33L Peak Day
The second case study will model operations for the specific day in 2015 with the highest number of departures from runway 33L, which was July 22, 2015. On this day, a total of 77% of departure operations used this runway. In this situation, the people under the flight tracks from this heavily utilized runway will be subjected to a larger number of operations and likely exposed to higher noise levels than are reflected in the annual average day of Scenario 1. This scenario attempts to demonstrate the effects of the dilution of specific runway usage patterns in the annual average day analysis relative to the actual noise impacts seen on a day-to-day basis. A diagram of the layout of the airport at BOS highlighting the location and direction of runway 33L departures is shown in Figure 10.
17117
AIRPORT DIAGRAM GENERAL EDWARD LAWRENCE LOGAN INTL (BOS)AL-58 (FAA) BOSTON, MASSACHUSETTS
US--B TERMINALL ERNAL -B ~ EMAS a, ELEV GENERAL 15 AVIATIO :.-EELEV i INSET *14 * 09 HS MAIN FIE OS J PAD IPARKING) E ELEVIII70 5 16 (91 .5*-- LAHSO ALL AIC AT A A PH) HS4A S -. ELEV 7101'W 19... 0-AIS 135.0 BOSTON TOWER 1 28.8 257.8 1etass 24.725 GND CON 121.9 CINC DEL. 121.65 257.8 CPDLC 1111 --- ' 42*23'N I I I CAUTION: BE ALERT TO RUNWAY CROSSING CLEARANCES. READBACK
Of ALL RUNWAY HOLDING INSTRUCTIONS IS REQUIRED.
-ELEV
JANUARY 2015 ANNUAL RATE OF CHANGE
0.1* E - STATION
)epartures
ELEV 15 LAHSO 7.* E LEV 16 EMAS _FIELD 70' RWY OL-22R, 04R-22L, 09-27, 15L-33R, 15R-33L PCN 90 F/C/WIT E19,ES-1 20, D-250, 2S-175, 2D-550 ASDE-X in use. Operate transponders RWY 14-32 with altitude reporting mode and ADS-B
s-i 2, 2 2-175, 20-490 if equipped) enabled on all airport surfaces.
AIRPORT DIAGRAM 17117
BOSTON, MASSACHUSETTS GENERAL EDWARD LAWRENCE LOGAN INTL (BOS)
Figure 10: FAA Airport Diagram for BOS with Annotation For Runway 33L Departures. Airport Diagram Source: FAA [18]
Runway 33L was selected as the focal point for this analysis for two primary reasons. First, there is a clear subset of noise complaints surrounding these flight tracks, which allows for evaluation of noise impact metrics using a set of complaints filtered to be attributable to the specific operational scenario analyzed. These noise complaints, along with a large number of departure tracks from BOS, are shown in Figure 11. Second, since communities under this flight path experienced a clear change in flight track concentration with the implementation of PBN procedures (Figure 1) this particular flight
z --? -4 W N o 04 W CL c1j I W Z
track is of interest in understanding the noise impact of the concentration of flight tracks on PBN procedures.
33L
Departurf
a3i
Dea
ures
Complaints
Each Marker Represeris One Address
Figure 11: BOS Runway 33L Departures and Complaints. Source: Hansman [2]
Since this case study models a high percentage of flights departing from runway 33L, the noise impacts of this case study will be evaluated against only complaints likely to be related to runway 33L departures. For this filtering of complainant data, relevant complainant locations were considered to be those located in the northwest quadrant from the airport. These complainants are highlighted in Figure 12. The use of this criterion is justified by the fact that the portions of the tracks from this runway likely to contribute to noise exposure fall in this quadrant and the majority of complainants surrounding these tracks lie in this quadrant.
Figure 12: Northwest Quadrant Complainants at BOS, August 2015 - July 2016
To develop the schedule for this case study, all flights on July 22, 2015 were grouped by type bin, runway used, operation type (arrival or departure), and time of day (day or night). Flight allocation for this analysis is shown for departures by day and night in Table 5 and Table 6, respectively, and for arrivals by day and night in Table 7 and Table 8, respectively. These show almost all departures from runways 33L and 27 and almost all arrivals to runways 33L, 27, and 32 on that date, which is consistent with one of the primary runway configurations at BOS [16]. It is important to note that this peak day schedule has 18% more total operations and 27% more nighttime operations than the
-j
annual average day scenario (1072 vs. 908 total and 174 vs. 137 nighttime), which contributes to overall higher relative noise exposure from this scenario.
Table 5: 33L Peak Day Departures Per Runway by Aircraft Type Bin -Day
e;1 w 15 87 77 11 20 104 66 6 1 19 14 4 6 21 9
Table 6: 33L Peak Day Departures Per Runway by Aircraft Type Bin -Night Representative12 Aircraft Type;WW M MW M B77 12 6 5 2 2 1 3 1 9 12 2 3 14 1
Table 7: 33L Peak Day Arrivals Per Runway by Aircraft Type Bin -Day
Representative1R 4 4 941L33 22 22 27233 Aircraft Type
-
15 11-
12 79-
10 69 B2 2 11 - 8 3 21-
17 91 20 15 12 49 1Table 8: 33L Peak Day Arrivals Per Runway by Aircraft Type Bin -Night Representative15 4 4 9 4 1L 33 22 2R 27 23R -Aircraft Type B773 2 ~ i 1
-
22 14-
18 14 B752 2 - 8 5 3-
7 6 E4 6 13.3
Scenario 3: 33L Peak Hour
The final operational scenario analysis will look at the peak hour of departures on the 33L peak day. For this peak hour analysis, the number of operations during the hour will be scaled up to a full day of operations, with each hour of the day assigned the number of operations during the peak hour, so that all quantitative results are directly comparable to the results from the annual average day and peak day analyses. This scenario attempts to provide a further demonstration of the dilution in noise impact that arises from looking at noise impacts over larger time scales. This scenario will also use the filtered complainant data set described for the 33L peak day scenario.
Additional data sources were required to develop the schedule for this scenario, as exact time of departure or arrival was not available in the NOMS data. The FAA's public Aviation System Performance Metrics (ASPM) system [19] was used to fill this gap and obtain the number of operations per hour for the day of interest. According to the ASPM daily report for BOS operations on July 22, 2015, the peak hour of departures was during the daytime hour from 5pm-6pm, with a total of 31 arrivals and 48 departures during that period. Based on the NOMS data, there were a total of 438 daytime arrivals and 460 daytime departures on that date in the non-excluded bins; the ASPM hourly operations report includes 443 daytime arrivals and 493 daytime departures on that date. Since the total number of operations counted by the two data sources were not identical, the total number of hourly operations used in this analysis are a fraction of total NOMS daytime
-I
operations equivalent to the fraction of total ASPM daytime operations. Applying this correction yields a final number of roughly 30.65 arrivals and 44.79 departures during the peak departure hour.
To calculate results on the same time scale basis as used for the annual average and 33L peak day scenarios these hourly operations were then scaled to a full 24-hour day. The schedule for this 33L peak hour analysis maintains the same distribution of flights amongst runways and representative aircraft bins from the 33L peak day daytime arrivals and departures for each of these 24 hours. 15 hours' worth of flights are assigned as daytime flights (7am-10pm) and the remaining 9 hours of flights are assigned as nighttime flights. It is important to note that this peak hour schedule has approximately twice as many total operations and five times as many nighttime operations compared to the annual average day scenario (1810 vs. 908 total and 679 vs. 137 nighttime). This contributes to substantially higher overall noise exposure from this scenario.
Table 9: 33L Peak Hour Departures Per Runway by Aircraft Type Bin -Day
Representative1R 4 4 9 41L 3L 22 22 27 23R Aircraft Type B7321.91 1.46 1W7
-2127.06
27.75-3112.45
20.45-216.06
5.84-D829.21
8.76-7151.89
30.67 8.76 96.39 13.14Table 10: 33L Peak Hour Departures Per Runway by Aircraft Type Bin -Night B77313.14 0.88 A3076.24 16.65 NO '
-
67.47 12.27-
9.64 3.51 - 8 17.53 5.26-
91.13 18.40 5.26 57.83 7.89Table 11: 33L Peak Hour Arrivals Per Runway by Aircraft Type Bin - Day
Representative 15 4 4 91 5 3 2 2 7 3 3 Aircraft Type W M M O MM B7315.74 OI 11.55 m12.60 82.92
-
10.50 72.43-
2.10 11.55 3.15 22.04-
17.84 95.52 20.99 15.74 12.60 51.43 105Table 12: 33L Peak Hour Arrivals Per Runway by Aircraft Type Bin -Night
Representative1R 4 4 91 1L 33 22 22 27 2 33 Aircraft Type
-
7.56 49.75-
6.30 43.46-
1.26 6.93 MD881.89 13.23-
10.71 57.31 12.60 9.45 7.56 30.86 0.633.4
Quantification of Scenario Noise Impact: DNL and
NaboveUsing methodology outlined in Chapter 4, DNL and Nabove impacts results will be calculated for each scenario. These noise impact results will be examined over a wide range of DNL levels and Nabove noise level and overflight count thresholds.
The DNL thresholds were selected based on the levels referenced in U.S. regulatory noise policy. As the lowest level discussed for which an increase in noise might be considered significant is 45dB (see Section 2.3.1) and the level at which baseline noise exposure is considered significant is 65dB, DNL contours will be examined from 45dB to 65dB in 5dB increments.
Nabove LA,max thresholds will be examined from 55dB to 70dB for daytime flights,
again in 5dB increments, to cover noise levels above that roughly comparable to average conversation (see Figure 4) through those included in previous analyses [13]. The threshold for nighttime flights will be 10dB lower than the corresponding daytime threshold. For each of these LA,max thresholds, contours will be examined for 25, 50, 100, 250, and 500 number of overflights with LA,max above the threshold. 25 overflights
correspond to an average of roughly 1 flight per hour, 50 overflights correspond to roughly 1 flight every half hour, 100 overflights correspond to roughly 1 flight every quarter hour, 250 overflights correspond to roughly 1 flight every 6 minutes, and 500 overflights correspond to roughly 1 flight every 3 minutes.
3.5
Evaluation of the Effectiveness of Noise Impact Metrics with
Respect to Complainant Location
DNL and Nabove results are calculated as exposure levels over a grid of observer
locations. Using the grid points exposed at different noise and overflight levels, contours can then be defined surrounding regions of exposure at specific levels7. The quantitative comparisons presented in Chapter 6 use a series of metrics defined based on the shape
7 These contours are defined as polygons. Contour area and coverage comparisons were
and coverage of each of these contours. These are: contour area, population exposure, and percent of complainants contained within the contour.
Metrics related to both contour area and population exposure are included in the results for completeness, as contour area is more generalizable to airports with different surrounding population patterns. However, results will also include population exposure and complainant address coverage metrics as this particular analysis is specific to BOS and the fact that a substantial portion of the area surrounding BOS is covered by water gives the location distinctive population characteristics. The methodology used to calculate the results for population exposure and complainant coverage are outlined in the following subsections.
3.5.1 Calculation of Population Exposure
A grid of population densities was generated for the regions surrounding a number of U.S. airports, including BOS.8 These were generated from 2010 census data, which was re-gridded into 0.1nmi square segments. The population from each of these grid squares was then associated with the centroid of that grid square, generating a 0.1nmi-spaced grid of population counts. The populations located at points within a contour are considered exposed to that contour.
3.5.2 Calculation of Complainant Coverage
Noise complaint records from BOS for the 12-month period from August 2015-July 2016 were used for this analysis. This complaint data, including a street address for each complaint, originates from the records of calls made to the Massport noise complaint line and a web-based noise complaint form [17] and includes a total of 28,204 recorded complaints from 1,994 unique addresses. A map showing the locations of these noise complaints is given in Figure 9.
Individual complainants were identified from this data by their unique addresses, and these addresses were converted to latitude and longitude coordinates (geocoded)
8 These population grids were created as part of prior work by Luke Jensen and used for
using Google's geocoding API [20]. All but six complainant addresses were automatically geocoded using the address information provided by complainants. Of the remainder, all but one were able to be associated with a valid address manually and geocoded using the Google API. The final address is excluded from analysis, resulting in 1,993 successfully geocoded addresses. All complainant addresses outside a 58nmi-bounding box surrounding the airport were excluded.9 Slightly over 1% of valid complainants fall outside this box, resulting in a total of 1,970 complainants used as the basis for computation of percentage of complainants contained within a contour. For the analyses in Scenarios 2 and 3 requiring filtering of complainant data for complaints related to 33L departures, 832 of these filtered complainants lie in the northwest quadrant and are used as the basis for calculating percentage of complainants contained in the contours for-these scenarios.
Each remaining complainant location included within a contour was considered contained by that contour. The percentage of complainants covered by a contour was then calculated using the number of complainants contained by the contour and the total number of complainants included for the scenario.
Chapter 4
Noise Modeling Methodology
This thesis uses tools developed by a team at MIT, including the author and others, to generate quantitative noise results for use in comparing potential methods of interest for conducting noise analysis. This section will provide an overview of the framework for aviation environmental impacts analysis used for the case studies in this thesis and will provide a detailed explanation for the methodology used to generate the specific results presented in this thesis. This is important for understanding the scope of applicability of the results presented and for potential comparison with other environmental impact analyses.
4.1 Rapid Aviation Environmental Impact Modeling Framework Overview
A tool has been developed for rapid analysis of aviation environmental impacts to enable broader analysis of both high-level policy changes and specific changes in airport arrival and departure procedures [21]. This framework was designed to enable rapid airport-level and national-level environmental impacts analysis. An overview of the framework as applied to this thesis is shown in Figure 13.


![Figure 8: Percent of People Highly Annoyed by DNL. Source: HMMH [12]](https://thumb-eu.123doks.com/thumbv2/123doknet/14410293.511609/28.917.136.788.268.697/figure-percent-people-highly-annoyed-dnl-source-hmmh.webp)