HAL Id: hal-01158022
https://hal-enpc.archives-ouvertes.fr/hal-01158022
Submitted on 19 Jun 2015HAL is a multi-disciplinary open access archive for the deposit and dissemination of sci-entific research documents, whether they are pub-lished or not. The documents may come from teaching and research institutions in France or abroad, or from public or private research centers.
L’archive ouverte pluridisciplinaire HAL, est destinée au dépôt et à la diffusion de documents scientifiques de niveau recherche, publiés ou non, émanant des établissements d’enseignement et de recherche français ou étrangers, des laboratoires publics ou privés.
Flow-Focusing and T-Junction Devices
Benoit Laborie, Florence Rouyer, Dan Angelescu, Elise Lorenceau
To cite this version:
Benoit Laborie, Florence Rouyer, Dan Angelescu, Elise Lorenceau. Bubble Formation in Yield Stress Fluids Using Flow-Focusing and T-Junction Devices. Physical Review Letters, American Physical Society, 2015, 114 (20), pp.204501. �10.1103/PhysRevLett.114.204501�. �hal-01158022�
Bubble Formation in Yield Stress Fluids Using Flow-Focusing and
T-Junction Devices
Benoit Laborie,1,2 Florence Rouyer,3 Dan E. Angelescu,2,4 and Elise Lorenceau1,*
1
Université Paris-Est, Laboratoire Navier (UMR 8205 CNRS, ENPC ParisTech, IFSTTAR), 2 allée Kepler, 77420 Champs-sur-Marne, France
2
Université Paris-Est, ESIEE Paris/ESYCOM, 2 Bd. Blaise Pascal, Noisy le Grand, 93162, France
3
Université Paris-Est, Laboratoire Navier (UMR 8205 CNRS, ENPC ParisTech, IFSTTAR), 77454 Marne-la-Vallée, France
4
Fluidion, 231 Rue St. Honoré, 75001 Paris, France
(Received 21 November 2014; revised manuscript received 10 February 2015; published 22 May 2015) We study the production of bubbles inside yield stress fluids (YSFs) in axisymmetric T-junction and flow-focusing devices. Taking advantage of yield stress over capillary stress, we exhibit a robust break-up mechanism reminiscent of the geometrical operating regime in 2D flow-focusing devices for Newtonian fluids. We report that when the gas is pressure driven, the dynamics is unsteady due to hydrodynamic feedback and YSF deposition on the walls of the channels. However, the present study also identifies pathways for potential steady-state production of bubbly YSFs at large scale.
DOI:10.1103/PhysRevLett.114.204501 PACS numbers: 47.61.Fg, 47.55.db, 83.60.La
A remarkable achievement of microfluidics consists in manufacturing complex fluids at reasonable throughput with a highly accurate control. The formation of mono-disperse emulsions and foams in microfluidic systems has recently undergone rapid development [1–3]. Different geometries such as T-junction [4–8], flow focusing
[9–17], or step emulsification[18–21]have been developed to control the size and the throughput of the droplets. Microfluidics devices with more complex geometries also enable the manufacturing of multiple hierarchical struc-tured fluids to encapsulate pharmaceuticals for targeted drug delivery[22–25].
In all such free-surface processes, the fragmentation of the dispersed phase in the continuous one is in fine obtained through the capillary breakup of a thin liquid thread of the dispersed fluid. As the diameter of this thread diminishes due to shearing flow of the continuous phase in the confined geometry, Laplace pressure becomes the domi-nant driving force governing both the dynamics and the breakup of the thread [26–28]. Capillary effects are thus crucial ingredients for microbubble and droplet production in microfluidics [1–14,18–21].
Only a few reports in the literature exist of dispersions obtained in microfluidic system using non-Newtonian fluids
[29–34]. Among those, yield stress fluids (YSFs), commonly encountered in mundane and diverse articles such as cosmetic creams, toothpaste, or chocolate as well as in industrial fluids such as drilling muds, have received rela-tively little consideration[35]. Nevertheless, dispersing a gas or a liquid in a YSF can have important industrial applica-tions: aerated pasty materials, for example, exhibit attractive properties such as low thermal conductivity, reduced density and nontrivial rheology and texture, and are widely used in various fields such as construction, food, or pharmaceutical industries [36,37]. Such materials are usually obtained by
batch processing: a YSF and a separately produced foam are mixed by mechanical means. Such methods provide little control over the stress state of the system, leading to bubbles, breakup, or coalescence, and making high gas volume fractions difficult to obtain[36–38], with direct impact on the quality of the resulting material.
The flow of YSFs is characterized by an intermediate fluid or solid behavior: they exhibit an elastic response below, and liquid flow response above a critical yield stress σy. The existence ofσy can induce an intrinsic impediment
for capillary breakup: if the mean curvature of the interface is not sufficiently large, yield stress may not be overcome by the relatively low capillary stress, thus hindering capillary breakup. Such antagonistic behavior between yield and capillary stresses has recently been observed in various situations[39–41]. Similarly, the production of YSF drops in air relies on gravity stress, which has to overcome the yield stress for capillary breakup to occur
[42,43]. In microfluidic geometries, where the lateral dimensions of channels are far smaller than the capillary length, gravity stress is ineffective; therefore, the formation of droplets or bubbles within YSFs can only be achieved below a critical dimension r of the liquid thread, where σy≪ γ=r (γ being the surface tension). For typical values
γ ≈ 20 mN=m, σy≈ 100 Pa, this leads to r ≪ 200 μm, a
value that suggests a requirement for small-scale micro-fluidic geometries, at the cost of large shear dissipation.
In this Letter we show that bubble production is never-theless possible in larger millimeter-scale geometries and at relatively low shear, using the dual solid or liquid character of the velocity profile of YSFs in a small pipe to reach the critical dimensions discussed above without requiring extreme miniaturization. Because of the variation of the shear stress with the distance from the center of the pipe, the velocity profile of a YSF is separated into two regions, a
liquid annulus corresponding to the area experiencing stress aboveσy, and a solid plug at the center of the channel where
the shear stress is belowσy[44]. To produce bubbles in YSFs at relatively low shear, we make use of this solid core to geometrically confine the gas thread without requiring solid walls, down to the critical dimension where capillary stress overcomesσy, thus triggering its capillary breakup. In this framework, we investigate means to adapt classical micro-fluidic geometries (T-junction and flow focusing) to the production of aerated YSFs in millimeter-scale devices requiring relatively low shear stresses and energy dissipation. We provide measurements of bubble formation frequency and propose scaling arguments for this operating regime.
Two different yield-stress fluids are used as model materials: (i) oil-in-water emulsions constituted of 20 cP silicon oil droplets of5 μm mean diameter with a volume fraction of 90% (resp. 93%) and a continuous phase of water/glycerol (50%/50% wt/wt) mixture with 3% (resp. 5%) wt/wt of tetradecyltrimethylammonium bromide (from Sigma-Aldrich) to stabilize the interfaces and (ii) a 980 Carpobol gel in water at a concentration of 1.1% (from Cooper). The rheological tests, carried out with a Bohlin C-VOR rheometer with rough parallel plates, show that these materials behave as simple YSFs. In shear flow, they follow a classical Herschel-Bulkley law linking the shear stressσ to the shear rate _γ∶ σ ¼ σyþ K_γn, withσybetween
100 Pa and 300 Pa for the emulsion and 75 Pa for the Carbopol gel, K the consistency index ranging between 67 Pa · snand124 Pa · snand n the power law index equal
to 0.5 for emulsions and 0.35 for Carbopol.
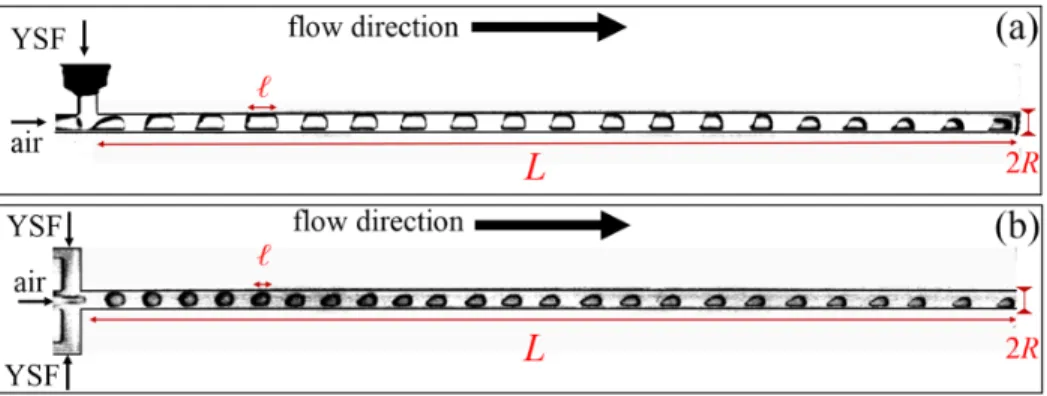
The three-dimensional devices are manufactured from transparent resin using stereolithography. Two geometries, reminiscent of classical microfluidics geometries but with millimetric dimensions are used: (i) a reverse T-junction [Fig.1(a)], where the dispersed phase is injected through the inlet aligned with the exit channel and the continuous phase through the inlet transverse to it, and (ii) a flow-focusing geometry, but without the typical narrow restriction at the dispersed-phase inlet [Fig. 1(b)]. In both geometries, the channels are cylindrical with radii R of 0.5 mm, 1 mm, or 2 mm and an exit channel with a length L of 5 cm or 10 cm.
The YSF flow rate Q is imposed between0.01 ml= min to 1.5 ml= min, while the gas pressure P is controlled using a Fluigent controller (MFCS-EZ, 0-2 bar). Bubble formation is recorded using an AVT Marlin camera, at a frame rate of 100 fps. To generate the bubbles, first we completely fill the exit channel with the YSF at a constant flow rate Q, then we gradually increase gas pressure P until it overcomes the critical value required to generate the first bubble. We then let the system evolve and observe the regular formation of multiple bubbles of increasing lengthl as can be seen in Fig.1. We point out that we were unable to produce bubbles in YSFs using classical T-junction geometries (where the gas is injected through the side channel). This is presumably due to the fact that the solid YSF core confines the bubble to the liquid annulus, rendering it unstable.
To quantify the break-up dynamics, we investigate the formation of a single bubble in the reverse T-junction geometry. Similar observations can be done in the flow-focusing geometry. Three different phases, of respective durations tα,tβ,tγ, can be identified [Fig. 2(a)] and Supplementary Materials[45]. For t < tα, the gas meniscus advances asymmetrically in the junction, slower near the YSF inlet and faster near the bottom wall until it reaches a maximum height; then for tα< t < tαþ tβ, the meniscus height at the center of the junction decreases at nearly constant speed because of the transverse solid plug flow of the YSF: a flat region highlighted in red, reminiscent of the velocity profile of the YSF in the cylindrical channel, is clearly visible. At t≈ tαþ tβ, the solid core has reached the bottom wall and for tαþ tβ< t < tαþ tβþ tγ, the gas thread meniscus moves backward. This suggests that the thin gas thread filament has fully ruptured as confirmed by the absence of satellite bubbles in the exit channel. It exits the junction area, which is eventually fully filled by YSF, whereas the bubble is pushed forward in the exit channel. The bubble formation period is then equal to tb¼ tαþ tβþ tγ.
The evolution of tα,tβ and tγ is visualized using a spatiotemporal diagram as shown in Fig. 2(b). Such a diagram, obtained from a movie of the bubbles’ formation at given P and Q, displays the temporal evolution of the
FIG. 1 (color online). Top view of different devices: (a) T-junction, (b) flow focusing; L is the exit channel length, R the radius of all channels (inlet and exit). Pictures taken with R¼ 1 mm, L ¼ 10 cm.
gray scale intensity of the images along a line OZ. This line OZ is taken perpendicular to the exit channel and posi-tioned at the middle of the junction as highlighted by the thick red arrow on the first frame of Fig. 2(a). The formation of seven bubbles in the T-junction can be seen in Fig. 2(b). The black and white regions of the patterns, respectively, correspond to air and YSF fluid and the upper limit of each pattern to the temporal evolution of the
air-YSF interface along the line OZ during bubble for-mation. Figure 2(b) reveals different features: (i) the position of the interface along the line OZ increases with time until it reaches almost2R, the diameter of the tube; (ii) tα and tγ progressively decrease with time. This suggests that, at late times, the bubble formation period is dominated by the time required for the solid core to move across the junction (tb→ tβ).
This nonstationary regime can be accounted for by two separate phenomena. On one hand, the reduced hydro-dynamic resistance of the exit channel as it fills with bubbles creates hydrodynamic feedback[46,47]: the gas flow-rate Qgincreases rapidly due to the non-Newtonian character of the continuous phase and consequently tα and tγ both associated with the gas flow within the junction, decrease until tbreaches a minimum value tminb [circles and horizontal
line in Fig. 2(c)]. This decrease of tb should suggest the production of smaller bubbles; however, it is not sufficient to counterbalance the catastrophic increase of Qgdue to the flow resistance drop with the bubble production of the exit channel. These two antagonistic effects do not compensate each other and the length l of the successive bubbles increases [triangles in Fig.2(c)and Fig.1].
On the other hand, the plugs leave YSF films in their wakes that remain at rest on the channel wall[40](this is not specific to YSF but also appears in Newtonian fluids[48]). Thus, as the whole two-phase flow accelerates due to the exit channel flow resistance drop, the thickness of the YSF films deposited on the channel wall increases. This leads to an increase of the bubble length due to volume conservation and to a gradual decrease of the volume of the YSF plugs separating two bubbles until they rupture when reaching a critical dimension[47]. At this point, a giant bubble that completely fills the exit channel forms, the bubble produc-tion stops and tb→ ∞ [vertical dashed line on Fig.2(c)].
This instability of the plug rupture is not characteristic of YSFs. It has also been observed for Newtonian fluids[47]
and is characteristic of every system exhibiting: (i) high viscosity contrast between the dispersed and continuous phases, (ii) pressure control of the dispersed phase.
We now quantify tmin
b , the lower bound of tb. As already
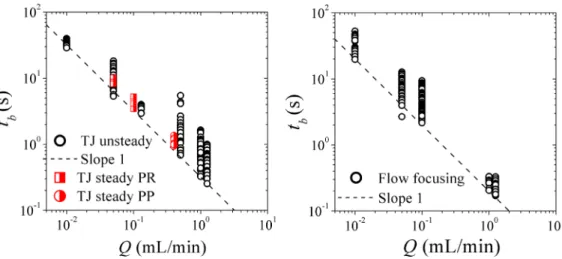
observed in Fig.2(c), at given P and Q, tbis not constant: it takes longer to produce the first bubble than the last one. Yet, as can be seen in Fig. 3, where tb is reported as a
function of Q in log-log scale, tmin
b is proportional to1=Q.
Letω be the slope of the straight dashed line in Fig.3so that tminb ¼ ω=Q. Remarkably, for the T-junction with R ¼ 1 mm [Fig. 3(a)], ω is equal to the actual volume of the T-junction within less than 10%. This volume, called Ω, corresponds to the intersection of the two cylindrical channels of radii R, therefore Ω ¼83R3þ πR3. For the flow-focusing geometry with R¼ 1 mm [Fig. 3(b)], Ω ¼ 16R3=3, and we find experimentally that ω ¼ 0.6Ω.
This good correlation betweenω and Ω can be explained through the decrease of the exit channel flow resistance FIG. 2 (color online). (a) Different stages of the break-up
mechanism inside the T-junction, for a movie see Supplementary Materials [45]. (b) Spatiotemporal diagram of the break-up dynamic for a bubble train. The horizontal axis represents the (OZ) axis of the top picture in frame (a) and the vertical axis the time. The dashed blue lines illustrate the nearly constant speed regime of the YSF plug during the formation of different bubbles. (c) Typical evolution of the time to form one bubble tb (left
vertical axis) and bubble lengthl (right vertical axis) as a function of the time, with corresponding pictures of the spatiotemporal diagram. The dashed line stands for the divergence of bubble time formation when the system is completely filled with gas. The horizontal line highlights tmin
b , the minimum time to form
one bubble. In (a), (b), and (c) R¼ 1 mm, L ¼ 10 cm, Q ¼ 1.25 ml= min, P ¼ 0.62 bar, emulsion with σy¼ 100 Pa).
during an experiment. As we have previously noted, as Qg progressively increases, tb decreases approaching
tβ¼ Ω=Q, the time required for the YSF to fill the volume Ω of the junction. This defines the maximum achievable bubble production throughput for a given device geometry and YSF flow rate.
The correlation between tminb and Ω=Q has been tested over a wide range of parameters in Fig.4: two YSF fluids with four differentσy, up to fifteen flow rates Q, and both the
flow-focusing and T-junction with various channel dimen-sions. Moreover, data points concerning different stationary regimes of bubble production can be seen in Figs.3and4. These steady regimes have been obtained either by supply-ing the gas ussupply-ing a peristaltic pump or by decreassupply-ing the gas pressure by a few mBar, during the transient filling of the exit channel with bubbles. In both cases, the catastrophic increase of Qg is counteracted, thus leading to a steady production regime. Excellent agreement is observed over more than four decades, suggesting that the explanation of the limit bubble production throughput in YSFs using axisymmetric millifluidic devices, where the dynamics of breakup is controlled by the junction volume and YSF flow rate, is very robust regardless of the YSF flow complexity. This break-up regime is reminiscent of the quasistatic collapse of immiscible threads in two dimensions, in which case the rate of droplet production is driven by the rate of supply of the continuous phase in the confined geometry
[12]. Indeed, in two dimensions the squeezed capillary thread is stable over the Rayleigh-Plateau instability, the slow thinning rate being therefore flow-rate controlled until reaching a diameter of order of the channel height, where the capillary thread recovers an axisymmetric 3D geometry and becomes unstable. The final 3D pinch-off, controlled by liquid and gas inertia[13,14,16,49]is extremely rapid. The separation of time scales between the slow flow rate controlled thread thinning and the fast final collapse leads to a uniform time for bubble production in the device[12].
By comparison, in our three-dimensional geometry the gas thread is not confined; instead, it is the large value ofσythat
inhibits the capillary breakup. Here also, the slow thinning rate of the thread is geometrically mediated and well controlled by the slow core flow, which therefore controls the time scale of the breakup, making our system insensi-tive to the complex interface dynamics of the air thread in the non-Newtonian fluid[31,32].
We have also focused on identifying different pathways to reach steady-state production of aerated YSFs within millifluidic devices. We have determined that such FIG. 3 (color online). tb as a function of the YSF flow rate in T-junction (left) and flow-focusing geometry (right), for Carbopol (σy¼ 75 Pa) both with channels’ radii of 1 mm and exit channel length of 10 cm. The red symbols correspond to steady regimes either
obtained from pressure regulation (PR) or peristaltic pump (PP).
FIG. 4 (color online). tmin
b as a function ofΩ=Q for T-junction
(TJ) and the flow-focusing (FF) geometries. The different symbols are detailed in the inset; (E) stands for emulsion, (C) for Carbopol. The red symbols correspond to different steady state bubble production. TJ, FF, PR, and PP, respectively, stand for T-junction, flow focusing, pressure regulation, and peristaltic pump.
stationary production is possible by adjusting the gas pressure in real time during the short temporary regime until the bubbling period becomes perfectly stable, thus opening a route for large-scale production of aerated YSF materials. These findings, which have allowed us to provide a useful physical description similar to Newtonian fluids
[17], also lead to interesting perspectives such as under-standing the whole flow field during the fragmentation process using dedicated numerical simulations of YSFs or producing a detailed description of the break-up mechanism. We thank M. Maillard, L. Ducloué, and J. Goyon, for experimental advice and discussions and D. Hautemayou and C. Mézière for technical help. We acknowledge O. Pitois for fruitful discussions. This work has benefited from two French government grants managed by ANR within the frames of the national program Investments for the Future (ANR-11-LABX-022-01) and of the young researcher program (ANR-11-JS09-012-WOLF).
*
Corresponding author. elise.lorenceau@ifsttar.fr
[1] A. Huerre, V. Miralles, and M.-C. Jullien,Soft Matter 10, 6888 (2014).
[2] S.-Y. Teh, R. Lin, L.-H. Hung, and A. P. Lee,Lab Chip 8, 198 (2008).
[3] D. Bartolo and D. G. A. L. Aarts,Soft Matter 8, 10530 (2012). [4] T. Nisisako, T. Torii, and T. Higuchi,Lab Chip 2, 24 (2002). [5] M. De Menech, P. Garstecki, F. Jousse, and H. A. Stone,
J. Fluid Mech. 595, 141 (2008).
[6] P. Garstecki, M. Fuerstman, H. Stone, and G. Whitesides,
Lab Chip 6, 437 (2006).
[7] R. Seemann, M. Brinkmann, T. Pfohl, and S. Herminghaus,
Rep. Prog. Phys. 75, 016601 (2012).
[8] M. C. Jullien, M. J. T. M. Ching, C. Cohen, L. Menetrier, and P. Tabeling,Phys. Fluids 21, 072001 (2009).
[9] S. Anna, N. Bontoux, and H. Stone,Appl. Phys. Lett. 82, 364 (2003).
[10] A. G. Marin, F. Campo-Cortes, and J. M. Gordillo,Colloids Surf. 344, 2 (2009).
[11] Z. Nie, M. Seo, S. Xu, P. C. Lewis, M. Mok, E. Kumacheva, G. M. Whitesides, P. Garstecki, and H. A. Stone, Micro-fluid. NanoMicro-fluid. 5, 585 (2008).
[12] P. Garstecki, H. A. Stone, and G. M. Whitesides,Phys. Rev. Lett. 94, 164501 (2005).
[13] B. Dollet, W. van Hoeve, J.-P. Raven, P. Marmottant, and M. Versluis,Phys. Rev. Lett. 100, 034504 (2008). [14] W. van Hoeve, B. Dollet, M. Versluis, and D. Lohse,Phys.
Fluids 23, 092001 (2011).
[15] R. Suryo and O. A. Basaran,Phys. Fluids 18, 082102 (2006). [16] E. J. Vega, A. J. Acero, J. M. Montanero, M. A. Herrada, and A. M. Ganan-Calvo,Phys. Rev. E 89, 063012 (2014). [17] A. M. Ganan-Calvo,Phys. Rev. E 69, 027301 (2004). [18] S. Sugiura, M. Nakajima, S. Iwamoto, and M. Seki,
Langmuir 17, 5562 (2001).
[19] R. Dangla, E. Fradet, Y. Lopez, and C. N. Baroud,J. Phys. D 46, 114003 (2013).
[20] R. Dangla, S. C. Kayi, and C. N. Baroud,Proc. Natl. Acad. Sci. U.S.A. 110, 853 (2013).
[21] M. Stoffel, S. Wahl, E. Lorenceau, R. Hohler, B. Mercier, and D. E. Angelescu,Phys. Rev. Lett. 108, 198302 (2012). [22] A. Utada, E. Lorenceau, D. Link, P. Kaplan, H. Stone, and
D. Weitz,Science 308, 537 (2005).
[23] E. Lorenceau, A. Utada, D. Link, G. Cristobal, M. Joanicot, and D. Weitz,Langmuir 21, 9183 (2005).
[24] S. Okushima, T. Nisisako, T. Torii, and T. Higuchi,
Langmuir 20, 9905 (2004).
[25] A. M. Ganan-Calvo, J. Montanero, L. Martn-Banderas, and M. Flores-Mosquera,Adv. Drug Delivery Rev. 65, 1447 (2013). [26] J. Eggers,Rev. Mod. Phys. 69, 865 (1997).
[27] J. Eggers and E. Villermaux,Rep. Prog. Phys. 71, 036601 (2008). [28] P. Doshi, I. Cohen, W. Zhang, M. Siegel, P. Howell,
O. Basaran, and S. Nagel,Science 302, 1185 (2003). [29] A. Duboin, R. Middleton, F. Malloggi, F. Monti, and
P. Tabeling,Soft Matter 9, 3041 (2013).
[30] T. Fu, Y. Ma, D. Funfschilling, C. Zhu, and H. Z. Li,AIChE J. 58, 3560 (2012).
[31] T. Fu, Y. Ma, D. Funfschilling, and H. Z. Li,Microfluid. Nanofluid. 10, 1135 (2011).
[32] T. Fu, Y. Ma, D. Funfschilling, and H. Z. Li, Chemical Engineering and Processing 50, 438 (2011).
[33] P. Nghe, E. Terriac, M. Schneider, Z. Z. Li, M. Cloitre, B. Abecassis, and P. Tabeling,Lab Chip 11, 788 (2011). [34] O. E. Yildirim and O. A. Basaran,J. Non-Newtonian Fluid
Mech. 136, 17 (2006).
[35] J. S. Hong and J. Cooper-White, Korea-Australia Rheo. J. 21, 269 (2009).
[36] L. Ducloue, O. Pitois, J. Goyon, X. Chateau, and G. Ovarlez,Soft Matter 10, 5093 (2014).
[37] J. Goyon, F. Bertrand, O. Pitois, and G. Ovarlez,Phys. Rev. Lett. 104, 128301 (2010).
[38] A. Salonen, R. Lhermerout, E. Rio, D. Langevin, and A. Saint-Jalmes,Soft Matter 8, 699 (2012).
[39] B. Geraud, L. Jorgensen, L. Petit, H. Delanoe-Ayari, P. Jop, and C. Barentin,Europhys. Lett. 107, 58002 (2014). [40] M. Maillard, J. Boujlel, and P. Coussot, Phys. Rev. Lett.
112, 068304 (2014).
[41] N. J. Balmforth, I. A. Frigaard, and G. Ovarlez,Annu. Rev. Fluid Mech. 46, 121 (2014).
[42] M. Aytouna, J. Paredes, N. Shahidzadeh-Bonn, S. Moulinet, C. Wagner, Y. Amarouchene, J. Eggers, and D. Bonn,
Phys. Rev. Lett. 110, 034501 (2013).
[43] P. Coussot and F. Gaulard,Phys. Rev. E 72, 031409 (2005). [44] C. W. Macosko, Rheology: Principles, Measurements and
Applications (Wiley-VCH, New York, 1994).
[45] See Supplemental Material at http://link.aps.org/
supplemental/10.1103/PhysRevLett.114.204501for
forma-tion of gas bubbles in a Yield-Stress Fluid (YSF) using a T-Junction device. The diameter of the channels is 2 mm, the YSF is an oil-in-water emulsion with a yield stress of 250 Pa. The gas is pressure-driven at 511 mBar and the YSF is flow rate driven at0.1 mL= min. The movie, recorded at 50 fps, is displayed in real time.
[46] M. T. Sullivan and H. A. Stone,Phil. Trans. R. Soc. A 366, 2131 (2008).
[47] M. Baudoin, Y. Song, P. Manneville, and C. N. Baroud,
Proc. Natl. Acad. Sci. U.S.A. 110, 859 (2013). [48] F. P. Bretherton,J. Fluid Mech. 10, 166 (1961).
[49] J. M. Gordillo, A. Sevilla, J. Rodriguez-Rodriguez, and C. Martinez-Bazan, Phys. Rev. Lett. 95, 194501 (2005).