HAL Id: hal-00301784
https://hal.archives-ouvertes.fr/hal-00301784
Submitted on 7 Jul 2006HAL is a multi-disciplinary open access
archive for the deposit and dissemination of sci-entific research documents, whether they are pub-lished or not. The documents may come from teaching and research institutions in France or abroad, or from public or private research centers.
L’archive ouverte pluridisciplinaire HAL, est destinée au dépôt et à la diffusion de documents scientifiques de niveau recherche, publiés ou non, émanant des établissements d’enseignement et de recherche français ou étrangers, des laboratoires publics ou privés.
Radiocarbon analysis in an Alpine ice core: record of
anthropogenic and biogenic contributions to
carbonaceous aerosols in the past (1650?1940)
T. M. Jenk, S. Szidat, M. Schwikowski, H. W. Gäggeler, S. Brütsch, L.
Wacker, H.-A. Synal, M. Saurer
To cite this version:
T. M. Jenk, S. Szidat, M. Schwikowski, H. W. Gäggeler, S. Brütsch, et al.. Radiocarbon analysis in an Alpine ice core: record of anthropogenic and biogenic contributions to carbonaceous aerosols in the past (1650?1940). Atmospheric Chemistry and Physics Discussions, European Geosciences Union, 2006, 6 (4), pp.5905-5931. �hal-00301784�
ACPD
6, 5905–5931, 2006
Ice core record of carbonaceous aerosols T. M. Jenk et al. Title Page Abstract Introduction Conclusions References Tables Figures J I J I Back Close
Full Screen / Esc
Printer-friendly Version Interactive Discussion
EGU
Atmos. Chem. Phys. Discuss., 6, 5905–5931, 2006 www.atmos-chem-phys-discuss.net/6/5905/2006/ © Author(s) 2006. This work is licensed
under a Creative Commons License.
Atmospheric Chemistry and Physics Discussions
Radiocarbon analysis in an Alpine ice
core: record of anthropogenic and
biogenic contributions to carbonaceous
aerosols in the past (1650–1940)
T. M. Jenk1,2, S. Szidat1,2, M. Schwikowski2, H. W. G ¨aggeler1,2, S. Br ¨utsch2, L. Wacker3, H.-A. Synal4, and M. Saurer2
1
Department of Chemistry and Biochemistry, University of Bern, Bern, Switzerland
2
Paul Scherrer Institut, Villigen PSI, Switzerland
3
Institute for Particle Physics, ETH H ¨onggerberg, Z ¨urich, Switzerland
4
Paul Scherrer Institut, c/o Institute for Particle Physics, ETH H ¨onggerberg, Z ¨urich, Switzerland
Received: 29 May 2006 – Accepted: 14 June 2006 – Published: 7 July 2006 Correspondence to: M. Schwikowski (margit.schwikowski@psi.ch)
ACPD
6, 5905–5931, 2006
Ice core record of carbonaceous aerosols T. M. Jenk et al. Title Page Abstract Introduction Conclusions References Tables Figures J I J I Back Close
Full Screen / Esc
Printer-friendly Version Interactive Discussion
Abstract
Long-term concentration records of carbonaceous particles (CP) are of increasing in-terest in climate research due to their not yet completely understood effects on climate. Nevertheless, only poor data on their concentrations and sources in the past is avail-able. We present a first long-term record of organic carbon (OC) and elemental carbon
5
(EC) concentrations – the two main fractions of CP – along with the corresponding fraction of modern carbon (fM) derived from radiocarbon (14C) analysis. The com-bination of concentration measurements with 14C analysis of CP allows a distinction and quantification of natural, biogenic and anthropogenic fossil sources in the past. CP were extracted from an ice archive, with resulting carbon quantities in the
micro-10
gram range. Analysis of14C by accelerator mass spectrometry (AMS) was therefore highly demanding. We analysed 33 samples of 0.4 to 1 kg ice from a 150.5 m long ice core retrieved at Fiescherhorn glacier in December 2002 (46◦3303.200N, 08◦0400.400E; 3900 m a.s.l.). Samples were taken from below the firn/ice transition down to bedrock, covering the time period 1650–1940 and thus the transition from the pre-industrial to
15
the industrial era. Before 1800, OC was of pure biogenic origin with a mean concen-tration of 21±2 µg kg−1. In 1940, OC concentration was more than a factor of 3 higher than this biogenic background, almost half of it originating from anthropogenic sources, i.e. from combustion of fossil fuels. The biogenic EC concentration was nearly constant over the examined time period with 6±1 µg kg−1. In 1940, the additional anthropogenic
20
input of atmospheric EC was about 50 µg kg−1.
1 Introduction
Atmospheric aerosol particles affect global climate and air quality, thus having im-pact on human welfare and human health (e.g. Brimblecombe, 1987; Penner et al., 1994; IPCC, 2001; Davidson et al., 2005). The so-called aerosol forcing is based on
25
ACPD
6, 5905–5931, 2006
Ice core record of carbonaceous aerosols T. M. Jenk et al. Title Page Abstract Introduction Conclusions References Tables Figures J I J I Back Close
Full Screen / Esc
Printer-friendly Version Interactive Discussion
EGU
Ramanathan, 2003). Simplified, two main effects can thereby be distinguished, a di-rect effect, involving absorption and scattering of solar radiation, and an indirect effect since aerosol particles act as cloud condensation nuclei and enhance the formation of clouds (e.g. Novakov and Penner, 1993; Haywood, 1997; Jacobson, 2002). The strength of these effects and whether they result in a net cooling or net warming of the
5
atmosphere is dependent on particle concentration, size and composition (Jacobson, 2002; Crutzen and Ramanathan, 2003; Davidson et al., 2005). At the time, the magni-tude of the mostly negative aerosol forcing associated with anthropogenic aerosols is highly uncertain (IPCC, 2001). Carbonaceous particles (CP) are a major component of the atmospheric aerosol and consist of two main fractions, organic carbon (OC) and
10
elemental carbon (EC). OC is emitted either directly as aerosol particle or is formed from gaseous precursors as secondary organic aerosol. The origin of EC is primarily direct particle emission, nowadays mainly from anthropogenic sources (Slater et al., 2002; Szidat et al., 2004a). According to their different sources and ways of emission (direct or as gaseous precursors), both fractions differ in their composition and size and
15
thus contribute differently to the climate forcing. Especially EC is thought to be highly relevant due to its high absorption and is discussed to be one of the most important anthropogenic constituent to global warming after CO2 (Hansen and Sato, 2001; Ja-cobson, 2002). Additionally, EC is known to enhance the melting process of snow and ice packs by increasing the absorbance of solar energy (ice-albedo feedback) (Clarke
20
and Noone, 1985; Jacobson, 2004). As over 30% of the earth’s surface is season-ally covered by snow and ice, this leads to a further and additional climate response (albedo-temperature feedback) (Groisman et al., 1993; Hansen and Nazarenko, 2004; Jacobson, 2004).
14
C analysis offers a unique potential for unambiguous source apportionment of CP
25
due to the possibility of a direct distinction of contemporary and fossil carbon (Szidat et al., 2004b; Currie, 2000; Lemire et al., 2002, Reddy et al., 2002). The separation of OC and EC can be achieved based on their specific thermal and chemical prop-erties (Jacobsen, 2000). Ambient concentrations of CP are rather inhomogeneous,
ACPD
6, 5905–5931, 2006
Ice core record of carbonaceous aerosols T. M. Jenk et al. Title Page Abstract Introduction Conclusions References Tables Figures J I J I Back Close
Full Screen / Esc
Printer-friendly Version Interactive Discussion
representing a complex mixture of primary and secondary particles. Long-range trans-port enables a mixing of the two species over space and time. Urban as well as rural pollution can contribute to the finally deposited particles. Despite their short mean at-mospheric residence time of about one week, they can be detected in remote areas such as high-elevation glaciers (Lavanchy et al., 1999a and b; Bazhev et al., 1998;
5
Holdsworth et al., 1996) and polar ice sheets (Cachier and Pertuisot, 1994; Chylek et al., 1992, 1995) where they are scavenged from the atmosphere during snowfall (Bal-tensperger et al., 1998). So far, data of CP concentrations from direct measurements exist only for short time periods (Sharma et al., 2004). There is still a large uncertainty about the contribution of biogenic and anthropogenic sources to these particles,
es-10
pecially for historical emissions. As ice cores allow access to samples representing climate and atmospheric conditions in the past, investigation of CP precipitated and stored in mid-latitude glaciers might help to overcome the lack of long-term data. The knowledge of past concentrations and sources is essential to understand their effect to climate conditions and might allow a better distinction from other anthropogenic or
nat-15
ural climate driving factors, finally resulting in improved models to predict future climate scenarios.
In this work, we present an ice-core record of past concentrations of the two main carbonaceous particle fractions, water-insoluble organic carbon (OC) and elemental carbon (EC). We quantified the natural and anthropogenic sources in the past,
us-20
ing the fraction of modern carbon (fM) determined by microgram14C AMS analysis. Additional stable carbon isotope (δ13C) analysis was performed and results will be dis-cussed. The record spans the time period 1650–1940, covering the transition from the pre-industrial to the industrial era. The time span between 1940 and present was not analysed since the technique applied could only be used for ice but not for snow and
25
ACPD
6, 5905–5931, 2006
Ice core record of carbonaceous aerosols T. M. Jenk et al. Title Page Abstract Introduction Conclusions References Tables Figures J I J I Back Close
Full Screen / Esc
Printer-friendly Version Interactive Discussion
EGU
2 Experimental methods
2.1 Ice core recovery and dating
In December 2002 a 150.5 m long ice core reaching bedrock was extracted from the Fiescherhorn glacier (FH, 46◦3303.200N, 08◦0400.400E; 3900 m a.s.l.) in the Bernese Oberland (Switzerland), approximately 6 km east of the high alpine research station
5
Jungfraujoch (JFJ) (Fig. 1). The Fiescherhorn glacier was known before to be suit-able as natural archive of past atmospheric composition (Schotterer et al., 1998; Schwikowski et al., 1999a; Huber, 2001). The annual net accumulation rate at this site is about 1.4 m water equivalent (m weq) and snow fall is rather equally distributed over all four seasons.
10
Dating of the ice core was performed by annual layer counting (ALC) using the stable hydrogen isotope ratio δD (back to 1840) and the ammonium concentration as season-ally varying parameters (back to 1668 at a depth of 150 m (123.9 m weq)). The deepest 50 cm of the core were not analysed for chemical tracers due to bad ice quality. Thus, dating had to be extrapolated for this part, resulting in additional 20 years. An ice flow
15
model based on physical parameters and applied to FH, gives an age of 274 years at 145 m (Schwerzmann et al., 2006), differing from the dating by ALC in the lowermost 5 m of the core by only 25 years. This is in accordance with the estimated dating uncer-tainties of ALC, which are increasing from top to bottom of the core with ±2–5 years for the period 1940–1900, ±5–10 years for 1900–1800 and ±10–25 years for 1800–1650.
20
During ice core drilling, the obtained core sections of about 70 cm length and 8 cm diameter were handled wearing gloves all the times. They were packed right after extraction into polyethylen tubes to prevent contamination. The ice core sections were then transported in frozen condition to the laboratory for further treatment.
ACPD
6, 5905–5931, 2006
Ice core record of carbonaceous aerosols T. M. Jenk et al. Title Page Abstract Introduction Conclusions References Tables Figures J I J I Back Close
Full Screen / Esc
Printer-friendly Version Interactive Discussion
2.2 Sample preparation
Cutting of the ice core sections and removal of possibly contaminated outer layers was performed in a cold room (−20◦C) using a pre-cleaned stainless-steel band saw. Different spatial resolution was chosen for the analysis of major ions by ion chromatog-raphy (Eichler et al., 2000), stable isotopes in water (δD, δ18O) by isotope ratio mass
5
spectrometry (IRMS) and carbonaceous particles. After cutting, samples were stored frozen in pre-cleaned containers (PETG, Semadeni) until further treatment or analysis. All steps described in the following
were carried out in a class 100 laminar flow-box; materials used were made of quartz, glass, stainless steel or Teflon if not marked differently. All parts were pre-cleaned prior
10
to use by brushing, rinsing with ultra-pure water (MilliQ, 18 MΩ cm−1 quality) and pre-heating. For the analysis of carbonaceous particles an additional decontamination step was performed to exclude possible input of dust and fibres from clothes worn in the cold room. For this purpose, the frozen samples of up to 1 kg ice were rinsed with ultra-pure water (mass loss 10 to 20%) to remove surface contamination. Afterwards they were
15
transferred into new, pre-cleaned containers which were closed for melting at room temperature. To collect the water-insoluble carbonaceous particles contained in the ice, the liquid samples were filtered through pre-heated (12 h at 1000◦C) quartz fibre filters (PallFlex Tissuquartz, 2500QAO-UP), which were afterwards acidified three times with 50 µL 0.2 M HCl to remove carbonates before they were finally stored to complete
20
dryness (Lavanchy et al., 1999a) For additional details see Jenk et al. (2006)1. Since the decontamination by rinsing with ultra-pure water is not applicable for porous snow and firn samples as they would take up the water, we analysed only samples from below the firn/ice transition (see also Sect. 2.6).
1
Jenk, T. M., Szidat, S., Schwikowski, M., G ¨aggeler, H. W., Bolius, D., Wacker, L., Synal, H.- A., and Saurer, M.: Microgram Level Radiocarbon (14C) determination on Carbonaceous Particles in Ice, Nucl. Instr. and Meth. Phys. Res. B, in review, 2006.
ACPD
6, 5905–5931, 2006
Ice core record of carbonaceous aerosols T. M. Jenk et al. Title Page Abstract Introduction Conclusions References Tables Figures J I J I Back Close
Full Screen / Esc
Printer-friendly Version Interactive Discussion
EGU
2.3 Separation of OC and EC
The method we applied to separate OC and EC in carbonaceous particles and the sub-sequent microgram-level14C AMS analysis was initially developed for ambient aerosol samples (Szidat et al., 2004a, b, c). Details for the application on ice samples can be found in Jenk et al. (2006)1. In short, filters with the water-insoluble carbonaceous
5
particles were combusted stepwise at 340◦C and 650◦C to separate OC from EC. Be-cause a complete separation of OC is important for an accurate 14C analysis of EC and no well-defined transition exists between these two fractions, an additional thermal elimination of OC was performed (4 h at 375◦C) prior to combustion at 650◦C (Szidat et al., 2004c). Formed CO2was cryogenically trapped and its volume determined
mano-10
metrically (detection limit <0.2 µg carbon). A 2–5% aliquot for δ13C IRMS analysis was separated and sealed in an evacuated glass tube. The remaining CO2was sealed in a quartz tube for transformation to filamentous carbon and subsequent 14C AMS analysis.
As we extracted the carbonaceous particles from the liquid phase by filtration, OC
15
and EC discussed in this study has always to be considered as the water-insoluble part of those fractions only. The water-insoluble part of OC can be best compared to what is described as WINSOC in Szidat et al. (2006). As discussed above, an additional thermal elimination of OC had to be performed offline in a muffle furnace, and thus the carbon concentration of the thereby removed mixed fraction could not be
20
quantified. The average loss of carbon due to this procedure was determined in aerosol samples collected at the high-alpine site JFJ and in the city of Z ¨urich in Switzerland and amounted to 50±8%. To make our results comparable to other studies, EC was therefore multiplied by a factor of 2.0±0.3.
2.4 14C AMS and δ13C IRMS analysis
25
The method of target preparation of microgram carbon samples using manganese and cobalt is based on previous work by Szidat et al. (2004c) with modifications for the
spe-ACPD
6, 5905–5931, 2006
Ice core record of carbonaceous aerosols T. M. Jenk et al. Title Page Abstract Introduction Conclusions References Tables Figures J I J I Back Close
Full Screen / Esc
Printer-friendly Version Interactive Discussion
cific requirements of ice samples (Jenk et al., 2006)1. Measurements of the 14C/12C ratio were performed on a 500 kV pelletron compact AMS system (Synal et al., 2000). Details of the target production, measurement parameters, data evaluation and cor-rections for microgram samples can be found in Szidat et al. (2004c) and Jenk et al. (2006)1. In short, the processing blank for ice samples was 1.3±0.6 µg OC with a
5
fM=0.6±0.1 and 0.3±0.1 µg EC with a fM=0.3±0.3. AMS calibration was performed using internal standards and blanks and we corrected for fractionation, for constant contamination during the processing of these ultra-small carbon samples (Hua et al., 2003) and subtracted the processing blank of ice samples. The repeated analysis of processed reference material resulted in agreement with consensus values and
stan-10
dard deviations were fM = ±0.02 (1σ). 13C/12C ratios of CO2 were additionally mea-sured offline by IRMS (Delta Plus XL, Thermo-Finnigan) equipped with gasbench- and precon-periphery (Thermo-Finnigan). With this set-up we reached standard deviations of 0.13 for the repeated anaysis of gaseous NBS Oxalic Acid standard (HOxI) and 0.19 for processed reference material (Jenk et al., 2006)1. δ13C values are given as
15
relative deviations from the international carbon reference standard “Vienna Pee Dee Belemnite” (V-PDB) in per mil.
2.5 Presentation of14C results
In the following,14C AMS results will be given as fraction of modern carbon (fM) related to the year of deposition. fM indicates the contribution of contemporary carbon to a
20
sample in percent and can easily be transferred into percent of modern carbon (pMC [%], pMC=fM •100) as defined in Stuiver and Polach (1977). Depending on the sample age, fM was corrected for the decay until the year of measurement (all measurements presented in this study were performed in 2004 or 2005). As the atmospheric14C/12C ratio is varying over time, the IntCal04 Northern Hemisphere radiocarbon calibration
25
curve from Reimer et al. (2004) was used to define the time-dependent fM value corre-sponding to 100% contemporary carbon. Thus, independent of the individual sample
ACPD
6, 5905–5931, 2006
Ice core record of carbonaceous aerosols T. M. Jenk et al. Title Page Abstract Introduction Conclusions References Tables Figures J I J I Back Close
Full Screen / Esc
Printer-friendly Version Interactive Discussion
EGU
age, a sample with fM=1 consisted 100% of contemporary carbon at the time of snow deposition on the glacier, and a sample with fM=0 contained pure fossil carbon. 2.6 Time resolution
We analysed 33 samples, extracted from 0.4 to 1 kg ice originating from the part of the core below the firn/ice transition (Sect. 2.2). The time period covered by the samples
5
is 1650 to 1940. The spatial resolution of samples analysed for OC was 70–140 cm, depending on ice quality and concentrations. Consequently, the time resolution var-ied between 1–10 and 10–30 years for the periods 1940–1850 and 1850–1650, re-spectively. Due to the lower EC concentration, two samples analysed for OC had to be pooled for 14C (EC) analysis, resulting in reduced resolution (1940–1900: 1–10
10
years; 1900–1650: 10–50 years). Even so, amounts were extremely low with only 9 to 20 µg C. Such small amounts of carbon are pushing the limits of AMS. Failure, due to measurements close to the detection limit and instable conditions occurred accordingly more often than for routine measurements. For that reason, 3 out of 14 EC samples and 7 out of 33 OC samples could not be analysed, resulting in a number of gaps in
15
the records. The δ13C record is also not continuous, since CO2 aliquots were only separated if the remaining CO2was sufficient for subsequent AMS analysis.
The concentrations of major ions presented in Sect. 3.3., were derived from samples analysed by ion chromatography. They were cut with a spatial resolution of 3 cm, 2 cm and 1.5 cm for the time periods 1940–1915, 1910–1900 and 1900–1670, respectively,
20
resulting in sub-annual signals. To compare the results with the CP record, 5 to 10 year averages were calculated.
ACPD
6, 5905–5931, 2006
Ice core record of carbonaceous aerosols T. M. Jenk et al. Title Page Abstract Introduction Conclusions References Tables Figures J I J I Back Close
Full Screen / Esc
Printer-friendly Version Interactive Discussion
3 Results and discussion
3.1 Record of OC and EC concentrations
Records of OC and EC concentration are presented in Fig. 2. The averaged relative uncertainty of all samples is 4% and 18% for OC and EC, respectively (the high un-certainty of EC is explained by the necessary correction with a factor of 2.0±0.3 as
5
described in Sect. 2.3). OC concentrations show high and abrupt fluctuations around a mean of 33 µg kg−1(range: 13 to 77 µg kg−1). No concentration trend was observed for the examined time period (1650–1940). Relatively high concentrations were found from 1670–1730, 1810–1820 and 1840–1855, which will be further discussed in Sect. 3.5. EC concentrations show a more steady behaviour and the mean value of 22 µg kg−1
10
(range: 8 to 60 µg kg−1) is lower than the OC mean. EC and OC concentrations are not correlated and in contrast to the OC record, there is a concentration trend obvious for EC. Concentrations began to increase around 1860–1870, reflecting the anthropogenic influence due to industrialisation and the corresponding extended use of fossil fuels (Penner et al., 1993). The average EC concentration from 1870 to 1940 (27 µg kg−1)
15
is a factor of two higher than in the period from 1650 to 1870 (14 µg kg−1). Relatively high concentrations were detected in 1810–1825 and around 1680–1730. These high levels are most probably influenced by mineral dust events (Sect. 3.3). Taking this into account, average EC concentrations from 1650 to 1870 (11 µg kg−1) were lower by a factor of 2.5 than the ones during the anthropogenic influenced era (1870 to 1940).
20
Our results are in general agreement with an earlier study of an ice core record from Colle Gnifetti (Fig. 1) by Lavanchy et al. (1999a). Concerning the limitations of this earlier work – only 36% of the ice which covered the recorded time-period was anal-ysed and thus resulted in a discontinuous record – similarities in the main structure and trend of the two records can still be observed. As only summer snow is accumulated
25
at Colle Gnifetti, OC concentrations were measured significantly higher there. Results are summarized in Table 1.
ACPD
6, 5905–5931, 2006
Ice core record of carbonaceous aerosols T. M. Jenk et al. Title Page Abstract Introduction Conclusions References Tables Figures J I J I Back Close
Full Screen / Esc
Printer-friendly Version Interactive Discussion
EGU
3.2 Source contribution to OC and EC based on14 C analysis
In Fig. 3 the OC and EC records of 14C/12C ratios are presented as fM(Sect. 2.5). The averaged uncertainty of fM including all samples is 7% and 12% for OC and EC, respectively.
A significant contribution of anthropogenic (fossil) sources after around 1870 can
5
be clearly identified in both fractions, in agreement with the observed increase of EC concentrations. However, there is no constantly increasing contribution of fossil fu-els, neither in the OC nor in the EC record as it would be expected based on esti-mated emissions (Penner et al., 1993). Instead, the data suggests a major emission source, leading to a clear signal from 1870–1900 with a maximum around 1890
(de-10
tailed discussion in Sect. 3.5). Nevertheless, the general trend reveals a more and more dominating contribution of anthropogenic sources after 1870, accordingly the rel-ative biogenic carbon contribution is decreasing for both fractions (Table 1). Values for 1940 show an anthropogenic contribution of 46±1% and 81±2% to the OC and EC concentrations, respectively, approaching the annual mean value of the year 2002 in
15
urban aerosol samples from Z ¨urich (Szidat et al., 2006). Although the consumption of fossil fuels is by factors higher today, the relative contributions of anthropogenic emis-sions to OC and EC around 1940 seem to be comparable. This may be due to the fact that these early emissions were not subjected to any air pollution control measures (e.g. introduction of filters in power plants). Before 1800, OC was of pure biogenic
20
origin. The anthropogenic contribution to EC emissions before 1850 was already sig-nificant with about 50%. This is unexpected and it seems as if this value is caused by airborne mineral dust, resulting in an artefact regarding biogenic and anthropogenic source apportionment (Sect. 3.3). Results are summarized in Table 1.
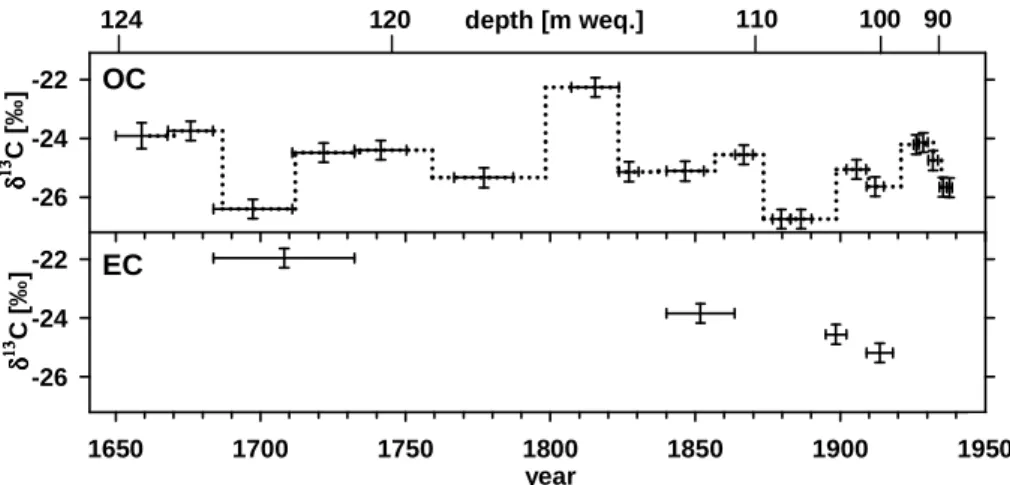
3.3 Record of δ13C
25
In Fig. 4 the δ13C records of OC and EC are presented. No long-term trend was ob-served in the δ13C of OC. The average is −24.9±1.1 (1σ), a value typical for biogenic
ACPD
6, 5905–5931, 2006
Ice core record of carbonaceous aerosols T. M. Jenk et al. Title Page Abstract Introduction Conclusions References Tables Figures J I J I Back Close
Full Screen / Esc
Printer-friendly Version Interactive Discussion
emissions from C3-plants (Boutton, 1991). However, excluding the two samples repre-senting the years around 1700 and 1810, which were probably influenced by airborne mineral dust (see discussion below), the record nicely follows the structure of the14C (OC) and (EC) records in Fig. 3. In OC, we found a significant correlation between fM and δ13C with r2=0.35 (n=14, 95% confidence limit). By interpolation of this linear
5
regression we determined δ13C values for pure biogenic and fossil OC with −24.3±0.4 and −28.2±1.2, respectively. Only few studies exist, discussing how mixing of biogenic and fossil carbon sources is reflected in a δ13C variation. Our results are in agree-ment and within the same range of today’s knowledge that a relatively low δ13C value corresponds to carbon derived from fossil sources (e.g. Pataki et al., 2003; Widory et
10
al., 2004; Loh et al., 2004). For EC, going back in time, the record reveals a trend to samples which are less13C depleted (1900: −25.2±0.3; 1850: −23.8±0.3). This might reflect a decreased anthropogenic influence by fossil carbon (Pataki et al., 2003).
The δ13C (EC) was further analysed in order to understand the possible influence of mineral dust to the EC records discussed in Sects. 3.1 and 3.2. A fossil contribution to
15
EC with about 50% before 1850 seems unlikely as fossil fuels just started to become an important energy source at this time (Sect. 3.2). Saharan dust events are often ob-served in Alpine ice cores (Schwikowski et al., 1995) and were visually (v) and chem-ically (c, high Ca2+ concentration) detected in the FH ice core in the years 1934 (v), 1912/13 (v), 1823 (v, c), 1800 (v) and 3 events between 1710 and 1746 (c). The
mea-20
sured δ13C value of the particular EC sample including Saharan dust (1680–1730) was −22.0±0.3, which is significantly higher than observed for the anthropogenic influenced samples (see above). Eglinton et al. (2002) describes that dust from Sahara and Sahel regions are a natural source of old particulate matter (PM) with high δ13C values. We assume, that the fM (EC) values analysed for the time before 1850 (Sect. 3.2, Fig. 3),
25
as well as the high concentrations analysed in the EC samples (Sect. 3.1, Fig. 2) are caused by mineral dust events rather than reflecting anthropogenic emissions. In sam-ples with high loading of mineral dust, we probably can not fully exclude an artefact to the records due to carbonates, although, they were dissolved with HCl during
prepa-ACPD
6, 5905–5931, 2006
Ice core record of carbonaceous aerosols T. M. Jenk et al. Title Page Abstract Introduction Conclusions References Tables Figures J I J I Back Close
Full Screen / Esc
Printer-friendly Version Interactive Discussion
EGU
ration of the samples (Sect. 2.2) and such an artefact is thought to be negligible at the applied EC combustion temperature of 650◦C (Petzold and Niessner, 1995). The dust layers identified in the 20th century were not reflected in the EC records. This seems reasonable as this influence should be covered by the additional anthropogenic emissions in these more recent samples. No evidence was found, that Saharan dust
5
layers or carbonates do affect the fM (OC) record. The behaviour of the δ13C OC values analysed for samples including dust events remains unexplained (1680–1710: −26.4±0.3; 1710–1730: −24.5±0.3; 1810–1825: −22.3±0.3). They might indicate dif-ferent source regions of the dust. The dimension of influence of mineral dust layers on the14C/12C ratio of EC samples and on measured concentrations of CP should be
10
further investigated.
3.4 Apportionment of emission sources
Based on the concentration and the corresponding fM, we calculated source dependent concentrations of OC and EC. When14C was not analysed, the averaged values for the according time periods as presented in Table 1 were used for calculation (fM=0.61 was
15
used for EC before 1850). Absolute values presented in the following for the biogenic and fossil OC (OCb, OCf) and EC (ECb, ECf) fractions have an uncertainty of ±8% and ±21%, respectively (estimated by error propagation of the averaged uncertainties of concentration and14C determination). To obtain representative background condi-tions, samples influenced by mineral dust were not included (Sect. 3.3). In Fig. 5, the
20
results are presented and compared with concentration records of specific chemical tracers of ammonium (NH+4) and sulfate (SO2−4 ), which are attributed to either biogenic or anthropogenic sources. Overall results are summarized in Table 1. Ammonium is a tracer of forest fires (Levine et al., 1992) but is also related to emissions from agriculture and vegetation. Sulfate originates from different natural and anthropogenic
25
sources. ExSO2−4 is the total SO2−4 corrected for the sea-salt and mineral dust contribu-tion and is assumed to originate exclusively from oxidacontribu-tion of SO2 in the atmosphere with mainly anthropogenic sources in the last 150 years (Schwikowski et al., 1999b).
ACPD
6, 5905–5931, 2006
Ice core record of carbonaceous aerosols T. M. Jenk et al. Title Page Abstract Introduction Conclusions References Tables Figures J I J I Back Close
Full Screen / Esc
Printer-friendly Version Interactive Discussion
OCbconcentrations show no trend, but rather large variations over the analysed time period (1650–1940). The two periods with significantly higher concentrations found in the 1670s and around 1850 are discussed in Sect. 3.5. Excluding these two periods, a biogenic background (level before 1800) of OCbwas 21 µg kg−1. With exception for the two peaks mentioned above, OCbcorrelates with the NH+4 concentration, especially for
5
the time after 1850, indicating common sources such as the extensive use of wood as bio-fuel or increased agricultural activity. For ECb, the biogenic background level was 6 µg kg−1. No correlation between OCb and ECbwas found. This seems reasonable as OCbreflects gaseous or particulate emissions from vegetation and gaseous precur-sors from biomass burning, whereas ECb is emitted exclusively during combustion of
10
biomass.
For OCf and ECf the natural background level was below 3 µg kg−1(detection limit) and 4 µg kg−1, respectively. Both fractions strongly increased after 1870 comparable to exSO2−4 and black carbon (BC) emissions from hard coal and petroleum combus-tion estimated for Switzerland and surrounding countries (Penner et al., 1993). The
15
OCf peak in the 1840s can be assumed as an artefact derived from the very high OC concentration in the according sample. The rapid increase in OCf between 1870 and 1900 can be explained by a local source (for detailed discussion see Sect. 3.5). After 1925 a second strong increase in OCf was observed along with the onset of a strongly increased consumption of petroleum in Europe (1916–1925: 0.82 Tg a−1; 1926–1935:
20
9.37 Tg a−1) whereas the consumption of hard coal remained relatively constant on a much higher level (1916–1925: 773 Tg a−1; 1926–1935: 873 Tg a−1) (Penner et al., 1993). This suggests that the combustion of petroleum results in much higher emis-sions of OCf than the combustion of hard coal. For 1940, the additional input from anthropogenic sources was 34±1 µg kg−1and 49±9 µg kg−1for OCf and ECf,
respec-25
tively, equivalent to an increase from the natural fossil carbon background of about a factor 10 for both fractions. As discussed in Sect. 3.2, these samples are similar to recent urban aerosol samples from Z ¨urich, based on their fossil fraction.
ACPD
6, 5905–5931, 2006
Ice core record of carbonaceous aerosols T. M. Jenk et al. Title Page Abstract Introduction Conclusions References Tables Figures J I J I Back Close
Full Screen / Esc
Printer-friendly Version Interactive Discussion
EGU
3.5 Special events
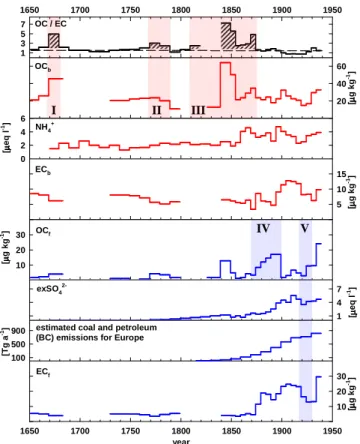
Four episodes are discussed in detail (Fig. 5: red (I–III) and blue (IV–V)):
I–III) High OC/EC ratios are generally observed for the combustion of wood (Szidat et al., 2006). For the OC/EC ratio we defined an average value of 1.5±0.3 (1σ). This value is significantly different in the 1670s (I: 4.9,), from 1770 to 1790 (II: 2.7), in the
5
1810s and in 1840–1875 (III: 2.5 and 4.7). Ice core data from Mt. Logan together with other data suggest a hemispheric signal of the rapid rise of biomass clearing and burning associated with agrarian activities in Northern America (Holdsworth et al., 1996). In the Mt. Logan core, this event was observed in BC concentrations. However, the peaks are in good agreement with the here observed increase in OC concentrations
10
and in elevated OC/EC ratios after 1800 and around 1850 (III). For the peak around 1780 (II), we assume a regional, much smaller source of wood combustion based on the lower OC concentration and OC/EC ratio. The signal observed in the second half of the 17th century (I) looks similar to III. There is no detailed knowledge or data about large land clearing and forest fires which could have led to a hemispheric or at least
15
continental signal for these times.
IV) Between 1870 and 1900 we observed strongly increasing and finally very high OCf concentrations (factor 8 higher than the natural background). The lowest fM mea-sured during this time period was 0.2 compared to 0.6 in recent aerosol samples from Z ¨urich. Prepared filters from these ice layers showed a black coating, visibly different
20
from a normally observed beige, brown, or slightly grey colouring. After 1870, the rail-way around Interlaken (B ¨odelibahn, 1872–1874) was integrated into the Swiss railrail-way network (1888, 1890). After 1991, four mountain railways (M ¨urren, 1891; Schynige Platte, 1893; Wengeneralp, 1893; Kleine Scheidegg, 1893, 2000 m a.s.l.) were built (Pfister, 1995), all of them located within 10 to 20 km of the FH (see Fig. 1). They were
25
operated by steam locomotives, which were most probably the sources for the ob-served high OCf concentrations during this time. The decrease of OCf concentrations is explained by the stepwise electrification of these railways after 1900.
ACPD
6, 5905–5931, 2006
Ice core record of carbonaceous aerosols T. M. Jenk et al. Title Page Abstract Introduction Conclusions References Tables Figures J I J I Back Close
Full Screen / Esc
Printer-friendly Version Interactive Discussion
V) The decreased consumption of fossil fuels during the 1920s due to the world economic crisis is clearly visible in ECf, whereas it is less pronounced in the sulphate record and seems to be underestimated by the reconstructed emission data. As dis-cussed for OCf (Sect. 3.4), one can assume that at least some part of this observed decrease is reflecting the transition from hard coal to petroleum.
5
4 Conclusions
A long-term record of the two water insoluble main fractions of carbonaceous particles (EC and water-insoluble OC) is presented, based on the analysis of ice core sam-ples extracted from the Fiescherhorn glacier in Switzerland. A new method, combining concentration measurements and 14C AMS analysis of these fractions was applied
10
for the first time on ice samples, covering the time period 1650–1940. This method allowed a distinction between the biogenic and anthropogenic contribution in ancient carbonaceous particles. OC was found to be of pure biogenic origin before 1800. Con-centrations in 1940 were more than a factor of 3 above the natural background level of 21±2 µg kg−1ice. This can be mainly attributed to the additional anthropogenic
contri-15
bution from the combustion of fossil fuels with about 46%. For pure biogenic and pure fossil OC we determined a δ13C value of −23.4±0.4 and −28.4±1.2, respectively. This parameter showed to be an additional and useful tracer for different biogenic and fossil carbon emissions, as a mixing of sources leads to a variation in δ13C. A biogenic EC background concentration was determined as 6±1 µg kg−1 ice. In 1940, the fossil
con-20
tribution to EC was 81±2%. Thus, the additional anthropogenic input of atmospheric EC could be determined with 49±9 µg kg−1ice for this time.
Acknowledgements. We thank the Swiss National Science Foundation for supporting this study
through its National Center of Competence in Research (NCCR) in Climate. We are grateful to the Paul Scherrer Institut and the Swiss Federal Institute of Technology, jointly operating the
25
Z ¨urich AMS facilities. Special thanks go to the members of the expedition, who made this study possible by the extraction of the Fiescherhorn-Glacier ice core under harsh conditions.
ACPD
6, 5905–5931, 2006
Ice core record of carbonaceous aerosols T. M. Jenk et al. Title Page Abstract Introduction Conclusions References Tables Figures J I J I Back Close
Full Screen / Esc
Printer-friendly Version Interactive Discussion
EGU
References
Baltensperger, U., Schwikowski, M., Jost, D. T., G ¨aggeler, H. W., and Poulida, O.: Scavenging of atmospheric constituents in mixed phase clouds at the high-alpine site Jungfraujoch; Part I: Basic concept and cloud scavenging, Atmos. Environ., 32, 3975–3983, 1998.
Bazhev, A. M., Rototaeva, O., Heintzenberg, J., Stenberg, M., and Pinglot, J. F.: Phyiscal and
5
chemical studies in the region of the southern slope of Mount Elbrus, Caucasus, J. Glaciol., 44, 214–222, 1998.
Boutton, T. W.: Stable carbon isotope ratios of natural materials: II. Atmospheric, terrestrial, marine and freshwater environments, in: Carbon Isotope Techniques, edited by: Coleman, D. C. and Fry, B., San Diego, Academic Press, 173–185, 1991.
10
Brimblecombe, P: The Big Smoke, Methunen, London, 1987.
Cachier, H. and Pertuisot, M. H.: Particulate carbon in Arctic ice, Analysis Magazine, 22, 34–37, 1994.
Chylek, P., Johnson, B., and Wu, H.: Black carbon concentration in a Greenland DYE-3 ice core, Geophys. Res. Lett., 19, 1951–1953, 1992.
15
Chylek, P., Johnson, B., Damiano, P. A., Taylor, K. C., and Clement, P.: Biomass burning record and black carbon in the GISP2 ice core, Geophys. Res. Lett., 22, 89–92, 1995.
Clarke, A. D. and Noone, K. J.: Soot in the arctic snowpack: A cause for perturbations in radiative transfer, Atmos. Environ., 19, 2045–2053, 1985.
Crutzen, P. J. and Ramanathan, V.: The parasol effect on climate, Science, 302, 1679–1680,
20
2003.
Currie, L. A.: Evolution and multidisciplinary frontiers of14C aerosol science, Radiocarbon, 42, 115–126, 2000.
Davidson, I. C., Phalen, R. F., and Solomon, P. A.: Airborne Particulate Matte rand Human Health: A Review, Aerosol. Sci. Technol., 39, 737–749, 2005.
25
Eglinton, T. I., Eglinton, G., Dupont, L., Sholkovitz, E. R., Montlucon, D., and Reddy, C. M.: Composition, age and provenance of organic matter in NW African dust over the Atlantic Ocean, Geochem. Geophys. Geosyst., 3, 8, doi:10.1029/2001GC000269, 2002.
Eichler, A., Schwikowski, M., G ¨aggeler, H. W., Furrer, V., Synal, H.-A., Beer, J., Sauer, M., and Funk, M.: Glaciochemical dating of an ice core from the upper Grenzgletscher (4200 m a.s.l.),
30
J. Glaciol., 46, 507–515, 2000.
ACPD
6, 5905–5931, 2006
Ice core record of carbonaceous aerosols T. M. Jenk et al. Title Page Abstract Introduction Conclusions References Tables Figures J I J I Back Close
Full Screen / Esc
Printer-friendly Version Interactive Discussion
balance and the rise of continental spring temperatures, Science, 263, 198–200, 1993. Hansen, J. E. and Sato, M.: Trends of measured climate forcing agents, PNAS, 98, 14 778–
14 783, 2001.
Hansen, J. and Nazarenko, L.: Soot climate forcing via snow and ice albedos, Proceedings of the National Academy of Sciences, 101(2), 423–428, 2004.
5
Haywood, J. M., Roberts, D. L., Slingo, A., Edwards, J. M., and Shine, K. P.: General circulation model calculations of the direct radiative forcing by anthropogenic sulfate and fossil-fuel soot aerosol, J. Clim., 10, 1562–1577, 1997.
Holdsworth, G., Higuchi, K., Zielinski, G. A., Mayewski, P. A., Wahlen, M., Deck, B., Chylek, P., Johnson, B., and Damiano, P.: Historical biomass burning: Late 19th century pioneer
agri-10
culture revolution in northern hemispheric ice core data and its atmospheric interpretation, J. Geophys. Res., 101, 23 317–23 334, 1996.
Hua, Q., Zoppi, U., Williams, A., and Smith, A.: Small-mass AMS radiocarbon analysis at ANTARES, Nucl. Instr. Meth. Phys. Res. B, 223, 284–292, doi:10.1016/j.nimb.2004.04.057, 2003.
15
Huber, T.: Bestimmung historischer Spurenstoffverl¨aufe in alpinem Firn mittels kontinuierlicher Ionenchromatographischer Analyse, PhD Thesis, University of. Bern, 2001.
Intergovernmental Panel on Climate Change (IPCC), Third Assessment Report, Climate Change 2001: The Scientific Basis, edited by: Houghton, J. T., Ding, Y., Griggs, D. J., et al., Cambridge Univ. Press, New York, 2001.
20
Jacobsen, M. C., Hansson, H.-C., Noone, K. J., and Charlson, R. J.: Organic atmospheric aerosols: review and state of the science, Rev. Geophys., 38(2), 267–294, 2000.
Jacobson, M. Z.: Control of fossil-fuel particulate carbon and organic matter. Possibly the most effective method of slowing global warming, J. Geophys. Res., 107(D19), 4410–4431, doi:10.1029/2001JD001376, 2002.
25
Jacobson, M. Z.: Climate response of fossil fuel and biofuel soot, accounting for soot’s feedback to snow and sea ice albedo and emissivity, J. Geophys. Res., 109, D21201, doi:10.1029/2004JD004945, 2004.
Lavanchy, V. M. H., G ¨aggeler, H. W., Schotterer, U., Schwikowski, M., and Baltensperger, U.: Historical record of carbonaceous particle concentrations from a European high-alpine
30
glacier (Colle Gnifetti, Switzerland), J. Geophys. Res., 104(D), 21 227–21 236, 1999a. Lavanchy, V. M. H., G ¨aggeler, H. W., Nyeki, S., and Baltensperger, U.: Elemental carbon (EC)
ACPD
6, 5905–5931, 2006
Ice core record of carbonaceous aerosols T. M. Jenk et al. Title Page Abstract Introduction Conclusions References Tables Figures J I J I Back Close
Full Screen / Esc
Printer-friendly Version Interactive Discussion
EGU
high alpine research station Jungfraujoch, Atmos. Environ., 33, 2759–2769, 1999b.
Lemire, K. R., Allen, D. T., Klouda, G. A., and Lewis, C. W.: Fine particulate matter source attribution for Southeast Texas using 14C/13C ratios, J. Geophys. Res., 107, 4613–4619, 2002.
Levine, J. S., Cofer III, W. S., Sebacher, D. I., Rhinehart, R. P., Winstead, E. L., Sebacher, S.,
5
Hinkle, C. R., Schmaltzer, P. A., and Koller, Jr A. M.: The effects of fire on biogenic emissions of methane and nitric oxide from wetlands, J. Geophys. Res., 95, 1853–1864 1992.
Loh, A. I., Bauer J. E., and Druffel, R. M.: Variable ageing and storage of dissolved organic components in the open ocean, Nature, 430, 877–881, doi:10.1038/nature02780, 2004. Novakov, T. and Penner, J. E.: Large contribution of organic aerosols to
cloud-condensation-10
nuclei concentrations, Nature, 365, 823–826, 1993.
Pataki, D. E., Bowling, D. R., and Ehleringer, J. R.: Seasonal cycle of carbon dioxide and its isotopic composition in an urban atmosphere: Anthropogenic and biogenic effects, J. Geophys. Res., 108(D23), 473–4742, doi:10.1029/2003JD003865, 2003.
Penner, J. E., Eddlemann, H., and Novakov, T.: Towards the Devlopement of a global Inventory
15
for Black Carbon Emissions, Atmos. Environ., 27A, 1277–1297, 1993.
Penner, J. E., Charlson, R. J., Hales, J. M., Laulainen, N. S., Leifer, R., Novakov, T., Ogren, J., Radke, L. F., Schwartz, S. E., and Travis, L.: Quantifying and minimizing uncertainty of climate forcing by anthropogenic aerosols, Bull. Am. Meteorol. Soc., 75, 375–400, 1994. Petzold, A. and Niessner, R.: Method comparison study on soot-selective techniques,
20
Mikrochim. Acta, 117, 215–237, 1995.
Pfister, C.: Geschichte des Kantons Bern seit 1798, Bd. IV, Im Strom der Modernisierung. Bev ¨olkerung, Wirtschaft und Umwelt 1700–1914, Historischer Verein, Bern, 1995.
Reddy, C. M., Pearson, A., Xu, L., McNichol, A. P., Benner, Jr. B. A., Wise, S. A., Klouda, G. A., Currie, L. A., and Eglinton, T. I.: Radiocarbon as a tool to apportion the sources of polycyclic
25
aromatic hydrocarbons and black carbon in environmental samples, Environ. Sci. Technol., 36, 1774–1782, 2002.
Reimer, P. J., Baillie, M. G. L., Bard, E., Bayliss, A., Beck, J. W., Bertrand, C., Blackwell, P. G., Buck, C. E., Burr, G., Cutler, K. B., Damon, P. E., Edwards, R. L., Fairbanks, R. G., Friedrich, M., Guilderson, T. P., Hughen, K. A., Kromer, B., McCormac, F. G., Manning, S.,
Bronk-30
Ramsey, C., van der Plicht, J., and Weyhenmeyer, C. E.: IntCal04 terrestrial radiocarbon age calibraion, 0-26 cal kyr BP, Radiocarbon, 46, 1029–1058, 2004.
ACPD
6, 5905–5931, 2006
Ice core record of carbonaceous aerosols T. M. Jenk et al. Title Page Abstract Introduction Conclusions References Tables Figures J I J I Back Close
Full Screen / Esc
Printer-friendly Version Interactive Discussion
alpine ice cores: do they record climate variability?, Proc. Intern. Conf. on Isotope Tech-niques in the Study of Environmental Change, IAEA Vienna, 1998.
Schwerzmann, A., Funk, M., Blatter, H., L ¨uthi, M., Schwikowski, M., and Palmer, A.: A method to reconstruct past accumulation rates in alpine firn regions: A study on Fiescherhorn, Swiss Alps., J. Geophys. Res., 111, F01014, doi:10.1029/2005JF000283, 2006.
5
Schwikowski, M., Seibert, P., Baltensperger, U., and G ¨aggeler, H. W.: A study of an outstanding Saharan dust event at the high-alpine site Jungfraujoch, Switzerland, Atmos. Environ., 29, 1829–1842, 1995.
Schwikowski, M., Br ¨utsch, S., G ¨aggeler, H. W., and Schotterer, U.: A high-resolution air chem-istry record from an Alpine ice core: Fiescherhorn glacier, Swiss Alps, J. Geophys. Res.,
10
104, 13 709–13 719, 1999a.
Schwikowski, M., D ¨oscher, A., G ¨aggeler, H. W., and Schotterer, U.: Anthropogenic versus natural sources of atmospheric sulphate from an Alpine ice core, Tellus B , 51, 938–951, 1999b.
Sharma, S., Lavou ´e, D., Cachier, H., Barrie, L. A., and Gong, S. L.: Long-term trends of the
15
black carbon concentrations in the Canadian Arctic, J. Geophys. Res.-Atmos., 109, D15203, doi:10.1029/2003JD004331, 2004.
Slater, J. F., Currie, L. A., Dibb, J. E., and Benner, Jr. B.A.: Distinguishing the relative con-tribution of fossil fuel and biomass combustion to aerosols deposited at Summit, Grenland through isotopic and molecular characterization of insoluble carbon, Atmos. Environ., 36,
20
4463–4477, 2002.
Stuiver, M. and Polach, H. A.: Discussion: Reporting of14C Data Radiocarbon, 19, 355–363, 1977.
Synal, H.-A., Jacob, S., and Suter, M.: The PSI/ETH small radiocarbon dating system, Nucl. Instr. Meth. Phys. Res. B, 172, 1–7, 2000.
25
Szidat, S., Jenk, T. M., G ¨aggeler, H. W., Synal, H.-A., Fisseha, R., Baltensperger, U., Kalberer, M., Samburova, V., Wacker, L., Saurer, M., Schwikowski, M., and Hajdas, I.: Source ap-portionment of Aerosols by14C measurements in different carbonaceous particle fractions, Radiocarbon, 46, 475–484, 2004a.
Szidat, S., Jenk, T. M., G ¨aggeler, H. W., Synal, H.-A., Fisseha, R., Baltensperger, U., Kalberer,
30
M., Samburova, V., Reimann, S., Kasper-Giebl, A., and Hajdas, I.: Radiocarbon (14 C)-deduced biogenic and anthropogenic contributions to organic carbon (OC) of urban aerosols from Z ¨urich, Switzerland, Atmos. Environ., 38, 4035–4044, 2004b.
ACPD
6, 5905–5931, 2006
Ice core record of carbonaceous aerosols T. M. Jenk et al. Title Page Abstract Introduction Conclusions References Tables Figures J I J I Back Close
Full Screen / Esc
Printer-friendly Version Interactive Discussion
EGU
Szidat, S., Jenk, T. M., G ¨aggeler, H. W., Synal, H.-A., Hajdas, I., Bonani, G., and Saurer, M.: THEODORE, a two-step heating system for the EC/OC determination of radiocarbon (14C) in the environment, Nucl. Instr. Meth. Phys. Res. B, 223–224, 829–836, 2004c.
Szidat, S., Jenk, T. M., Synal, H.-A., Kalberer, M., Wacker, L., Hajdas, I., Kasper-Giebl, A., and Baltensperger, U.: Contributions of fossil fuel, biomass burning, and biogenic
emis-5
sions to carbonaceous aerosols in Z ¨urich as traced by14C, J. Geophys. Res., 111, D07206, doi:10.1029/2005JD0065902006, 2006.
Thompson, L. G., Davis, M. E., Mosley-Thompson, E., Sowers, T. A., Henderson, K. A., Zagorodnov, V. S., Lin, P.-N., Mikhalenko, V. N., Campen, R. K., Bolzan, J. F., Cole-Dai, J., Francou, B.: A 25 000-Year Tropical Climate History from Bolivian Ice Cores, Science,
10
282, 1858–1864, doi: 10.1126/science.282.5395.1858, 1998.
Widory, D., Roy, S., LeMoullec, Y., Goupil, G., Cocherie, A., and Guerrot, C.: The origin of atmospheric particles in Paris: a view through carbon and lead isotopes, Atmos. Environ., 38, 953–961, 2004.
ACPD
6, 5905–5931, 2006
Ice core record of carbonaceous aerosols T. M. Jenk et al. Title Page Abstract Introduction Conclusions References Tables Figures J I J I Back Close
Full Screen / Esc
Printer-friendly Version Interactive Discussion
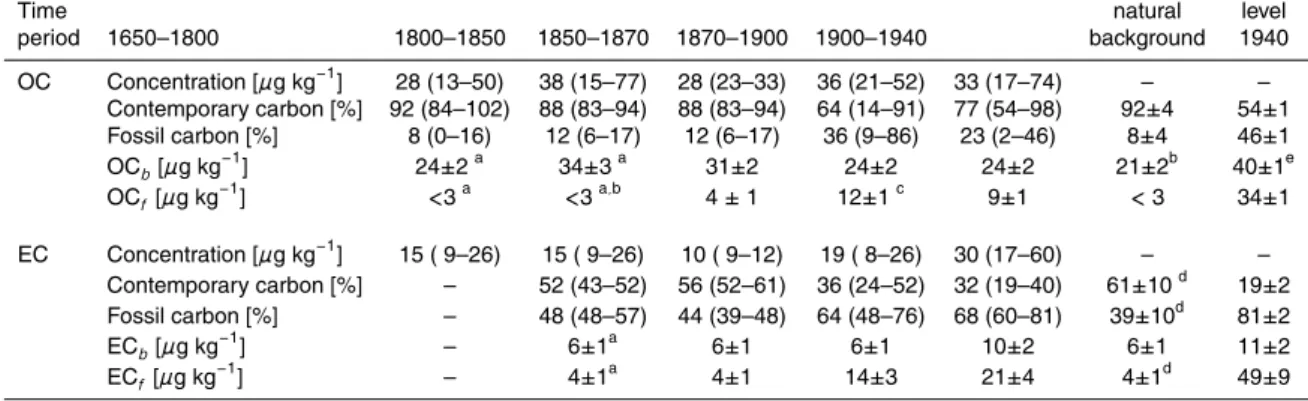
Table 1. The biogenic and anthropogenic carbon contribution to OC and EC in the past is presented together with the natural background and the levels observed for 1940. Given are averages for the indicated time periods including the observed range (in brackets) or the uncer-tainty (±1σ). OCb, OCf, ECb, ECf denote the biomass and fossil contribution to the OC and EC concentration, respectively.
Time natural level
period 1650–1800 1800–1850 1850–1870 1870–1900 1900–1940 background 1940 OC Concentration [µg kg−1] 28 (13–50) 38 (15–77) 28 (23–33) 36 (21–52) 33 (17–74) – – Contemporary carbon [%] 92 (84–102) 88 (83–94) 88 (83–94) 64 (14–91) 77 (54–98) 92±4 54±1 Fossil carbon [%] 8 (0–16) 12 (6–17) 12 (6–17) 36 (9–86) 23 (2–46) 8±4 46±1 OCb[µg kg −1 ] 24±2a 34±3a 31±2 24±2 24±2 21±2b 40±1e OCf[µg kg −1 ] <3a <3a,b 4 ± 1 12±1c 9±1 < 3 34±1 EC Concentration [µg kg−1] 15 ( 9–26) 15 ( 9–26) 10 ( 9–12) 19 ( 8–26) 30 (17–60) – – Contemporary carbon [%] – 52 (43–52) 56 (52–61) 36 (24–52) 32 (19–40) 61±10d 19±2 Fossil carbon [%] – 48 (48–57) 44 (39–48) 64 (48–76) 68 (60–81) 39±10d 81±2 ECb[µg kg−1] – 6±1a 6±1 6±1 10±2 6±1 11±2 ECf[µg kg −1 ] – 4±1a 4±1 14±3 21±4 4±1d 49±9 a
periods influenced by dust are excluded (Sect. 3.3)
b
period of extremely high OC concentrations due to forest fires excluded (Sect. 3.5)
c
period influenced by local source (Sect. 3.5)
d
level 1850 (most probably not the natural background)
e
no trend to higher levels was observed over time, thus this higher value is explained by large fluctuations in OCb
ACPD
6, 5905–5931, 2006
Ice core record of carbonaceous aerosols T. M. Jenk et al. Title Page Abstract Introduction Conclusions References Tables Figures J I J I Back Close
Full Screen / Esc
Printer-friendly Version Interactive Discussion EGU
Switzerland
FH CGGermany
Austria
Italy
JFJ InterlakenEUROPE
EUROPE
ZürichFrance
0 75 km 1508°
6°
10°
47°
46°
6°
8°
10°
47°
46°
x xFig. 1. Map of Switzerland and neighbouring European countries. Indicated are the FH and Colle Gnifetti (CG) drilling sites (triangles), the high alpine research station JFJ (open circle), the region of local emissions from mountain railways (shaded area) and the two cities Interlaken and Z ¨urich (x).
ACPD
6, 5905–5931, 2006
Ice core record of carbonaceous aerosols T. M. Jenk et al. Title Page Abstract Introduction Conclusions References Tables Figures J I J I Back Close
Full Screen / Esc
Printer-friendly Version Interactive Discussion 1650 1700 1750 1800 1850 1900 1950 20 40 60 20 40 60 OC [µµµµg kg -1 ] EC [µµµµg kg-1] year depth [m weq.] 124 120 110 100 90
Fig. 2. Records of water-insoluble OC and EC concentrations in µg kg−1 ice for the years 1650–1940 (89–124 m weq). Shown is a weighted average (solid line) of the individual analysed samples (open circles). Uncertainties (1σ) of single measurements are indicated as error bars. The resolution of this average is 5 years back to 1850 and 10 years back to 1650, according to the resolution of the individual samples (horizontal bars).
ACPD
6, 5905–5931, 2006
Ice core record of carbonaceous aerosols T. M. Jenk et al. Title Page Abstract Introduction Conclusions References Tables Figures J I J I Back Close
Full Screen / Esc
Printer-friendly Version Interactive Discussion EGU year 1650 1700 1750 1800 1850 1900 1950 0.0 0.5 1.0 O C [ fM ] E C [ fM ] depth [m weq.] Zürich aerosol 2002 Zürich aerosol 2002 anthropogenic 124 120 110 100 90 0.0 0.5 1.0 anthropogenic biogenic biogenic Zürich aerosol 2002
Fig. 3. OC and EC fM-records for the years 1650-1940 (fM is always related to the year of deposition). Shown is a weighted average (solid line) of the individual analysed samples (open circles) (resolution see Fig. 2). For single measurements, overall uncertainties of 14C AMS analysis (1σ) are indicated as error bars. Triangles give annual mean values for recent aerosol (Z ¨urich, 2002, Fig. 1) (Szidat et al., 2006). Both records, fM (OC) and (EC), are reflecting the increased combustion of fossil fuels after the beginning of the industrialisation around 1860– 1870.
ACPD
6, 5905–5931, 2006
Ice core record of carbonaceous aerosols T. M. Jenk et al. Title Page Abstract Introduction Conclusions References Tables Figures J I J I Back Close
Full Screen / Esc
Printer-friendly Version Interactive Discussion 1650 1700 1750 1800 1850 1900 1950 -26 -24 -22 -26 -24 -22 δδδδ 11113333 C [ ‰ ] EC depth [m weq.] year OC δδδδ 11113333 C [ ‰ ] 124 120 110 100 90
Fig. 4. δ13C-records of OC and EC for the years 1650-1940. Vertical error bars indicate overall uncertainties of IRMS analysis (1σ), horizontal bars indicate the sample resolution along the ice core. Small dots are used to guide the eye.
ACPD
6, 5905–5931, 2006
Ice core record of carbonaceous aerosols T. M. Jenk et al. Title Page Abstract Introduction Conclusions References Tables Figures J I J I Back Close
Full Screen / Esc
Printer-friendly Version Interactive Discussion EGU [ µµµµ e q l -1] 0 2 4 6 NH4 + [ µµµµ g k g -1] 0 20 40 60 0 10 20 30 40 1 4 7 year 1650 1700 1750 1800 1850 1900 1950 0 10 20 30 40 0 5 10 15 20 OCb OCf exSO4 2- [µµµµeq l-1] ECf ECb [T g a -1] 100 500
900 estimated coal and petroleum
(BC) emissions for Europe
1650 1700 1750 1800 1850 1900 1950 1 3 5 7 OC / EC exSO4 2-[ µµµµ g k g -1] [ µµµµ g k g -1] [µµµµ e q l -1] [ µµµµ g k g -1] IV III II I V
Fig. 5. Records of different tracers for biogenic emissions (red) and anthropogenic emissions (blue) together with the OC/EC ratio for the years 1650–1940. OCband ECbrepresent the bio-genic and OCf and ECf the fossil contribution to these fractions. The uncertainties of the pre-sented concentration curves are 8% and 21% for OCb/f and ECb/f, respectively. The hatched areas in the OC/EC ratio record indicate events of wood combustion. The red coloured (I–III) and blue coloured areas (IV–V) high-light special events (see Sect. 3.5).