Publisher’s version / Version de l'éditeur:
Journal of Thermal Insulation and Building Envelopes, 18, OCT, pp. 128-144,
1994-10
READ THESE TERMS AND CONDITIONS CAREFULLY BEFORE USING THIS WEBSITE. https://nrc-publications.canada.ca/eng/copyright
Vous avez des questions? Nous pouvons vous aider. Pour communiquer directement avec un auteur, consultez la première page de la revue dans laquelle son article a été publié afin de trouver ses coordonnées. Si vous n’arrivez pas à les repérer, communiquez avec nous à PublicationsArchive-ArchivesPublications@nrc-cnrc.gc.ca.
Questions? Contact the NRC Publications Archive team at
PublicationsArchive-ArchivesPublications@nrc-cnrc.gc.ca. If you wish to email the authors directly, please see the first page of the publication for their contact information.
NRC Publications Archive
Archives des publications du CNRC
This publication could be one of several versions: author’s original, accepted manuscript or the publisher’s version. / La version de cette publication peut être l’une des suivantes : la version prépublication de l’auteur, la version acceptée du manuscrit ou la version de l’éditeur.
For the publisher’s version, please access the DOI link below./ Pour consulter la version de l’éditeur, utilisez le lien DOI ci-dessous.
https://doi.org/10.1177/109719639401800204
Access and use of this website and the material on it are subject to the Terms and Conditions set forth at
Calibration of a heat flow meter apparatus
Lackey, J. C.; Normandin, N.; Marchand, R. G.; Kumaran, M. K.
https://publications-cnrc.canada.ca/fra/droits
L’accès à ce site Web et l’utilisation de son contenu sont assujettis aux conditions présentées dans le site LISEZ CES CONDITIONS ATTENTIVEMENT AVANT D’UTILISER CE SITE WEB.
NRC Publications Record / Notice d'Archives des publications de CNRC:
https://nrc-publications.canada.ca/eng/view/object/?id=3295fc5b-09f4-46a3-b8e5-8103b412ba44 https://publications-cnrc.canada.ca/fra/voir/objet/?id=3295fc5b-09f4-46a3-b8e5-8103b412ba44http://www.nrc-cnrc.gc.ca/irc
Ca libra t ion of a he a t flow m e t e r a ppa ra t us
N R C C - 3 7 9 0 6
L a c k e y , J . C . ; N o r m a n d i n , N . ; M a r c h a n d , R . G . ;
K u m a r a n , M . K .
O c t o b e r 1 9 9 4
A version of this document is published in / Une version de ce document se trouve dans:
Journal of Thermal Insulation and Building Envelopes, 18, (OCT), pp. 128-144,
October, 1994, DOI:
10.1177/109719639401800204The material in this document is covered by the provisions of the Copyright Act, by Canadian laws, policies, regulations and international agreements. Such provisions serve to identify the information source and, in specific instances, to prohibit reproduction of materials without written permission. For more information visit http://laws.justice.gc.ca/en/showtdm/cs/C-42
Les renseignements dans ce document sont protégés par la Loi sur le droit d'auteur, par les lois, les politiques et les règlements du Canada et des accords internationaux. Ces dispositions permettent d'identifier la source de l'information et, dans certains cas, d'interdire la copie de documents sans permission écrite. Pour obtenir de plus amples renseignements : http://lois.justice.gc.ca/fr/showtdm/cs/C-42
Calibration of a Heat Flow
Meter Apparatus
JOHN LACKEY, NICOLE NORMANDIN, ROGER MARCHAND AND KUMAR KUMARAN
Building Performame Laboratory Institute for Research in Construction
National Research Council Canada Ottawa, Ontario
KIA OR6 Canada
ABSTRACf: A series of calibration measurements was done on a 600 mm X 600 mm heat flow meter apparatus. Several specimens of medium density glass £tber in-sulation and expanded polystyrene inin-sulation were used as transfer standards. The thickness of these transfer standards varied from 25 to 160 mm. The mean tempera-ture varied from 0 to 40°C and the temperatempera-ture difference across the insulation spec-imens varied from 10 to 40 K. Measurements included cases in which the ambient temperature of the tcst assembly was either maintained within 1 K of the mean tem-perature, or those with only edge insulation, and an enclosure for the whole test assembly in order to reduce the edge heat losses. A total of91 sets of measurements were made. Each set of measurements included two sub-sets, one for the
warmer(hot) plate and the other for the colder(cold) plate and each sub-set included
a heat flow transducer output and the temperatures on either side of the transducer assembly. For 90 out of the 91 sets of measurements, the steady state heat flux across the specimen was correlated, with a standard deviation of2%, to a simple linear rela-tion between the average transducer output and the average of the surface tempera-tures of the two transducer assemblies.
INTRODUCTION
T
HE HEAT FLOW meter apparatus is widely used to measure the thermal resistance ofinsulating materials. 'lYe and McElroy[I] have commented on this as follows. "It is, in every respect, a very good technique for evaluat-128 J. THERMAL 'NSUL. AND 8LDG. ENVS. Volume 18- October 19941065-27441941020128-17 $06.00/0
Calibration of a Heat Flow Meter Apparatus
;) //V'e 129 ing the thermal performance of thermal insulation materials provided it is used correctly. A very important factor with respect to the use of the method is heat flow meter calibration, especially of the whole apparatus:' De Ponte and Maccato [2] have theoretically analyzed some of the aspects ofheat flow meter calibrations. International standards such as the ASTM Standards C 518[3] and C 1132 [4] and the ISO Standard 8301 [5] attempt to standardize the construction, calibration and application of the heat flow meter app,r,-tus. In spite of these attempts, within the measurement commUllity ,1 number of questions are repeatedly asked:
• Does the calibration depend on the nature of the test specimen? • Does the thickness of the specimen play a role?
• How does the temperature difference across the specimen affect the cali-bration?
• What is the effect of the mean specimen temperature on the calibration' There are evidences in the literature that all these questions are relevant. But how significant are the effects, within the limitations of the method-ology?
Based on many years ofexperience on heat flow meter apparatus method-ology, a series of measurements were done at the Institute for Research in Construction during a period of six months. The measurements were plan-ned to answer the following question: Can the physical quantities measured on a heat flow meter apparatus, such as the transducer outputs and surface temperatures, under steady state heat flux conditions across any given trans-fer standard specimen (used for calibrating a heat flow meter apparatus) be correlated, within 2%, to the heat flux?
The measurements were also planned to include some of the effects men-tioned generally in the four questions asked by the measurement com-munity. Thus, six specimens of medium density glass fiber insulation ('" 50 kg'm-') or expanded polystyrene insulation were used as the transfer standards. The glass fiber specimens were used at thicknesses of 26, 52 and 150 mm. There were two separate specimens each with a thickness of 150 mm. The polystyrene specimens were used at thicknesses of73 and 158 mm. The mean temperature of the test specimen in the apparatus was varied be-tween 0 and 40°C. The temperature difference across the specimens was varied from 10 to 40 K. In many measurements, the test assembly, that in-cludes 25 mm of glass fiber insulation around the perimeters (to reduce the edge heat losses), was kept at an ambient temperature that matched the mean specimen temperature within 1 K. In others no special attempt was made to control the ambient temperature, but the edge losses were reduced using glass fiber insulation around the perimeters and a box enclosure, made out of polyisocyanurate board insulation, for the whole test assembly..
130 JOHN LACKEY ET At.
This technical note briefly describes the heat flow meter apparatus used for the measurement and presents the results from 91 independent measure-ments done on the six transfer standard specimens and the calibration proce-dure adopted.
THE HEAr FLOW METER APPARATUS
The apparatus used for the measurements reported is a 600 mm X 600 mm one. It conforms to ASTM Standard C 518 [3]. As shown in configura-tion B of Figure A2.1 of the standard, each plate of the apparatus has a built-in heat flow transducer. The plates are mabuilt-intabuilt-ined at constant temperatures by circulating thermostated fluids in a counter-flow pattern as shown in case
(b) of Figure A2.2 of the standard. The details of the plate assembly are shown in Figure 1. All measurements are done in a horizontal configuration with the heat flux vertically upwards. As shown in Figure 1, enclosed in
circles, three quantities are measured out of each plate, under steady state
conditions. These are:
1. Output, E (mV), from the heat flow transducer
2. Temperature, Tp (0C), of the inner surface of the aluminium plate and
3. Temperature, T (0C), of the inner surface of the plate assembly
The central 250 mm X 250 mm area of the transducer is a thermopile with 1800 copper-constantan junctions. The temperatures Tp and T are the
averages of four separate measurements done in corresponding central areas.
Calibrated thermocouples are used as sensors for these measurements.
Addi-PLA TE ASSEMBLY - Aluminium cooling plates 36 mm
,
.... セ mセッイ PNPYュセ Copper fOil 0.09 mmn
I_Cork 1.75 mm iI-@
""===Sensor O.85mm (transducer)
Z]]]]]]]]]]エMセセ]]]]]]]]ZZ[M」ッイォ
1.75 mmTp
"""""""'=
LIQUIDFIGURE 1. Schematics of the plate assembly; the three quantities that are measured out of each plate assembly are enclosed in circles (see text).
Calibration of a Heat Flow Meter Apparatus 131 tional thermocouples mounted uniformly across the full areas are used to ensure isothermal planes in the assembly. Usually the temperature distribu-tion in either area is uniform within 0.05K.
RESULTS
The results from 91 individual measurements on the six transfer standards are listed in Table 1. These measurements were carried out over a period of six months.
ANALYSIS OF THE D.IU'A
The steady state heat flux, Q",(W/m'), is calculated from the information available on each transfer standard from guarded hot plate measurements conforming to ASTM Standard C 177 [6]. These calculated values for each measurement are listed in Table 2. The objective of the analysis is to find the best correlation between the steady stae heat flux and the six quantities measured to represent each set given in Table 1.
As the starting point, the relation between Q", andE for each plate was examined. As shown in Figure 2 this relation is linear. Hence for each plate one may calculate a "sensitivity factor" S[W/(m" mV)] [4] as:
S -- Q",E (1)
The results from such a calculation are shown in Figure 3, where S is plot-ted against
Q",.
Itcan be seen that for either plate all the 91 values of S fall within 4% of a respective mean value. If one does the calculation as(2)
whereE•••is calculated as:
(3)
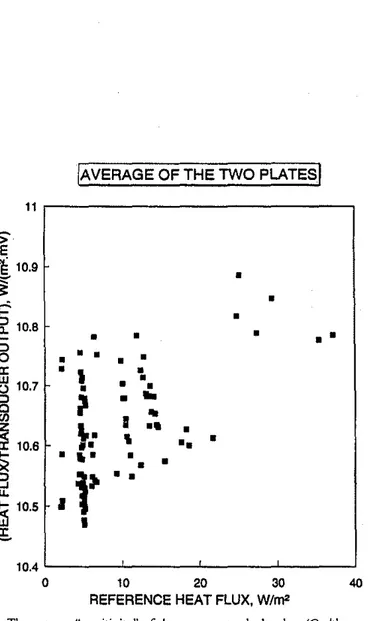
The results will be as shown in Figure 4. Now it can be seen that all the 91 results falls within 2% of 10.7 W/(m' . mV). However, the distribution of the 91 values show that the majority of them fall within 10.5 and 10.7 W/(m' . mV). With so many results in hand, one would expect an e,:,en
dis-132 JOHN LACKEY ET At.
Table 1. Experimental data an the six transfer standards. The subscripts handc denote hat and cold respectively. The rest of each symbol has the same meaning as
given in the section an the apparatus.
T.. T, T,p T, E, E, No
·C
·C
·C
·C
mY mY 1 35.41 35.13 12.14 12.41 0.4645 0.4710 2 11.49 11.24 -11.40 -11.10 0.4071 0.4255 3 15.98 15.73 -6.54 -6.30 0.4107 0.4233 4 21.32 21.07 -1.18 -0.94 0.4166 0.4320 5 26.20 25.94 3.67 3.91 0.4310 0.4385 6 31.15 30.87 8.62 8.86 0.4463 0.4418 7 36.13 35.85 13.45 13.70 0.4580 0.4563 8 41.25 40.97 18.37 18.63 0.4740 0.4706 9 46.33 46.06 23.47 23.74 0.4851 0.4793 10 51.20 50.92 28.40 28.67 0.4987 0.4869 II 29.12 29.00 18.85 18.97 0.2032 0.2076 12 39.33 38.98 8.53 8.88 0.6118 0.6199 13 15.42 15.31 4.95 5.07 0.1889 0.2060 14 25.22 24.89 -6.00 -5.66 0.5768 0.5924 15 35.48 34.94 12.73 13.29 0.9643 0.9886 16 11.39 10.88 -11.70 -11.20 0.9039 0.9090 17 16.59 16.07 -6.74 -6.20 0.9288 0.9373 18 21.49 20.96 -1.59 -1.04 0.9336 0.9463 19 26.46 25.93 3.39 3.94 0.9457 0.9657 20 31.36 30.82 8.26 8.83 0.9656 0.9861 21 41.65 41.09 18.44 19.02 1.0072 1.0323 22 46.51 45.94 23.34 23.93 1.0246 1.0504 23 51.57 50.99 28.43 29.03 1.0468 1.0714 24 35.58 35.03 12.45 13.02 0.9844 1.0038 25 29.23 28.98 18.76 19.01 0.4448 0.4568 26 39.76 39.01 8.27 9.05 1.3387 1.3634 27 15.33 15.09 4.88 5.13 0.4235 0.4315 28 25.65 24.95 -5.71 -4.96 1.2797 1.2819 (continued)Calibration of a Heat Flow Meter Apparatus 133 Table J. (continued). T... T, T.. T, E, E, No
·C
·C
'C
·C
mV mV 29 35.66 34.97 12.29 13.02 1.2578 1.2753 30 11.60 10.96 -11.60 -10.90 1.1494 L1418 31 16.66 16.01 -6.67 -5.99 1.1787 1.1735 32 21.73 21.06 -1.83 -1.13 1.2130 1.2111 33 26.60 25.93 3.27 3.97 1.2208 1.2266 34 31.53 30.85 8.17 8.88 1.2424 1.2542 35 41.83 41.12 18.33 19.08 1.2945 1.3185 36 46.65 45.92 23.25 24.01 1.3173 1.3423 37 51.73 50.98 28.12 28.90 1.3588 1.3861 38 35.15 34.46 11.96 12.68 1.2568 1.2679 39 29.29 28.97 18.79 19.12 0.5719 0.5779 40 39.84 38.90 8.40 9.38 1.7131 1.7190 41 15.34 15.04 4.76 5.08 0.5470 0.5500 42 26.03 25.12 -5.93 -4.97 1.6714 1.6425 43 29.28 28.96 18.79 19.11 0.5763 0.5766 44 32.00 31.52 16.07 16.56 0.8753 0.8746 45 34.60 33.96 13.35 14.01 1.1659 1.1653 46 37.24 36.45 10.60 11.43 1.4615 1.4584 47 39.97 39.02 7.94 8.94 1.7538 1.7493 48 42.58 41.47 5.35 6.51 2.0369 2.0304 49 45.32 44.04 2.78 4.11 2.2439 2.3151 50 35.26 35.01 12.68 12.81 0.4666 0.4611 51 1L11 10.89 -11.10 -10.90 0.4087 0.4243 52 16.27 16.03 -6.24 -5.99 0.4260 0.4353 53 21.11 20.88 -1.36 -1.11 0.4355 0.4418 54 26.19 25.95 3.70 3.96 0.4468 0.4489 55 31.29 31.04 8.77 9.03 0.4584 0.4561 56 41.10 40.85 18.62 18.88 0.4734 0.4681 57 46.15 45.89 23.68 23.95 0.4838 0.4747 58 51.26 50.99 28.73 29.00 0.4965 0.4842 (continued)134 JOHN LACKEY ET Al. Table 1. (confinued). T., T, T" T, E, E, No
·C
·C
·C
·C
mY mY 59 35.12 34.87 12.67 12.94 0.4639 0.4595 60 29.16 29.05 18.88 19.00 0.2130 0.2113 61 39.31 38.96 8.63 8.99 0.6343 0.6271 62 15.20 15.09 4.88 5.00 0.1962 0.2084 63 25.23 24.90 -5.40 -5.05 0.5999 0.5967 64 35.33 35,09 12.77 13.03 0.4523 0.4450 65 11.08 10.86 - 11.39 -11.10 0.3990 0.4023 66 51.47 51.20 28.83 29.10 0.4862 0.4715 67 29.38 29.26 18.91 19.03 0.2093 0.2071 68 39.34 39.01 8.66 9.00 0.6103 0.6053 69 14.99 14.89 4.79 4.91 0.1859 0.1964 70 25.35 25.04 -5.29 -4.97 0.5791 0.5670 71 36.34 34.97 11.72 13.16 2.5485 2.5130 72 12.27 11.00 -12.30 -11.00 2.3268 2.2764 73 52.53 51.07 27.71 29.22 2.6840 2.7128 74 29.78 29.14 18.37 19.03 1.1818 1. 1729 75 40.90 39.03 7.35 9.30 3.4774 3.4243 76 15.71 15.11 4.50 5.13 1.1003 1.0913 77 26.78 24.98 -6.87 -4.98 3.3361 3.2411 78 35.67 35.41 12.48 12.74 0.4820 0.4715 79 35.67 35.41 12.44 12.71 0.4856 0.4665 80 51.28 51.02 29.14 29.40 0.4990 0.4696 81 51.28 51.02 29.24 29.51 0.4856 0.4833 82 46.30 46.04 23.64 23.91 0.4886 0.4840 83 41.36 41. II 18.97 19.23 0.4759 0.4673 84 26.18 25.94 3.90 4.15 0.4422 0.4342 85 21.58 21.34 -0.97 -0.72 0.4371 0.4293 86 16.32 16.09 -6.26 -6.02 0.4271 0.4179 87 11.22 10.99 -11.25 - 11.00 0.4159 0.4065 88 10.96 10.72 - 11.27 - 11.00 0.4232 0.4143 89 16.31 16.07 -6.11 -5.86 0.4351 0.4274 90 21.28 21.04 -1.10 -0.84 0.4413 0.4348 91 26.17 25.92 3.62 3.88 0.4559 0.4469Calibration
of
a Heat Flow Meter Apparatus 135Table2. Comparison ofthe sleodystaleheatfluxes, Q .., andQ, calculated
accordingtothe information derivedfrom guarded hot plateapparatus
measurements and accordingtothe calibration method adoptedin
this work respectively.
W/m' No. Q", Q %diH 1 4.995 4.965 -0.6 2 4.407 4.442 0.8 3 4.443 4.445 0.0 4 4.550 4.517 -0.7 5 4.656 4.624 -0.7 6 4.757 4.717 -0,8 7 4.890 4.851 -0,8 8 5.041 5.006 -0.7 9 5.143 5,106 -0.7 10 5.232 5.212 -0.4 11 2.207 2.180 -1.2 12 6.622 6.536 -1.3 13 2.118 2.102 -0.8 14 6.303 6.224 -1.3 15 10.384 10.363 -0.2 16 9.737 9.672 -0.7 17 9.987 9.945 -0.4 18 10.037 10.007 -0.3 19 10.206 10.164 -0.4 20 10.388 10.367 -0.2 21 10.817 10.809 -0.1 22 10.982 10.985 0.0 23 11.174 11.201 0.2 24 10.552 10.551 -0.0 25 4.779 4.785 0.1 26 14.368 14.339 -0.2 27 4.546 4,551 0,1 28 13.648 13.636 -0.1 29 13.551 13.443 -0.8 (continued)
136 JOHN LACKEY ET Al. Table2. (continued). W/m' No. Q,., Q % diff 30 12.287 12.224 -0.5 31 12.601 12.535 -0.5 32 12.952 12.904 -0.4 33 13.072 13.014 -0.4 34 13.335 13.261 -0.6 35 13.956 13.848 -0.8 36 14.167 14.080 -0.6 37 14.590 14.515 -0.5 38 13.422 13.399 -0.2 39 6.085 6.102 0.3 40 18.236 18.213 -0.1 41 5.815 5.840 0.4 42 17.572 17.640 0.4 43 6.081 6.118 0.6 44 9.235 9.286 0.6 45 12.319 12.371 0.4 46 15.439 15.496 0.4 47 18.567 18.590 0.1 48 21.582 21.584 0.0 49 24.659 24.193 - 1.9 50 4.922 4.923 0.0 51 4.480 4.444 -0.8 52 4.599 4.590 -0.2 53 4.661 4.670 0.2 54 4.737 4.763 0.5 55 4.819 4.857 0.8 56 4.966 4.990 0.5 57 5.047 5.074 0.5 58 5.147 5.186 0.8 59 4.864 4.900 0.8 60 2.229 2.252 1.0 61 6.647 6.694 0.7 (continued)
Calibration of a Heat Flow Meter Apparatu, Table 2. (cantinued). W/m2 No. 0", 0 % diff 62 2.141 2.154 0.6 63 6.352 6.370 0.3 64 4.712 4.762 1.0 65 4.222 4.275 1.3 66 5.037 5.064 0.5 67 2.186 2.2\0 1.1 68 6.408 6.451 0.7 69 2.007 2.035 1.4 70 6.036 6.101 1.\ 71 27.305 26.860 -1.6 72 25.054 24.558 -2.0 73 29.272 28.537 -2.5 74 12.655 12.496 -1.3 75 37.219 36.625 -1.6 76 11.818 11.666 -1.3 77 35.445 35.012 -1.2 78 4.995 5.060 1.3 79 5.003 5.053 1.0 80 5.097 5.122 0.5 81 5.072 5.123 1.0 82 5.106 5.149 0.8 83 4.948 4.999 1.0 84 4.615 4.660 1.0 85 4.572 4.612 0.9 86 4.470 4.503 0.7 87 4.339 4.388 1.1 88 4.465 4.468 0.1 89 4.580 4.596 0.4 90 4.642 4.664 0.5 9\ 4.748 4.801 1.1 137
138 JOHN LACKEY ET At.
4r---,
o•
>3 Ei
o
a:
2 wセ
セ
"
•
a
40o'-
' -_ _
- - J ' ' -_ _--J --.Jo
10 セ セREFERENCE HEAT FLUX, W/m'
10
HOT PLATE • COLD PLATEI
FIGURE 2. The dependence between reference heat flux.Q..jand the transducer output from the plates.
Calibration of a Heat Flow Meter Apparatus 139 11.4 , . . - - - , d' a a a a a
•
a•
•
•
a•
aセ||
a•
•
a 0•
•
a•
•
t
af
•
a•
セ[a\e
'0 a 8 a 1,•
dJ•
a•
af
11.2 aセ
( 11 010.8セ
65
10.8 Zセ
.10.42
S
10.2e.
40 10 '--_ _--'- .L-_ _-L._ _- 'o
10 20 30REFERENCE HEAT FLUX, W/m2
laHoT PLATE • COLD PLATE
I
FIGURE 3. The "sensitivity" of each plate calculated as (Qrtf/transducer output) for both plates.
140 JOHN LACKEY ET AL.
IAVERAGE OF THE TWO PLATESI
11 . - - - ,
セ
'Ii
10.9•
I
•
セ•
Ii:
10.8•
•
•
•
•
I-:::>• •
0•
• •
a:•
I
•
セ 10.7•
•
•
•
:::>セ
•
..
0...
rJl Iセ
".
,
••
•
••
•
10.8••
セ
•
••
•
•
•
:::>1)
••
Ii
セ
10.5,
•
;S 40 10 20 30REFERENCE HEAT FLUX,W/rrt2
10.4 ' - - - ' - - - ' - - - ' - - - '
o
FIGURE 4. The average "sensitivity" of the apparatus calculated as(Q"jlthe average of the
Calibration of a Heat Flow Meter Apparatus 141 tribution. Are there other factors that should be considered in the calibra-tion? To answer this question the influence of the four temperatures.
measured in each set, on S was next investigated. An average temperature
T.,.was defined as:
(4)
The relation betweenT.,. and S for the 91 measurements are shown in Figure 5. A trend. though concealed by the scatter. emerges from Figure
s.
This becomes more clear when the data are reduced as follows. in Figure S. nine separate "bins" can be identified. Each bin corresponds to one T••,. Now each bin is averaged for the temperature and the sensitivity factor. The results from this data reduction are shown in Figure 6.It can be seen that for!AVERAGE OF THE TWO PLATESI
1 1 , - - - , - - - ,
=[
'1:i
10.9 ::::':=
セ
10.8o
a:
セ 10.75
セ
1
10 . 6 セ 10.5e.
I
•
•
•
•
•
•
•
•
I
•
•
•
•
•
•
•
••
•
•
•
•
•
lit•
•
,
•
•
•
•
•
•
•
•
•
I
•
I
•
•
•
•
•
I•
•
•
..
•
50o
10 20 30 40 TRANSDUCER TEMPERATURE, 'C 1Q.4 '---..,.-'-_ _.1-_-'-_ _.1-_-'-_---' -10FIGURE S. The dependence of the average sensitivity on the average transducertcmpcr:ltllT..: (see text. Equation [4]).
142 JOHN LACKEY ET At.
IAVERAGE OF THE"BINS"I
10.7
r - - - r - - - . . . ,
セ
'Ii
10.68セ
¢"10.66セ
o
10.64a:
wg
!il10.62!
>0.
f-L5
10.68 セ•
•
•
•
•
•
•
•
50o
10 20 30 40 TRANSDUCER TEMPERATURE, °C 10.56 '--_-'-_ _-'-_--I_ _-'-_ _L-_-' -10FIGURE 6. Results from data reductionby"bin" averaging (see text).
the range of temperatures, 0 to 40°C a very small but measureable tempera-ture coefficient for S can be introduced. From a linear regression analysis:
(5)
where
So
=
10.67 ±om
W/(m' .mV)S,
=
0.00235 ± 0.00030 W/(m' . mV'0c)Then, for the heat flow meter used in this work the steady state heat flux, Q(W/m'), would be given by:
Calibration of a Heat Flow Meter Apparatus 143 This equation was used to calculateQfor all the measurements reported in 'Uble
1.
These calculated values are compared with Q.., in Table 2. The percentage difference between the two are plotted in Figure 7. It can be seen that 90 out of the 91 measurements correspond to Q.., within 2%; with the majority of them within 1.5%, for the most part of the heat flux range in-vestigated here the distribution of the percentage difference is even. The only bias seen is with the six values at the higher end of the range. But in spite of this bias, Equation (6) gives acceptable values for the steady state heat flux for all the measurements reported here.CONCLUDING REMARKS
The calibration measurements reported here included transfer standards with thicknesses between 26 and 158 mm, mean specimen temperature
be-IREFERENCE VS CALCULATED
I
2.---,
0 セ8
0 0g
ate
セ
0 0 0 <S' 0 '0 00 o o o 0 o o o -2 セ o o o 40 10 20 30REFERENCE HEAT FLUX, W/m2
-3 ' -_ _-.J... .L-_ _--'-_ _- - '
o
1't't JOHN LACKEY ET At.
tween 0 and 40°C, temperature differences between 10 and 40 K and two types of insulating materials. The results show that the specimen thickness, the mean specimen temperature, the magnitude of the temperature differen-tial across the test specimen and even difference in the material did not sig-nificantly influence the calibration procedure adopted for the heat flow meter described here. The steady state heat flux determined in this apparatus should match within2% of that determined using a guarded hot plate ap-paratus. The calibration method described here was also successfully applied to two other heat flow meter apparatuses in our laboratory.
REFERENCES
1. McElroy, D.L. and R. P. Tye. 1980."Thermal Insulation Performance;'ASTM Spedai1l!chnica} Publication 718, p. 560.
2. De Ponte, F. and W. Maccato. 1980. "The Calibration of Heat Flow Meters;'
ASTM Spedal1l!chnical Publication 718, pp.237-254.
3. ASTM Standard C518-91. 1993."Standard Test Method for Steady-State Heat
Flux Measurements and Thermal Transmission PropertiesbyMeans of the Heat
Flow Meter Apparatus;'Annual Book
if
ASTM Standards, 04.06:151-162.4. ASTM Standard C1132-89. 1993."Standard Practice for Calibration of the Heat Flow Meter Apparatus;'Annual Book of ASTM Standards, 04.06:625-628.
5. ISO Standard 8301:1991 (E). 1991. "Thermal Insulation-Determination of Steady-State Thermal Resistance and Related Properties-Heat Flow Meter
Ap-paratus.
6. ASTM Standard C 177-85. 1993."Standard Test Method for Steady-State Heat
Flux Measurements and Thermal Transmission Properties by Means of the