Publisher’s version / Version de l'éditeur:
Proceedings 17th International Conference on Port and Ocean Engineering under Arctic Conditions, POAC'03, 1, pp. 165-174, 2003
READ THESE TERMS AND CONDITIONS CAREFULLY BEFORE USING THIS WEBSITE.
https://nrc-publications.canada.ca/eng/copyright
Vous avez des questions? Nous pouvons vous aider. Pour communiquer directement avec un auteur, consultez la
première page de la revue dans laquelle son article a été publié afin de trouver ses coordonnées. Si vous n’arrivez pas à les repérer, communiquez avec nous à PublicationsArchive-ArchivesPublications@nrc-cnrc.gc.ca.
Questions? Contact the NRC Publications Archive team at
PublicationsArchive-ArchivesPublications@nrc-cnrc.gc.ca. If you wish to email the authors directly, please see the first page of the publication for their contact information.
NRC Publications Archive
Archives des publications du CNRC
This publication could be one of several versions: author’s original, accepted manuscript or the publisher’s version. / La version de cette publication peut être l’une des suivantes : la version prépublication de l’auteur, la version acceptée du manuscrit ou la version de l’éditeur.
Access and use of this website and the material on it are subject to the Terms and Conditions set forth at Early results of the Canadian ice service ice strength chart
Langlois, D. J.; De Abreu, R.; Gauthier, M.-F.; Timco, G. W.; Johnston, M.
https://publications-cnrc.canada.ca/fra/droits
L’accès à ce site Web et l’utilisation de son contenu sont assujettis aux conditions présentées dans le site LISEZ CES CONDITIONS ATTENTIVEMENT AVANT D’UTILISER CE SITE WEB.
NRC Publications Record / Notice d'Archives des publications de CNRC: https://nrc-publications.canada.ca/eng/view/object/?id=925ffaeb-e1ea-45e3-988c-7d2571657c0a https://publications-cnrc.canada.ca/fra/voir/objet/?id=925ffaeb-e1ea-45e3-988c-7d2571657c0a
POAC ‘03
Trondheim
Proceedings of the 17 International Conference onth Port and Ocean Engineering under Arctic Conditions POAC’03 Vol. 1, pp 165-174 Trondheim, Norway, June 16-19, 2003
EARLY RESULTS OF THE CANADIAN ICE SERVICE ICE STRENGTH CHART
D.J.Langlois1, R. De Abreu1, M-F. Gauthier1, G.W.Timco2 and M.Johnston2
1
Canadian Ice Service, Meteorological Service of Canada, Environment Canada, Ottawa, Ontario K1A 0H3 Canada
2
Canadian Hydraulics Centre, National Research Council, Ottawa, Ontario K1A 0R6 Canada
ABSTRACT
The Canadian Ice Service (CIS) is investigating methods to operationally report on sea ice strength. Knowledge of the state of ice decay is an important factor in Arctic marine navigation. Recent work has led to an improved understanding of the seasonal weakening of first year sea ice and the physical processes responsible. In May 2002 the CIS began production of a prototype “Ice Strength” chart based upon an algorithm developed by the Canadian Hydraulics Centre of the National Research Council. Using field observations of ice strength and ancillary variables, this algorithm estimates the ice strength using modeled surface air temperatures. The Ice Strength chart displays the strength of undeformed first year ice relative to its mid-winter strength. In 2002, field research was conducted to validate the Ice Strength chart. A comparison with the field data showed that the Ice Strength chart gave good estimates of the ice strength.
INTRODUCTION
The Canadian Ice Service
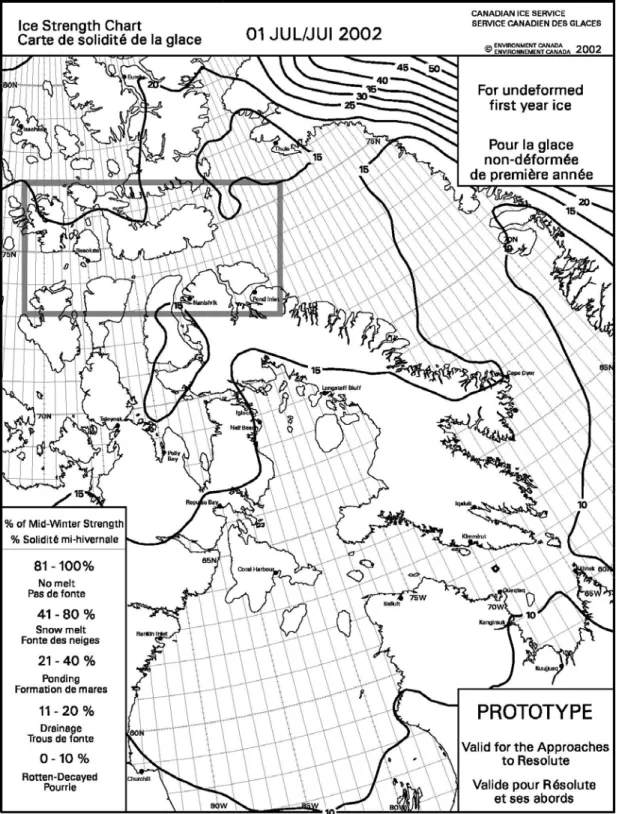
The Canadian Ice Service (CIS) is Canada’s leading source of marine ice information, with the mandate to provide timely and accurate information about ice in Canadian waters. Products that have historically been issued include daily ice charts depicting sea ice information in active shipping areas, and weekly or monthly ice charts describing the ice for climatological or planning purposes. The ice is usually described by concentration and by thickness or stage of development. On May 1, 2002, the first of the prototype Ice Strength charts was issued. This chart (see Figure 1) depicts the strength of undisturbed, level, first-year ice relative to its mid-winter strength.
BACKGROUND Sea Ice Decay
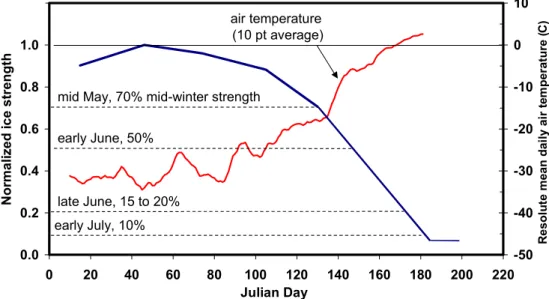
As the ocean surface cools to approximately –1.8ºC, the water freezes, and the forming ice captures some of the dissolved salts. The entrained salts form small pockets that cause the sea ice to be weaker than fresh water ice at the same temperature. These brine pockets shrink as lower temperatures freeze more of the liquid brine. All other things being equal, the colder the ice, the lower the brine volume, and the stronger the ice will be. As the ice temperature rises, the brine pockets enlarge. The strength of the ice diminishes as the brine volume increases (Timco et al. 2001, Timco and Johnston, 2002). Thus, before any surface melt features are evident, the ice may have already lost a significant amount of its mid-winter strength. A few weeks after the daily average surface air temperature reaches 0ºC, the first-year sea ice will have lost approximately 90 percent of its mid-winter strength and is considered decayed (Figure 2). 0.0 0.2 0.4 0.6 0.8 1.0 1.2 0 20 40 60 80 100 120 140 160 180 200 220 Julian Day No rm al iz ed i ce s tre n g th -50 -40 -30 -20 -10 0 10 R e sol u te m ean dai ly ai r te m p erat ure (C ) air temperature (10 pt average) early June, 50% late June, 15 to 20% early July, 10%
mid May, 70% mid-winter strength
Figure 2. Relation between first year ice strength and air temperature (Timco et al. 2001). Measured Changes in Ice Strength
The Canadian Hydraulics Centre (CHC) of the National Research Council, in conjunction with the CIS, conducted field studies of first year ice strength using borehole jack measurements in level, undisturbed first year ice at five locations (Truro, Allen Bay, Barrow, Griffith and Leopold) near Resolute (74º43’N 94º59’W) in Nunavut (Johnston et al., 2003). Figure 3 shows the results of three seasons of borehole jack measurements in the landfast, first year sea ice (Johnston et al., 2003). In 2002 the measurements were taken from May 2 (Julian Day 122) to August 11 (Julian Day 223). All strengths were rate-compensated to a common stress rate, 1.0 MPa/s and are expressed in terms of the percent strength remaining, normalized to the mid-winter strength of first year sea ice. The three seasons of measurements show that ice strength decreased as the season advanced. The strength of the ice reached a plateau in late July and remained at that level (near 10 percent) through the month of August, when the last tests were conducted.
Figure 3. Percent strength remaining for first year sea ice during the decay process (Johnston et al., 2003).
Ice Strength Chart: Algorithm
Timco et al. (2002) showed that the strength of first year ice decreases as the air temperature increases (Figure 2). Since air temperatures are more readily available than direct measurements from a field program, efforts were directed towards developing an algorithm that relates ice strength to surface air temperature. The input temperatures are obtained by averaging the 00Z and 12Z surface temperatures from the Canadian Meteorological Centre’s Global Environmental model. The modeled temperature analyses take into account actual station data and interpolates temperatures over the data sparse Arctic.
The algorithm uses the accumulated daily mean temperatures beginning April 1 and uses a base temperature (Tbase) of –30ºC. The Accumulated Warming Degree Day (AWDD) equation
(1) accounts for the addition or subtraction of heat to and from the ice. This equation is thought to simulate the addition of heat to the ice when air temperatures are above –30ºC and a loss of heat from the sea ice when temperatures are below –30ºC.
AWDD = Σ(Tmean – T base) (1)
The relationship between air temperature and ice strength gave rise to the following equation developed by CHC that expresses the ice strength as a percentage remaining, normalized to the mid-winter strength of first year sea ice (STN ). This equation was developed for the area
around Resolute where the borehole jack measurements took place.
STN=1.0643exp(-0.001AWDD) (2)
Charting the Ice Strength
The Ice Strength chart (Figure 1) is a black and white chart issued in conjunction with the Regional ice charts for the eastern Arctic and Hudson Bay. The Ice Strength chart depicts
isostrength lines for level, undeformed first year ice in 5 percent increments ranging from 100 percent of mid-winter strength down to 5 percent. A grey box around the approaches to Resolute delineates the area where there is the most confidence in the strength isolines. Outside of the box, the isolines are given, but with less confidence, as the strength of the ice in other areas was not included in the development of the algorithm.
In the chart legend there are guidelines for surface melt features (no melt, snow melt, ponding, drainage and rotten-decayed). Surface melt patterns have been studied using remote sensing to determine their effectiveness in determining ice decay (DeAbreu et al., 2001). The descriptions were included on the Ice Strength chart to give a general idea of the surface conditions that may be present during ice ablation. Attempts to correlate ice surface conditions with ice strength have been limited and are qualitative. Work in this area is ongoing at CIS.
RESULTS
Data to validate the chart came from both land and ship-based observations. The land-based study was coordinated with the CHC as they continued their borehole jack measurements in landfast ice near Resolute (Johnston et al. 2002). Ship-based observations were provided by CIS Ice Service Specialists (ISS) stationed on six Canadian Coast Guard Icebreakers as they traveled through the Arctic (Timco et al. 2003). They recorded their observations of the ice type and concentration, surface melt features, as well as the ease of travel through the ice. Their logbooks and digital photographs of the ice over much of the eastern Canadian Arctic were used to evaluate the Ice Strength chart. Information about the state of the ice earlier in the season came from the Motor Vessel (MV) Arctic.
Borehole Jack Measurements
When the strengths measured during the 2002 ice decay work on first year ice were compared to forecast ice strengths from the Ice Strength chart, there was good agreement, particularly in June, July and August (Figure 4). Earlier in the season, the ice strengths have more variation and there is discrepancy between the measured and forecast ice strengths.
Figure 5 shows a (nearly) one to one correspondence between the measured and forecast ice strengths for all data points except the three highest strengths. Those three points correspond to measurements made on May 2, 2002. Two of the measurements resulted in strengths of about 44 percent, the other of 63 percent, whereas the forecast ice strength was approximately 84 percent. These early-season measurements may have varied from the expected results because of a different failure process in cold ice or because of problems encountered with the equipment at that time (Johnston et al., 2003).
0 20 40 60 80 100 1-Ma y 8-Ma y 15-M ay 22-May 29-Ma y 5-Ju n 12-Jun 19-J un 26-J un 3-J ul 10-J ul 17-J ul 24-J ul 31-J ul 7-Au g 14-A ug 21-Aug Date Pe rc e n t of Mid-Winte r Stre
ngth Measured Ice Strength
Ice Strength Chart
Figure 4. Comparison of measured and forecast first year ice strengths for 2002.
0 20 40 60 80 100 0 20 40 60 80 100
Measured Ice Strength
Ic e Stre ngth from CIS c h a rt
Figure 5. Cross plot of measured and forecast first year ice strengths for 2002. The axes are percentage of mid-winter strength.
Field Book Reports
The ISS on board various Canadian Icebreakers recorded observations of the sea ice as they conducted their regular Arctic operations (Gauthier et al., 2002; Timco et al, 2003). For the Eastern Arctic, the observations began July 1 with the Canadian Coast Guard Ship (CCGS) Pierre Radisson heading into Frobisher Bay. The observations continued through to September 19. On July 1, the strength of the first year ice according to the Ice Strength chart (Figure 1) ranged from 20 percent in the north to 10 percent in the south. By July 8, ice strength in Hudson Strait was calculated to be 10 percent or less of its mid-winter value. The forecast 10 percent isostrength line moved north of the Resolute area by July 23, then by August 5, all areas on the Ice Strength chart showed an ice strength value of 10 percent or
less. Near the end of August, air temperatures begin to dip below zero; therefore, this study does not include reports from September.
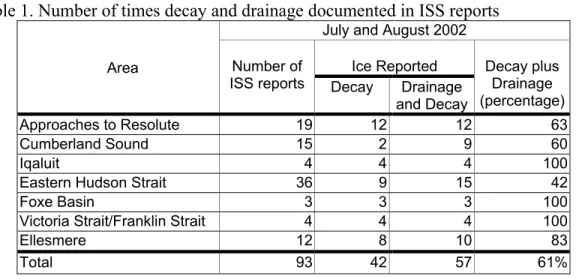
The ISS recorded ninety-three observations of the state of the ice in the eastern Arctic in July and August 2002 (Table 1). Of these reports, forty-two mentioned rotten or decayed ice while another fifteen described the ice as being in the drainage state. Sea ice that has a strength of 10 percent or less includes ice in the rotten stage as well as the drainage stage. Therefore, according the forecast ice strengths, almost all of the reports should have been of rotten or drainage stage ice. A more detailed analysis of the observations revealed that some areas of the Arctic had a higher percentage of decayed or drainage stage ice than other areas.
Table 1. Number of times decay and drainage documented in ISS reports
July and August 2002 Ice Reported
Area Number of
ISS reports Decay Drainage and Decay Decay plus Drainage (percentage) Approaches to Resolute 19 12 12 63 Cumberland Sound 15 2 9 60 Iqaluit 4 4 4 100
Eastern Hudson Strait 36 9 15 42
Foxe Basin 3 3 3 100
Victoria Strait/Franklin Strait 4 4 4 100
Ellesmere 12 8 10 83
Total 93 42 57 61%
Eastern Hudson Strait and Ungava Bay
ISS field reports in Eastern Hudson Strait and Ungava Bay began July 1. At that time the chart gave a forecast ice strength of 9 to 11 percent. Of the thirty-six ISS reports from July 1 to July 28, nine described the ice as being decayed and another six reported ice in the drainage stage. The ice in this area can to be highly dynamic with ice moving southward in the Baffin Island current and westward through Hudson Strait. The Ice Strength chart is meant to give forecast strength for ice that formed and become fast in the same region - which would exclude some of the ice in this area.
Iqaluit
All four of the ship-based reports near Iqaluit described the ice as rotten. The ice in this area is predominantly level undisturbed first year ice and would be similar to the ice conditions found in the study area near Resolute. At the time of the observations, the Ice Strength chart gave a forecast strength of 11 percent, which roughly corresponds to the drainage stage. Cumberland Sound
There were fifteen ice strength reports for the entrance to Cumberland Sound from July 29 to Aug 5. Of these, two reported decayed first year ice and seven more reported drainage. The mobile ice in the area at the time would be more conducive to ridging which would have an impact on the ice strength and may mask the some of the evidence of rotten ice.
Foxe Basin
There were three reports at different locations in Foxe Basin on August 19 and all described the first year ice as decayed. These reports correspond with the expected state of ice decay based on the Ice Strength chart.
Victoria Strait/Franklin Strait
Two ships moved through Victoria Strait or Franklin Strait in mid-August, and all of the four reports described the first year ice as rotten. These observations fit well with the expected decay from the Ice Strength charts.
Approach to Resolute
The first ship-board report on the ice conditions was July 23, just as the strength of the ice, according to the Ice Strength chart, weakened to 10 percent or less. There were two reports from the CCGS Terry Fox that day. The first report was decayed ice, while the second report eight hours later reported that the thick first year ice had become ridged under strong pressure. Overall, there were nineteen ship-based reports from July 23 to August 23. Twelve of them reported decayed ice while most of the remaining reports described the ice as ridged.
Approach to Eureka
The CCGS Des Groseilliers traversed from Jones Sound to Eureka and back, reporting on the state of the ice from August 21 to August 28. In Jones Sound they reported drainage. From Norwegian Bay northward, the CCGS Des Groseilliers reported predominately decayed second year ice. At this time, the ice chart forecast the strength of first year ice to be approximately 5 percent. This is in agreement with the Ice Strength chart; however, since this ice was predominantly second year ice, it is not known how the strength of this ice in August relates to its mid-winter strength. The strength of decayed multi-year ice may not be equivalent to the strength of decayed first year ice.
Limitations
The Ice Strength chart was developed for level, undeformed, first year sea ice. It is designed to be a companion to the Regional ice charts and does not show the concentration or stage of development of the ice. The decay of second year and multi-year ice is not fully understood (Timco et al., 2001) and is not accounted for in the Ice Strength chart; however, the concentration of multi-year ice is shown on the companion Regional ice charts. Ice ridges have an impact on the strength of the ice, but due to the scale of the charts and the difficulty in using remote sensing to detect ridges, these features are not displayed on either the Regional ice charts or the Ice Strength charts.
The algorithm for the Ice Strength chart was based on studies conducted in the Resolute area and as such, the isostrength lines are most applicable in that area. As a first approach, the algorithm developed for the approach to Resolute was used for first year ice in other areas (Figure 1). A potential obstacle in using this chart for areas outside the Resolute area is in the calculation for warming degree-days. In southern areas such as south of 65ºN, the surface air temperature could have already risen to near –10ºC by the April 1, the current accumulation baseline date. In the late spring, from June 14 to 16, 2002 observations of the stage of melt were recorded by an ice forecaster aboard the MV Arctic as she moved through Hudson
Strait. Decayed ice was observed when the CIS Ice Strength chart was predicting strengths of 17 to 20 percent. Starting the accumulation of warming degree-days on February 1 may provide better results for southern areas. In addition, algorithms with different coefficients may need to be developed to forecast the ice strength in other areas.
Finally, the resolution of the air temperature data extracted from the Global model is one degree; therefore, ice strengths reported on the chart should be used with caution in channels and other areas where the temperature of the land could bias the sea surface temperature values (Y.Pelletier, personal communication).
CONCLUSIONS
The Ice Strength chart was developed to describe the strength of the level, undisturbed first year sea ice. The areas that are most likely to have this type of ice reported the highest percentage of rotten ice. Areas with dynamic ice, such as eastern Hudson Strait and the entrance to Cumberland Sound had smaller percentages of decay, as reported in the ISS field book observations. The Ice Strength chart is designed to provide one type of information about the state of the ice. Other factors impacting the ice strength, such as the amount of ridging or ice pressure, are not displayed on the Ice Strength chart
The field reports from the ISS were a valuable tool in determining the state of ice decay in July and August. To validate the Ice Strength chart earlier in the season, the borehole jack measurements near Resolute provided the information needed to show how the strength of the ice deteriorates from its mid-winter strength. There was good agreement between the values on the Ice Strength chart and the borehole jack measurements from June to August.
Further study needs to be done to determine how well the algorithm developed near Resolute applies to other areas. We are also currently investigating the use of a higher resolution model that may provide better ice strength forecasts in areas with mixed land and water.
ACKNOWLEDGEMENTS
The authors would like to thank all those that participated in the borehole jack measurements for the past three summers and the Ice Service Specialists and the Captains of the Canadian Coast Guard for their participation in this study. The comments and observations of the ice were an excellent source of information of the ice in all areas of the Canadian Arctic.
REFERENCES
De Abreu, R., J. Yackel, D. Barber and M. Arkett (2001). Operational Satellite Sensing of Arctic First-Year Sea Ice Melt. Can. J. of Remote Sensing. Vol 27, No.5, October 2001, pp. 487-501.
Gauthier, M-F., R. De Abreu, G.W. Timco and M.E. Johnston (2002). Ice Strength in the Canadian Arctic: From Science to Operations. Proceedings of the 16th IAHR International Symposium on Ice, Dunedin, New Zealand.
Johnston, M., R. Frederking and G.Timco (2003) Comparison of First-year, Second-year and Multi-year Sea Ice in the Central Canadian Arctic. ISOPE.
Johnston, M., R. Frederking and G. Timco (2002). Properties of Decaying First Year Sea Ice: Two Seasons of Field of Field Measurements. Proceedings of the 17th International
Symposium on Okhotsk Sea and Sea Ice, Mombetsu, Hokkaido, Japan. pp 303-311.
Timco, G.W., M. Johnston and I. Kubat (2001). Ice Decay and the Ice Regime System. Technical Report HYD-TR-070.
Timco, G.W. and M. E. Johnston (2002). Sea Ice Strength During the Melt Season. Proceedings of the 16th IAHR International Symposium on Ice. Dunedin, New Zealand. Vol. 2, pp 187-193.
Timco, G.W., M.E. Johnston, D. Sudom, I. Kubat, M-F. Gauthier and R. Zacharuk (2003). Data Collection Program on Ice Regimes. Proceedings of Port and Ocean Engineering under Arctic Conditions 2003. Trondheim, Norway.