HAL Id: hal-00945731
https://hal.archives-ouvertes.fr/hal-00945731v2
Submitted on 9 Mar 2017
HAL is a multi-disciplinary open access
archive for the deposit and dissemination of
sci-entific research documents, whether they are
pub-lished or not. The documents may come from
teaching and research institutions in France or
abroad, or from public or private research centers.
L’archive ouverte pluridisciplinaire HAL, est
destinée au dépôt et à la diffusion de documents
scientifiques de niveau recherche, publiés ou non,
émanant des établissements d’enseignement et de
recherche français ou étrangers, des laboratoires
publics ou privés.
MemProf: A Memory Profiler for NUMA Multicore
Systems
Renaud Lachaize, Baptiste Lepers, Vivien Quéma
To cite this version:
Renaud Lachaize, Baptiste Lepers, Vivien Quéma. MemProf: A Memory Profiler for NUMA Multicore
Systems. Proceedings of the 2012 USENIX Annual Technical Conference, Jun 2012, Boston, United
States. pp.53–64. �hal-00945731v2�
MemProf: a Memory Profiler for NUMA Multicore Systems
Renaud Lachaize
†UJF
Baptiste Lepers
†CNRS
Vivien Quéma
†GrenobleINP
Abstract
Modern multicore systems are based on a Non-Uniform Memory Access (NUMA) design. Efficiently exploiting such architectures is notoriously complex for program-mers. One of the key concerns is to limit as much as pos-sible the number of remote memory accesses (i.e., main memory accesses performed from a core to a memory bank that is not directly attached to it). However, in many cases, existing profilers do not provide enough informa-tion to help programmers achieve this goal.
This paper presents MemProf, a profiler that al-lows programmers to choose and implement efficient application-level optimizations for NUMA systems. MemProf builds temporal flows of interactions between threads and objects, which help programmers understand why and which memory objects are accessed remotely. We evaluate MemProf on Linux using four applications (FaceRec, Streamcluster, Psearchy, and Apache) on three different machines. In each case, we show how MemProf helps us choose and implement efficient optimizations, unlike existing profilers. These optimizations provide significant performance gains (up to 161%), while re-quiring very lightweight modifications (10 lines of code or less).
1
Introduction
Multicore platforms are nowadays commonplace and an increasing share of them are based on a Non Uniform Memory Access (NUMA) architecture, i.e., with a set of nodes interacting via interconnect links, each node host-ing a memory bank/controller and a group of cores. It is well-known that developing efficient code on such ar-chitectures is very difficult since many aspects of
hard-†Also affiliated with LIG - CNRS UMR 5217.
ware resource management (e.g., regarding I/O devices, shared caches and main memory) can strongly impact performance. In this paper, we focus on remote
mem-ory accesses, i.e., main memory accesses performed on node N1 by a thread running on a core from another node
N2. Remote memory accesses are a major source of in-efficiency because they introduce additional latencies in the execution of instructions. These latencies are due to the extra hops required for the communication between a core and a remote memory controller and also possibly to contention on the interconnect links and on the memory controllers [3].
Several techniques have been proposed to reduce the number of remote memory accesses performed by applications running on a NUMA machine, such as memory page duplication [8, 18] or contention-aware scheduling with memory migration [3]. These tech-niques are “generic” (i.e., application-agnostic): they rely on heuristics and are typically implemented within the OS. However, while useful in some contexts (e.g., co-scheduling), these heuristics (and the online moni-toring logic that they require) are not always appropri-ate since they can possibly hurt the performance of an application, as we show in Section 5. An alternative approach consists in introducing application-level opti-mizations through lightweight modifications of the ap-plication’s source code. For example, a programmer can improve the placement of threads and objects by, among other optimizations, modifying the choice of the alloca-tion pool, pinning a thread on a node, or duplicating an object on several memory nodes. Yet, application-level optimization techniques suffer from a significant short-coming: it is generally difficult for a programmer to de-termine which technique(s) can be applied to a given ap-plication/workload. Indeed, as we show in this paper, diagnosing the issues that call for a specific application-level technique requires a detailed view of the interac-tions between threads an memory objects, i.e., the ability to determine which threads access which objects at any
point in time during the run of an application, and ad-ditional information such as the source and target nodes of each memory access. However, existing profilers like OProfile [13], Linux Perf [19], VTune [7] and Mem-phis [12] do not provide this required information in the general case. Some of them are able to provide this in-formation in the specific case of global static memory objects but these objects often account for a negligible ratio of all remote memory accesses. As an example, for the four applications that we study in this paper, global static memory objects are involved in less than 4% of all remote memory accesses. For the other kinds of objects, the only data provided by the existing profilers are the target memory address and the corresponding program instruction that triggered the access.
In this paper, we present MemProf, the first profiler able to determine the thread and object involved in a given remote memory access performed by an applica-tion. MemProf builds temporal flows of the memory ac-cesses that occur during the run of an application. Mem-Prof achieves this result by (i) instrumenting thread and memory management operations with a user library and a kernel module, and (ii) leveraging hardware support from the processors (Instruction-Based Sampling) to monitor the memory accesses. MemProf allows precisely iden-tifying the objects that are involved in remote memory accesses and the corresponding causes (e.g., inefficient object allocation strategies, saturation of a memory node, etc.). Besides, MemProf also provides additional infor-mation such as the source code lines corresponding to thread and object creations and destructions. MemProf can thus help a programmer quickly introduce simple and efficient optimizations within a complex and unfamiliar code base. We illustrate the benefits of MemProf on four case studies with real applications (FaceRec [9], Stream-cluster [2], Psearchy [4], and Apache [1]). In each case, MemProf allowed us to detect the causes of the remote memory accesses and to introduce simple optimizations (impacting less than 10 lines of code), and thus to achieve a significant performance increase (the gains range from 6.5% to 161%). We also show that these application-specific optimizations can outperform generic heuristics.
The rest of the paper is organized as follows. Sec-tion 2 describes a few examples of execuSec-tion patterns that can benefit from NUMA optimizations and then ex-plains why traditional profilers are not able to pinpoint them. Section 3 presents the main principles of MemProf and how it can be used. Section 4 provides implementa-tion details. Secimplementa-tion 5 presents an evaluaimplementa-tion of MemProf on four applications. Finally, Section 6 discusses related work and Section 7 concludes the paper.
2
The case for a new profiler
In this section, we present a few examples of optimiza-tions that can be implemented when specific memory ac-cess patterns occur in an application. We then explain why existing profilers fail to detect such patterns.
2.1
Application-level NUMA optimizations
We describe a set of three example patterns that negatively impact the performance of applications deployed on NUMA machines. These patterns are inefficient because they increase the number of re-mote memory accesses performed by an application and their overhead can be significant if they impact objects that are heavily accessed. We review each pattern in turn and explain typical optimizations that can be applied at the application level in order to avoid it.
(b) time time Thread T1 (node N1) Thread T2 (node N2) Use Obj1 (node N1) Use Obj1 (node N1) Use Obj1 (node N1) Use Obj1 (node N1) Use Obj1 (node N1) time time Use Obj1 (node N1) (c) Thread T1 (node N1) Thread T2 (node N2) Allocate Obj1 (node N1) time (a) Use Obj1 (node N1) time Thread T1 (node N1) Thread T2 (node N2)
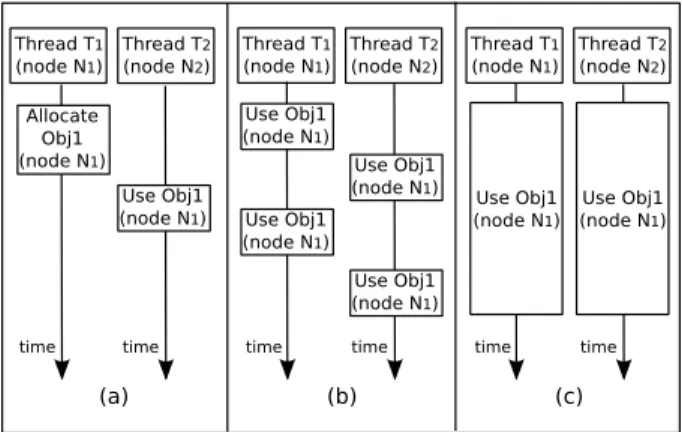
Figure 1: Three memory access patterns that can nega-tively impact the performance of applications deployed on NUMA machines.
Remote usage after allocation. This pattern (depicted
in Figure 1 (a)) occurs when an object is allocated by a thread T1 on a memory node N1, and later accessed
exclusively (or mostly) by a thread T2running on a node N2. This pattern often occurs in an application with
a producer-consumer scheme when the producer and consumer threads are pinned on distinct cores. A simple optimization consists in directly allocating the object on
N2, using NUMA-aware allocation functions. When the
application is such that N2 cannot be determined at the
time of the object allocation, another solution consists in migrating the object when T2 starts to access it,
provided that the cost of the data copy can be amortized. Such a migration can be implemented in two ways in the application: (i) using an explicit copy to a buffer allocated on a given node with a NUMA-aware function, or (ii) using a system call to transparently migrate and
remap the set of virtual memory pages that contain the object (e.g.,move_pages() in Linux).
Alternate remote accesses to an object. In this pattern
(depicted in Figure 1 (b)), there are several threads that access a given object over time, but each thread performs its accesses during a disjoint time interval. A first possible optimization consists in adjusting thread placement with respect to the object. Thread placement can be managed in two ways: (i) pinning all the corre-sponding threads on the node that hosts the object, or (ii) migrating threads over time according to the data they access in a given execution phase. Note that, for some applications, both strategies may create significant load imbalance and thus be inefficient, e.g., when some cores are left idle. A second possible optimization consists in migrating the object close to the thread that currently accesses it (using the migration techniques described in the previous paragraph).
Concurrent remote accesses to an object. In this
pat-tern (depicted in Figure 1 (c)), the object is accessed by several threads during long overlapping time intervals. A first possible optimization to address this pattern con-sists in pinning all the corresponding threads on the node that hosts the object. Like in the previous case, this optimization may create significant imbalance and thus be inefficient for some applications. A second possible optimization consists in duplicating the object on sev-eral memory nodes. This optimization implies to syn-chronize the multiples object copies (like in a distributed shared memory system) and increases the memory foot-print. Consequently, it is mostly applicable to read-only or read-mostly objects whose replication footprint does not exceed the available memory capacity. Finally, if the memory controller of node N1 is saturated (which can
be detected by evaluating the average latencies of mem-ory accesses), two possible optimizations can be consid-ered. The first one consists in balancing the allocation of the different “hottest” objects over multiple memory nodes in order to spread the load. If this optimization cannot be applied, e.g., because the saturation is caused by a few large objects, a second possible optimization consists in interleaving the allocation of each such object over the different memory nodes1. Note that, in this case,
the optimizations do not necessarily decrease the number of remote memory accesses but allow keeping the corre-sponding latencies as low as possible by avoiding link or controller saturation.
1An application programmer can typically introduce the latter
opti-mization at the page granularity using a kernel API (such asmbind() with theMPOL_INTERLEAVE flag in Linux).
2.2
Limitations of existing profilers
This section studies whether existing profilers can help detecting inefficient patterns such as the ones described in Section 2.1. We show below that these profilers are ac-tually not able to do so in the general case, because they cannot precisely determine whether two threads access the same object (in main memory) or not2.
Using existing profilers, a developer can determine, for a given memory access performed by a thread, the involved virtual and physical addresses, as well as the corresponding source code line (e.g., a C/C++ state-ment) and assembly-level instruction, and the function call chain. In order to extract inefficient thread/memory interaction patterns from such a raw trace, a program-mer has to determine if two given individual memory ac-cesses actually target the same object instance or not.
In the case of global statically allocated objects, the answer can be found by analyzing the information em-bedded in the program binary and the system libraries, from which the size and precise virtual address range of each object can be obtained. This feature is actually implemented by tools like VTune and Memphis. Un-fortunately, according to our experience with a number of applications, this kind of objects only account for a very low fraction of the remote memory accesses (e.g., less than 4% in all applications studied in Section 5). In the more general case, i.e., with arbitrary kinds of dynamically-allocated objects, the output of existing pro-filers (addresses and code paths) is not sufficient to reach a conclusion, as explained below.
First, existing profilers do not track and maintain enough information to determine the enclosing object instance corresponding to a given (virtual or physical) memory address. Indeed, as the lifecycle of dynamic objects is not captured (e.g., dynamic creations/destruc-tions of memory mappings or application-level objects), the address ranges of objects are not known. Moreover, a given (virtual or physical) address can be reused for dif-ferent objects over time. In addition, virtual-to-physical mappings can also evolve over time (due to swap activity or to page migrations) and their lifecycle is not tracked either.
Second, the additional knowledge of the code path (function call chain and precise instruction) that causes a remote memory access is also insufficient to determine if several threads access the same memory object. Some applications are sufficiently simple to determine the ac-cessed object using only the code path provided by ex-isting profilers. However, in practice, we found that this was not the case on any of the applications that we stud-ied. In general, the code path is often helpful to
deter-2From the application-level perspective, these accesses correspond
mine the object type related to a given remote memory access, but does not allow pinpointing the precise object
instancebeing accessed. Indeed, the internal structure and workloads of many applications are such that the same function is successively called with distinct argu-ments (i.e., pointers to distinct instances of the same ob-ject type), and only a subset of these invocations causes remote memory accesses. For instance, in Section 5.2, we show the example of an application (FaceRec) that processes nearly 200 matrices, and where only one of them is involved in a large number of remote memory accesses.
3
MemProf
In this section, we present MemProf, the first NUMA profiler allowing the capture of interactions between threads and objects. More precisely, MemProf is able to associate remote memory accesses with memory-mapped files, binary sections thread stacks, and with ar-bitrary objects that are statically or dynamically allocated by applications. This section is organized as follows: we first give an overview of MemProf. Second, we describe the output provided by MemProf. Finally, we describe how MemProf can be used to detect patterns such as the ones presented in Section 2.1.
3.1
Overview
MemProf aims at providing sufficient information to find and implement appropriate solutions to reduce the num-ber of remote memory accesses. The key idea behind MemProf is to build temporal flows of interactions be-tween threads and in-memory objects. Intuitively, these flows are used to “go back in an object’s history” to find out which and when threads accessed the object re-motely. Processing these flows allows understanding the causes of remote memory accesses and thus designing appropriate optimizations.
MemProf distinguishes five types of objects that we have found important for NUMA performance troubleshooting: global statically allocated objects, dynamically-allocated objects, memory-mapped files, sections of a binary mapped by the operating system (i.e., the main binary of an application or dynamic libraries) and thread stacks. MemProf associates each memory ac-cess with an object instance of one of these types.
MemProf records two types of flows. The first type of flow represents, for each profiled thread, the timeline of memory accesses performed by this thread. We call these flows Thread Event Flows (TEFs). The second type of flow represents, for each object accessed in memory, the timeline of accesses performed on the object. We call these flows Object Event Flows (OEFs).
These two types of flows give access to a large num-ber of indicators that are useful to detect patterns such as the ones presented in Section 2.1: the objects (types and instances) that are accessed remotely, the thread that allocates a given object and the threads that access this object, the node(s) where an object is allocated, accessed from and migrated to, the objects that are accessed by multiple threads, the objects that are accessed in a read-only or in a read-mostly fashion, etc. Note that differ-ent views can be extracted from MemProf’s output, i.e., either focused on a single item (thread/object) or aggre-gated over multiple items. In addition, the temporal in-formation can be exploited to detect some specific phases in an application run, e.g., read/write phases or time in-tervals during which a memory object is accessed with a very high latency (e.g., due to the intermittent saturation of a memory controller).
In the remainder of this section, we first describe the output of MemProf. We then provide details on the way to use MemProf.
3.2
Output
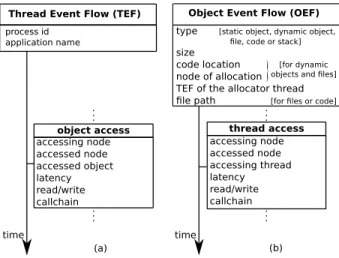
MemProf builds one Thread Event Flow (TEF) per pro-filed thread T . An example of TEF is given in Fig-ure 2 (a). The TEF of a given thread T contains a list of “object accesses”; each “object access” corresponds to a main memory access performed by T . The “object accesses” are organized in chronological order inside the TEF. They contain: (i) the node from which the access is performed, (ii) the memory node that is accessed, (iii) a reference to the Object Event Flow of the accessed ob-ject, (iv) the latency of the memory access, (v) a boolean indicating whether the access is a read or a write opera-tion, and (vi) a function call chain. The TEF of a given thread T also contains some additional metadata: the PID of T and the process binary filename. These metadata allow computing statistics about threads of the same pro-cess and the threads of a common application.
Object Event Flows (OEFs) provide a dual view of the information contained in the TEFs. MemProf builds one OEF per object O accessed in memory. An example of OEF is given in Figure 2 (b). The OEF of an object O is composed of “thread accesses”, ordered chronologically. Each “thread access” corresponds to a memory access to
O. The “thread accesses” store similar information as the one found in “object accesses”. The only difference is that instead of containing a reference to an OEF, an “ob-ject access” contains a reference to the TEF of the thread accessing O. The OEF of a memory object O also con-tains metadata about O: the type of the object (among the 5 types described in Section 3.1), the size of the object, the line of code where the object was allocated or de-clared. Besides, there are some additional metadata for a
Thread Event Flow (TEF) time process id application name object access accessing node accessed node accessed object latency read/write callchain
Object Event Flow (OEF)
time thread access accessing node accessed node accessing thread latency read/write callchain . . . . . . ... . . . (a) (b)
type [static object, dynamic object, file, code or stack]
size code location node of allocation TEF of the allocator thread file path [for files or code]
[for dynamic objects and files]
Figure 2: The two types of flows built by MemProf. There is (a) a Thread Event Flow per profiled thread, and (b) an Object Event Flow per object accessed during the profiling session.
dynamically-allocated object, as depicted in Figure 2.
3.3
Using MemProf
MemProf provides a C API to process the TEFs and OEFs. This API provides functions to process events and metadata contained in the TEFs and OEFs. Using this API, it is possible to compute statistics about a sin-gle thread or object, or about a group of threads or ob-jects. Due to lack of space, we do not provide a detailed description of the API. Rather, we provide a simple ex-ample of script that can be written using this API in Fig-ure 3. This script computes the average time between two memory accesses performed by distinct threads on an object. Such a script can be used, for instance, to esti-mate the relevance of implementing a memory migration optimization.
MemProf provides a set of generic scripts whose out-put is often sufficient for understanding the symptoms of an application, e.g., ratio and number of remote memory accesses, list of the most accessed object types, access patterns corresponding to an object type or to a specific object instance.
4
Implementation
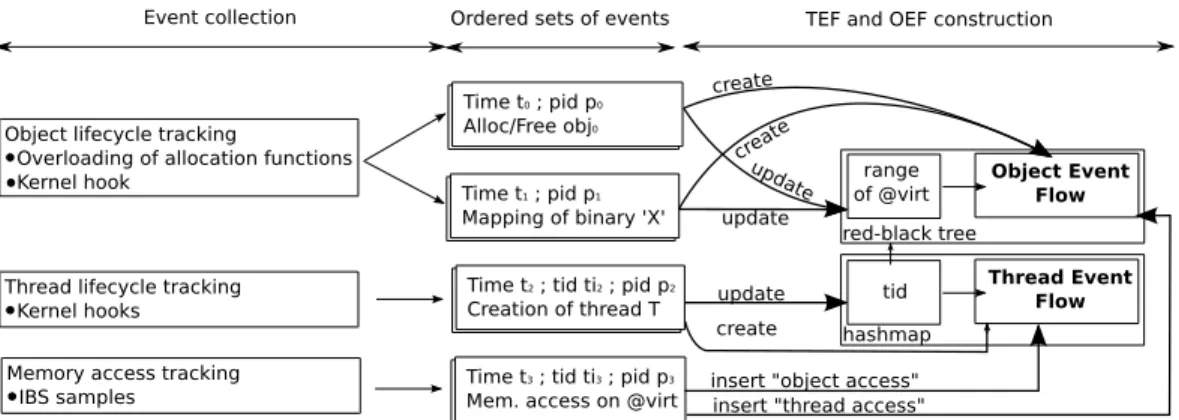
In this section, we present the implementation of Mem-Prof for Linux. MemMem-Prof performs two main tasks, illus-trated in Figure 4. The first task (online) consists in col-lecting events (thread creation, object allocation, mem-ory accesses, etc.) that are then processed by the second task (in an offline phase), which is in charge of construct-ing the flows (TEFs and OEFs). We review each task in
oef o = ...; t h r e a d _ a c c e s a ;
u64 last_tid = 0 , last_rdt = 0; u64 n b _ t i d _ s w i t c h = 0; u64 t i m e _ p e r _ t i d = 0; f o r e a c h _ t a c c e s s(o , a ) { if ( a . tid == last_tid ) continue ; n b _ t i d _ s w i t c h++; t i m e _ p e r _ t i d += a . rdt - last_rdt ; last_tid = a . tid ; last_rdt = a . rdt ; } if ( n b _ t i d _ s w i t c h e s)
printf (" Avg time : % lu cycles (% lu switches )\ n " , t i m e _ p e r _ t i d/ nb_tid_switch , n b _ t i d _ s w i t c h);
Figure 3: A script computing the average time between two memory accesses by distinct threads to an object.
turn.
4.1
Event collection
The event collection task consists in tracking the life cycle of objects and threads, as well as the memory accesses.
Object lifecycle tracking. MemProf is able to track the
allocation and destruction of different types of memory objects, as decribed below.
MemProf tracks the lifecycle of dynamically allocated memory objects and memory-mapped files by overload-ing the memory allocation functions (malloc, calloc, realloc, free, mmap and munmap) called by the threads that it profiles. MemProf can also be adapted to overload more specialized functions when an application does not use the standard allocation interfaces. Function over-loading is performed by linking the profiled applications with a shared library provided by MemProf, through the dynamic linker’sLD_PRELOAD and dlsym facilities3.
MemProf tracks the lifecycle of code sections and global static variables with a kernel module that over-loads theperf_event_mmap function. This function is called on every process creation, when the binary and li-braries of the process are mapped in memory. It provides the size, virtual address and “content” (e.g., file name) of newly mapped memory zones.
For each kind of object, MemProf stores the virtual address of the created or destroyed object. It also stores a timestamp, the tid of the calling thread, the CPUID on which the function is called and a callchain. The timestamp is required to determine the lifecycle of memory objects. The tid is necessary to know in which virtual address space the object is allocated. The CPUID
3MemProf can thus work on applications whose source code is not
available. However, its insight may be somewhat restricted in such a case (e.g., given the lack of visibility over the accessed object types).
Object lifecycle tracking
Overloading of allocation functions
Kernel hook Time t
1 ; pid p1
Mapping of binary 'X' Time t2 ; tid ti2 ; pid p2
Creation of thread T Time t0 ; pid p0
Alloc/Free obj0
Time t3 ; tid ti3 ; pid p3
Mem. access on @virt
Thread Event Flow tid Object Event Flow range of @virt
Event collection TEF and OEF construction
create updat e update crea te update
insert "object access" insert "thread access" Ordered sets of events
Thread lifecycle tracking Kernel hooks Memory access tracking IBS samples
create
red-black tree
hashmap
Figure 4: Implementation of MemProf. MemProf performs two tasks: event collection (online) and flow construction (offline). Due to space restrictions, we only present the most important fields of the collected events.
is needed for the corresponding OEF metadata. The callchain is required to find the line of code where the object was allocated.
Thread lifecycle tracking. In order to detect thread
(and also stack) creations and destructions, MemProf overloads two kernel functions: perf_event_task and perf_event_comm, which are called upon such events. The perf_event_task function provides the thread id of newly created/destroyed threads, and the perf_event_comm function provides the name of newly created threads. MemProf records these metadata and associates them with a timestamp and a pid.
Memory access tracking. Memory accesses are tracked
using Instruction Based Sampling (IBS) [5], a profiling mechanism introduced by the “AMD Family 10h” line of processors4. It works at the microarchitecture level by periodically selecting a random instruction and record-ing performance information about its execution. An interrupt is generated when the selected instruction has been fully executed. This interrupt is caught by the ker-nel module and the IBS sample is saved in a per-CPU buffer. For instructions that reference a memory loca-tion, the processor collects the virtual and physical ad-dress of the location, the number of clock cycles required to fetch the data, the level where the data was found in the memory hierarchy (in one of the caches, in the local DRAM bank or in a remote DRAM bank), and the access type (read or write). In addition to the information pro-vided by the IBS registers, the kernel module also saves a timestamp, the CPUID of the core, as well as the thread id and stack boundaries of the executing thread.
4IBS is only available for AMD processors but a similar
hardware-level profiling mechanism, called PEBS [16], exists for Intel proces-sors. MemProf’s kernel module could easily be extended to leverage PEBS.
4.2
TEF and OEF construction
Once the events have been collected, MemProf builds (offline) the OEF and TEF of the profiled application(s). As illustrated in Figure 4, the events are first ordered by timestamp. MemProf then iterates over the ordered list of events and builds the flows as follows. MemProf cre-ates a new TEF each time a new thread is created and an OEF each time a new object is allocated. MemProf stores (i) the TEFs in a hashmap indexed by the tid of their thread and (ii) the OEFs in a per-process red-black tree structure. This red-black tree allows finding if a vir-tual address corresponds to a previously allocated object (e.g., if an object O is allocated on the virtual address range[0x5 − 0x10], then a request for the address 0x7 will return the OEF of O). When an object is destroyed, its OEF is removed from the red-black tree.
For each memory access to a given virtual address, MemProf (i) creates a “thread access” and inserts it in the TEF of the thread that performed the memory ac-cess, and (ii) searches in the red-black tree for the OEF that corresponds to the accessed virtual address; if it ex-ists, MemProf creates an “object access" and inserts it in the OEF. Note that in most cases, the OEF exists in the red-black tree; the only exceptions are (i) when a mem-ory access targets the stack of a thread, and (ii) when the physical address is outside the valid range of phys-ical addresses5. MemProf assigns all memory accesses performed on stacks to a single (per-process) OEF rep-resenting all stacks. Indeed, we observed in practice that stacks represent only a small percentage of remote memory accesses and it is thus sufficient to regroup all memory accesses performed on stacks in a single OEF. Moreover, MemProf ignores physical addresses that are outside the valid range of physical addresses.
5The hardware creates IBS samples with such addresses when it
monitors special assembly instructions likerdtscll, which is used to read the timestamp counter.
5
Evaluation
In this Section, we evaluate MemProf using four appli-cations: FaceRec, Streamcluster, Apache and Psearchy. The first three applications perform a significant number of remote memory accesses. The last one performs fewer remote memory accesses but is memory-intensive. For each application, we first try to optimize the application using the output of existing profilers, i.e., instruction-oriented profilers like Perf and data-instruction-oriented profilers like Memphis. We show that the latter do not give pre-cise insights on what and how to optimize the applica-tion. We then profile the application with MemProf and show that it allows precisely pinpointing the causes of remote memory accesses and designing appropriate opti-mizations to mitigate them. These optiopti-mizations are very simple (less than 10 lines of code) and efficient (the gains range from 6.5% to 161%). Finally, we conclude this section by a study of the overhead induced by MemProf.
5.1
Testbed
We perform the evaluation using three NUMA-machines (with 16, 24 and 48 cores respectively) presented below. They all run the Linux kernel v2.6.35 and eGlibc v2.11.
Machine A has 4 AMD Opteron 8380 processors
clocked at 2.5GHz with 4 cores in each (16 cores in to-tal), 32GB of RAM and 20 1Gb/s Ethernet ports. It fea-tures 4 memory nodes (i.e., 4 cores and 8GB of RAM per node) interconnected with HyperTransport 1.0 links.
Machine B has 2 AMD Opteron 6164 HE processors
clocked at 1.7 GHz with 12 cores in each (24 cores in to-tal) and 48 GB of RAM. It features 4 memory nodes (i.e., 6 cores and 12 GB of RAM per node) interconnected with HyperTransport 3.0 links.
Machine C has 4 AMD Opteron 6174 processors
clocked at 2.2 GHz with 12 cores in each (48 cores in total) and 256 GB of RAM. It features 8 memory nodes (i.e., 6 cores and 32 GB of RAM per node) intercon-nected with HyperTransport 3.0 links.
5.2
FaceRec
FaceRec is a facial recognition engine of the ALPBench benchmark suite [9]. We use the default workload included in the suite. FaceRec performs 63% of its memory accesses on remote memory. We first try to optimize FaceRec using existing profilers. We obtain a performance improvement ranging from 9% to 15%. We then try to optimize FaceRec using MemProf. We obtain a performance improvement ranging from 16% to 41%.
Optimization using existing profilers. Instruction-oriented profilers allow understanding that most remote
memory accesses are performed in one function (see the output of the Perf profiler, presented in Table 1). This function takes two matrices as arguments and performs a matrix multiplication. It is called on all matrices ma-nipulated by the application (using MemProf, we learn that 193 matrices are allocated during a run of the default ALPBench workload). Instruction-oriented profilers do not allow determining which matrices induce large num-bers of remote memory accesses.
% of total remote accesses Function
98 transposeMultiplyMatrixL
0.08 malloc
Table 1: Functions performing most remote memory ac-cesses in FaceRec.
Data-oriented profilers show that no remote memory access is performed on global statically allocated objects. Moreover, they allow gathering the list of virtual ad-dresses that are accessed remotely, together with the ratio of remote memory accesses that each virtual address ac-counts for. Nevertheless, it is not possible to determine if a range of accessed addresses represents one or more matrices. Indeed, FaceRec allocates matrices of differ-ent sizes, and each range of virtual addresses can be used to store different matrices during different time intervals (MemProf actually shows that FaceRec allocates sev-eral matrices on the same virtual address ranges). Con-sequently, existing profilers do not allow understanding which matrices induce many remote memory accesses.
The optimizations that can be envisioned using the output of existing profilers are: (i) duplicating all matrices on all nodes, or (ii) interleaving the memory allocated for all matrices on all nodes. Both opti-mizations require the developer to retrieve all places in the code where matrices are allocated. We did not implement the first optimization because it requires writing complex code to synchronize the state of matrices whenever they are updated. Moreover, we know (using MemProf) that this optimization will not induce good performance. Indeed, MemProf shows that some matrices are often updated, and thus that the synchronization code would be frequently triggered. We tried the second optimization, which is simple to implement: it consists in replacing the calls tomalloc with calls to numa_alloc_interleaved. This opti-mization induces performance improvements of 15%, 9% and 13% on respectively Machines A, B and C. Note that this optimization increases the number of remote memory accesses, but decreases the contention on one of the memory nodes, hence the performance improvement.
Optimization using MemProf. MemProf points out that
most remote memory accesses are performed on a single matrix (see Table 2). This explains why the
optimiza-tion presented in the previous paragraph induced a per-formance improvement: it decreases the contention on the memory node hosting this matrix. Using the OEF of this matrix, we observe that, contrarily to some other matrices, this matrix is written only once and then ac-cessed in read-only mode by a set of threads6. We
lever-age this observation as follows: we optimize FaceRec by duplicating this matrix on all nodes after its initialization. As the matrix is never updated, we did not have to write any synchronization code. The matrix occupies 15MB of memory. The footprint overhead of this optimization is thus 45MB on machines A and B (4 nodes) and 105MB on machine C (8 nodes). The implementation of the ma-trix duplication only required 10 lines of code. We sim-ply had to modify thereadAndProjectImages function that initializes this matrix so that it allocates one matrix per node. For simplicity, we stored the various pointers to the matrices in a global array. Threads then choose the appropriate matrix depending on the node they are cur-rently running on. With this optimization, FaceRec only performs 2.2% of its memory accesses on remote mem-ory (63% before the optimization). This results in per-formance improvements of respectively 41%, 26% and 37% on Machines A, B and C.
% of total remote accesses Object
98.8 s->basis(csuCommonSubspace.c:455) 0.2 [static objects of libc-2.11.2.so]
Table 2: Objects remotely accessed in FaceRec.
5.3
Streamcluster
Streamcluster is a parallel data-mining application in-cluded in the popular PARSEC 2.0 benchmark suite [2]. Streamcluster performs 75% of its memory accesses on remote memory. We first try to optimize Streamcluster using existing profilers and obtain a performance im-provement ranging from 33% to 136%. We then try to optimize Streamcluster using MemProf and obtain an improvement ranging from 37% to 161%. This means that Streamcluster is an application for which existing profilers provide enough information to successfully optimize the application, but that MemProf is able to provide details that can be exploited to implement the optimization slightly more efficiently.
Optimization using existing profilers. Instruction-oriented profilers allow understanding that most remote memory accesses are performed in one function (see the output of the Perf profiler, presented in Table 3). This function takes two points as parameters (p1 and p2)
6As MemProf only samples a subset of the memory accesses, we
checked this fact via source code inspection.
and computes the distance between them. The remote accesses are done by the following line of code:
result += (p1.coord[i]-p2.coord[i])*(p1.coord[i]-p2.coord[i]).
An analysis of the assembly code shows that remote memory accesses are performed on the coord field of the points. It is nevertheless not possible to know if all points or only part of them induce remote memory accesses. Instruction-oriented profilers also allow understanding that one of the memory nodes is more loaded than others (i.e., memory accesses targeting this node have a higher latency).
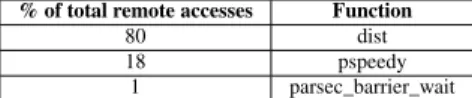
% of total remote accesses Function
80 dist
18 pspeedy
1 parsec_barrier_wait
Table 3: Functions performing most remote memory ac-cesses in Streamcluster.
Data-oriented profilers show that less than 1% of the remote memory accesses are performed on global stat-ically allocated data. Moreover, they show that threads remotely access the same memory pages. This informa-tion is not sufficient to understand if some “points” are more frequently remotely accessed than others (as was the case with matrices in the FaceRec application), nor to understand if threads share data, or if they access dif-ferent objects placed on the same page.
Several optimizations can be proposed: (i) memory duplication, (ii) memory migration, or (iii) memory interleaving. The first one performs poorly if objects are frequently updated. The second one performs poorly if objects are simultaneously accessed by various threads. As we have no information on these two points, and due to the fact that these two optimizations are complex to implement, we did not try them. The third possible optimization makes sense because one node of the system is saturated. Interleaving the memory allows spreading the load of memory accesses on all memory nodes, which avoids saturating nodes. The optimization works as follows: we interleave all the dynamically allocated memory pages thanks to the numactl utility available in recent Linux distributions. With this opti-mization, Streamcluster performs 80% of its memory accesses on remote memory (75% before optimizing), but memory accesses are evenly distributed on all nodes. This optimization improves performance by re-spectively 33%, 136% and 71% on Machines A, B and C.
Optimization using MemProf. MemProf shows that
most remote memory accesses are performed on one ar-ray (see Table 4). Note that a set of objets accounts for 14% of remote memory accesses, but they are not rep-resented in Table 4, as each object individually accounts for less than 0.5% of all remote memory accesses. The
analysis of the OEF of the array shows that it is simul-taneously read and written by many threads. The reason why MemProf allows pinpointing an array, whereas ex-isting profilers point out thecoord fields is simple: the coord fields of the different points are pointers to offsets within a single array (named “block" in Table 4). Mem-Prof also outputs that the array is allocated on a single node, and that the latency of memory accesses to this node is very high (for instance, approximately 700 cy-cles on Machine B). Consequently, to optimize Stream-cluster, we chose to interleave the memory allocated for this array on multiple nodes. This improves performance by respectively 37%, 161% and 82% for Machines A, B and C. As expected, this optimization does not decrease the ratio of remote memory accesses (75%), but it dras-tically reduces the average memory latency to the satu-rated node (430 cycles on Machine B). Note that, using MemProf, the optimization is more efficient: this comes from the fact that only a subset of the memory is inter-leaved: the memory that is effectively the target of re-mote memory accesses.
It is important to note that MemProf also gives infor-mation about the potential benefits of the memory du-plication and memory migration techniques discussed above. Indeed, MemProf shows that the array is fre-quently updated (i.e., there is a high ratio of write ac-cesses), which indicates that memory duplication would probably perform poorly. Moreover, the analysis of the OEF of the array shows that it is simultaneously accessed by several threads, which indicates that memory migra-tion would also probably perform poorly.
% of total remote accesses Object
80.9 float *block(streamcluster.cpp:1852) 4.1 points.p(streamcluster.cpp:1865)
1 [stack]
Table 4: Objects remotely accessed in Streamcluster.
5.4
Psearchy
Psearchy is a parallel file indexer from the Mosbench benchmark suite [4]. Psearchy only performs 17% of its memory accesses on remote memory but it is memory intensive: it exhibits a high ratio of memory accesses per instruction. We first try to optimize Psearchy using existing profilers and do not obtain any performance gain (the only straightforward optimization to implement yields a 14-29% performance decrease). We then try to optimize Psearchy using MemProf and obtain a performance improvement ranging from 6.5% to 8.2%.
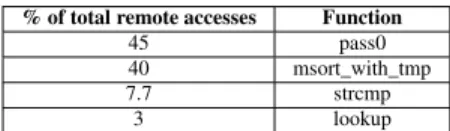
Optimization using existing profilers. Instruction-oriented profilers allow finding the functions that per-form most remote memory accesses (see the output of
the Perf profiler, presented in Table 5). The first function, namedpass0, aims at parsing the content of the files to be indexed. The second function is a sort function pro-vided by the libc library. In both cases, we are not able to determine which objects are targeted by remote mem-ory accesses. For instance, when looking at the assem-bly instructions that induce remote memory accesses in the pass0 function, we are not able to determine if the memory accesses are performed on the file buffers, or on the structures that hold the indexed words. Indeed, the assembly instructions causing remote memory accesses are indirectly addressing registers and we are not able to infer the content of the registers by looking at the code.
% of total remote accesses Function
45 pass0
40 msort_with_tmp
7.7 strcmp
3 lookup
Table 5: Functions performing remote memory accesses in Psearchy.
Data-oriented profilers show that less than 1% of the remote memory accesses are performed on global statically allocated data. As in the case of FaceRec and Streamcluster, Data-oriented profilers show that threads access the same memory pages. We do thus consider the same set of optimizations: (i) memory duplication, (ii) memory migration, or (iii) memory interleaving. For the same reason as in Streamcluster, we do not try to apply the first two optimizations (the analysis performed with MemProf in the next paragraph validates this choice). The third possible optimization does not make sense either. Indeed, contrarily to what we observed for Streamcluster, no memory node is saturated. As this optimization is very simple to implement, we nonetheless implemented it to make sure that it did not apply. It decreases the performance by respectively 22%, 14% and 29% for Machines A, B and C.
Optimization using MemProf. MemProf points out that most remote memory accesses are performed on many different objects. We also observe that these objects are of three different types. We give in Table 6 the percentage that each type of object accounts for with respect to the total number of remote memory accesses. More interestingly, we observe, using the OEFs of all objects, that each object is accessed by a single thread: the thread that allocated it. This means that threads in Psearchy do not share objects, contrarily to what we observed in FaceRec and Streamcluster7. This
observation is important for several reasons. First, it implies that memory duplication and memory migration
7As MemProf only samples a subset of the memory accesses, we
are not suited to Psearchy. Second, it allows under-standing why threads — although not sharing objects — all access the same memory pages: the reason is that all objects are allocated on the same set of memory pages. Using this information, it is trivial to propose a very simple optimization: forcing threads to allocate memory on the node where they run. As threads are not sharing objects, this should avoid most remote memory accesses. We implemented this optimization using the numa_alloc_local function. With this optimization, less than 2% of memory accesses are performed on remote objects and the performance increases by respec-tively 8.2%, 7.2% and 6.5% on Machines A, B and C.
% of total remote accesses Type of object
42 ps.table(pedsort.C:614)
38 tmp(qsort_r+0x86)
10 ps.blocks(pedsort.C:620)
Table 6: Types of the main objects that are remotely ac-cessed in Psearchy.
5.5
Apache/PHP
Apache/PHP [1] is a widely used Web server stack. We benchmark it using the Specweb2005 [15] workload. Because machines B and C have a limited number of network interfaces, we could not use them to benchmark the Apache/PHP stack under high load. On machine A, we observe that the Apache/PHP stack performs 75% of its memory accesses on remote memory. We first try to optimize the Apache/PHP stack using the output of existing profilers. We show that we are not able to pre-cisely detect the cause of remote memory accesses, and that, consequently, all our optimizations fail. We then try to optimize the Apache/PHP stack using MemProf. We show that MemProf allows precisely pinpointing the two types of objects responsible for most remote memory accesses. Using a simple optimization (less than 10 lines of code), we improve the performance by up to 20%.
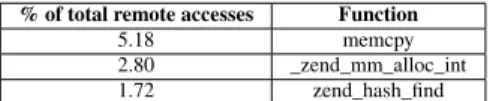
Optimization using existing profilers. Instruction-oriented profilers allow finding the functions that per-form most remote memory accesses (see the output of the Perf profiler, presented in Table 7). No function stands out. The top functions are related to memory operations (e.g.,memcpy copies memory zones) and they are called from many different places on many different variables. It is impossible to know what they access in memory.
Data-oriented profilers show that less than 4% of the remote memory accesses are performed on global stati-cally allocated data. They also show that many threads remotely access the same set of memory pages. Finally, they show that some pages are accessed at different time
% of total remote accesses Function
5.18 memcpy
2.80 _zend_mm_alloc_int
1.72 zend_hash_find
Table 7: Top functions performing remote memory ac-cesses in the Apache/PHP stack.
intervals by different threads, whereas other pages are si-multaneously accessed by multiple threads.
Several optimizations can be tried on Apache/PHP, based on the previously described observations. The first observation we tried to leverage is the fact that some pages are accessed at different time intervals by different threads. Because we did not know which objects are ac-cessed, we designed an application-agnostic heuristic in charge of migrating pages. We used the same heuristic as the one recently described by Blagodurov et al. [3]: ev-ery 10ms a daemon wakes up and migrates pages. More precisely, the daemon sets up IBS sampling, “reads
the next sample and migrates the page containing the memory address in the sample along with K pages in the application address space that sequentially precede and follow the accessed page”. In [3], the value of K is 4096. Unfortunately, using this heuristic, we observed a slight decrease in performance (around 5%). We tried different values for K, but without success. This is probably due to the fact that we use a different software configuration, with many more threads spawned by Apache.
The second observation we tried to leverage is the fact that some pages are simultaneously accessed by multiple threads. As we did not expect Apache threads to share memory pages (each thread is in charge of one TCP connection and handles a dedicated HTTP request stream), we thought there could be a memory allocation problem similar to the one encountered in Psearchy, where threads allocate data on a remote node. We did thus try to use a NUMA-aware memory allocator, i.e., we replaced all calls tomalloc with calls tonuma_alloc_local. This did not impact the perfor-mance. Although no memory node was overloaded, we also tried to interleave the memory using thenumactl utility. This optimization did not impact the performance either. Finally, we thought that the problem could be due to threads migrating from one memory node to another one, thus causing remote memory accesses. Consequently, we decided to pin all Apache threads and all PHP processes at creation time on the different avail-able cores, using a round-robin strategy. To pin threads and processes we used the pthread_set_affinity function. This optimization had a negligible impact on performance (2% improvement).
Apache performs most of its remote memory accesses on two types of objects: variables namedapr_pools, that are all allocated in a single function, and the pointer re-location table (PLT). The PLT is a special section of bi-naries mapped in memory. It is used at runtime to store the virtual address of the library functions used by the bi-nary, such as the the virtual address of thememcpy func-tion. Using the OEF of the PLT and of theapr_pools objects, we found that each of these objects is shared be-tween a set of threads belonging to a same process. Con-sequently, we decided to optimize Apache/PHP by pin-ning all threads belonging to the same Apache processes on the same node. This modification requires less than 10 lines of code and induces a 19.7% performance im-provement. This performance improvement is explained by the fact that the optimization drastically reduces the ratio of remote memory accesses. Using this optimiza-tion, the Apache/PHP stack performs 10% of its memory accesses on remote memory (75% before optimization).
5.6
Overhead
In this section, we briefly study the overhead and accu-racy of MemProf. Note that our observations apply to our three test machines.
The main source of overhead introduced by MemProf is IBS sampling, whose rate is configurable. In order to obtain precise results, we adjust the rate to collect at least 10k samples of instructions accessing DRAM. For most of the applications that we have observed, this translates into generating one IBS instruction every 20k clock cy-cles, which causes a 5% slowdown. For applications that run for a short period of time or make few DRAM ac-cesses, it may be necessary to increase the sampling rate. In all the applications that we studied, we found it unnec-essary to go beyond a sampling rate of one IBS interrupt every 8k cycles, which induces a 20% slowdown.
The costs of IBS processing can be detailed as follows. Discarding a sample (for instructions that do not access DRAM) takes 200 cycles while storing a relevant sample in a per-CPU buffer requires 2k cycles. The storage of samples is currently not heavily optimized. A batch of 10k samples requires 2MB and we preallocate up to 5% of the machine RAM for the buffers, which haven proven acceptable constraints in practice.
The second source of overhead in MemProf is the tracking of the lifecycles of memory objects and threads performed by the user library and the kernel module. The interception of a lifecycle event and its online process-ing by the user library requires 400 cycles. This track-ing introduces a negligible slowdown on the applications that we have studied. The storage of 10k events requires 5.9MB in user buffers, for which we preallocate 20MB of the machine RAM. The processing and storage
over-heads induced by the kernel-level tracking are signifi-cantly lower.
Finally, the offline processing (required to build OEFs and TEFs) for a MemProf trace corresponding to a 1-minute application run takes approximately 5 seconds.
6
Related work
Several projects have focused on profiling for multicore machines. Memphis [12] is a profiler for NUMA-related performance problems. It relies on IBS [5] to find global statically allocated objects that are accessed remotely. VTune [7] uses PEBS (an IBS-like mechanism) to find virtual addresses that are accessed remotely in memory. MemProf extends these works by also identifying the re-mote memory accesses to dynamically allocated objects, files and code sections and by providing detailed tem-poral information about these accesses. DProf [14] has been designed to locate kernel structures which induce poor cache behaviors. DProf offers “views" that help de-velopers determine the cause of cache misses. MemProf transposes this work in the context of NUMA-related is-sues and extends it to application-level profiling. Unlike DProf, MemProf is able to identify object instances, not only object types, a useful feature for many applications. Traditional profilers, such as Oprofile [13] and Perf [19] are able to leverage the performance counters available in recent processors to pinpoint the functions and assem-bly instructions that perform distant accesses. As seen in Section 5, this information is generally not sufficient to make an accurate NUMA performance diagnosis.
Several research projects have focused on improving NUMA APIs. The Linux kernel [11] offerscpusets fa-cilities that can be used to enforce global memory poli-cies on an application (e.g., forcing an application to allocate memory on a limited set of nodes). Goglin et al. [6] have developed a fastmove_pages() system call in Linux. These works can be leveraged to implement efficient NUMA optimizations, when they are found to be relevant for an application.
Several research projects have used heuristics for au-tomatic mitigation of remote memory accesses. Marathe et al. [10] proposed an automatic page placement tool, which deduces a good placement from a partial run of an application. The tool records memory accesses per-formed during this partial run and computes the node N from which each allocated memory page P is accessed the most. The application is then re-launched with each page P being allocated from its corresponding node N. This tool is not adapted to applications with multiple ex-ecution phases, unlike MemProf. Blagodurov et al. [3] have developed a NUMA-aware scheduler that tries to in-crease locality and limit contention on critical hardware resources (e.g., memory links and caches). They noticed
that, when a thread is migrated to another node, it is best to also migrate its working set. The number of mem-ory pages to be migrated was determined experimen-tally. Several works [8, 18] presented automatic page duplication and migration policies. The aggressiveness of a policy can be manually adjusted and has to be care-fully chosen to avoid excessive page bouncing between nodes. Thread Clustering [17] is a scheduling technique that tries to improve cache locality by placing threads sharing data on cores sharing a cache. It is not NUMA-aware but, according to its authors, could be easily trans-formed to improve locality on NUMA machines. Thread Clustering measures the “similarity” of memory accesses performed by distinct threads and clusters threads with high pairwise similarity values. All these works focus on automatically improving the performance of applica-tions and rely on carefully tuned heuristics to increase the locality of data processing. MemProf adopts a com-plementary approach by offering developers the oppor-tunity to determine why their applications perform re-mote memory accesses, in order to implement optimiza-tions inside their applicaoptimiza-tions. Besides, MemProf could be used to determine why a given heuristic does not pro-vide the expected performance improvement with a given workload or machine, thus helping the design of heuris-tics that work on a broader range of situations.
7
Conclusion
Remote memory accesses are a major source or ineffi-ciency on NUMA machines but existing profilers pro-vide little insight on the execution patterns that induce them. We have designed and implemented MemProf, a profiler that outputs precise and configurable views of in-teractions between threads and memory objects. Our ex-perience with MemProf on four applications shows that it provides programmers with powerful features with re-spect to the existing tools for performance diagnostics on NUMA multicore machines. We find that MemProf is particularly helpful for applications that exhibit a behav-ior with at least one of the following characteristics: (i) many object types and/or instances with arbitrary lifes-pans (and possibly diverse popularities or access pat-terns), (ii) changing access patterns over time, and (iii) custom memory management routines.
MemProf has two main limitations that we plan to ad-dress in our future work. First, it relies on programmers to establish a diagnosis and devise a solution. Second, MemProf is mostly useful for applications that are not cache efficient and that perform a high number of mem-ory accesses. We believe that a more comprehensive pro-filer should jointly consider the impact of both cache and main memory access patterns, in order to determine the right balance between possibly conflicting optimizations
for theses two aspects.
Acknowledgments We thank the anonymous review-ers and our shepherd, Alexandra Fedorova, for their feed-back that improved the paper. This work was partially funded by the French SocEDA project and by a hardware grant from INRIA. Some of the experiments were car-ried out on machines from (i) the MESCAL and MOAIS teams of INRIA/LIG and (ii) the Grid’5000 testbed being developed under the INRIA ALADDIN action with sup-port from CNRS, RENATER, several Universities and other funding bodies (see http://www.grid5000.fr).
References
[1] APACHEHTTP SERVER.http://httpd.apache.org. [2] BIENIA, C., ANDLI, K. PARSEC 2.0: A New Benchmark
Suite for Chip-Multiprocessors. In Proceedings of the 5th Annual
Workshop on Modeling, Benchmarking and Simulation(2009). [3] BLAGODUROV, S.,ET AL. A case for NUMA-Aware Contention
Management on Multicore Systems. In Proceedings of USENIX
ATC(2011).
[4] BOYD-WICKIZER, S.,ET AL. An Analysis of Linux Scalability to Many Cores. In Proceedings of OSDI (2010).
[5] DRONGOWSKI, P. J. Instruction-Based Sampling: A New Performance Analysis Technique for AMD Family 10h Proces-sors, 2007.http://developer.amd.com/Assets/AMD_IBS_ paper_EN.pdf.
[6] GOGLIN, B.,ANDFURMENTO, N. Enabling High-Performance Memory Migration for Multithreaded Applications on Linux. In
Proceedings of IPDPS(2009).
[7] INTEL VTUNE. http://software.intel.com/en-us/ articles/intel-vtune-amplifier-xe/.
[8] LAROWE, JR., R. P.,ET AL. Evaluation of NUMA Memory Management Through Modeling and Measurements. IEEE TPDS
3, 6 (1992), 686–701.
[9] LI, M.-L.,ET AL. The ALPBench Benchmark Suite for Com-plex Multimedia Applications. In Proceedings of ISWC (2005). [10] MARATHE, J.,ANDMUELLER, F. Hardware Profile-Guided
Au-tomatic Page Placement for ccNUMA Systems. In Proceedings
of PPoPP(2006).
[11] MAUERER, W. Professional Linux Kernel Architecture. Wrox Press, 2008.
[12] MCCURDY, C.,ANDVETTER, J. Memphis: Finding and Fixing NUMA-Related Performance Problems on Multi-Core Platforms. In Proceedings of ISPASS (2010).
[13] OPROFILE. A System Profiler for Linuxhttp://oprofile. sourceforge.net.
[14] PESTEREV, A.,ET AL. Locating Cache Performance Bottlenecks Using Data Profiling. In Proceedings of EuroSys (2010). [15] SPEC. (Standard Performance Evaluation Corporation).
SPECweb2005.http://www.spec.org/web2005/.
[16] SPRUNT, B. Pentium 4 Performance-Monitoring Features.
Mi-cro, IEEE 22, 4 (2002), 72–82.
[17] TAM, D.,ET AL. Thread Clustering: Sharing-Aware Scheduling on SMP-CMP-SMT Multiprocessors. In Proceedings of EuroSys (2007).
[18] VERGHESE, B.,ET AL. Operating System Support for Improv-ing Data Locality on CC-NUMA Compute Servers. In
Proceed-ings of ASPLOS(1996).
[19] WEAVER, V. The Unofficial Linux Perf Events Web-Page. http://web.eecs.utk.edu/~vweaver1/projects/ perf-events/.