Publisher’s version / Version de l'éditeur:
Journal of Materials in Civil Engineering, 15, July/August 4, pp. 391-399, 2003-07-01
READ THESE TERMS AND CONDITIONS CAREFULLY BEFORE USING THIS WEBSITE.
https://nrc-publications.canada.ca/eng/copyright
Vous avez des questions? Nous pouvons vous aider. Pour communiquer directement avec un auteur, consultez la
première page de la revue dans laquelle son article a été publié afin de trouver ses coordonnées. Si vous n’arrivez pas à les repérer, communiquez avec nous à PublicationsArchive-ArchivesPublications@nrc-cnrc.gc.ca.
Questions? Contact the NRC Publications Archive team at
PublicationsArchive-ArchivesPublications@nrc-cnrc.gc.ca. If you wish to email the authors directly, please see the first page of the publication for their contact information.
Archives des publications du CNRC
This publication could be one of several versions: author’s original, accepted manuscript or the publisher’s version. / La version de cette publication peut être l’une des suivantes : la version prépublication de l’auteur, la version acceptée du manuscrit ou la version de l’éditeur.
For the publisher’s version, please access the DOI link below./ Pour consulter la version de l’éditeur, utilisez le lien DOI ci-dessous.
https://doi.org/10.1061/(ASCE)0899-1561(2003)15:4(391)
Access and use of this website and the material on it are subject to the Terms and Conditions set forth at
Correlation of rheological properties to durability and strength of hardened concrete
Chidiac, S. E.; Maadani, O.; Razaqpur, A. G.; Mailvaganam, N. P.
https://publications-cnrc.canada.ca/fra/droits
L’accès à ce site Web et l’utilisation de son contenu sont assujettis aux conditions présentées dans le site LISEZ CES CONDITIONS ATTENTIVEMENT AVANT D’UTILISER CE SITE WEB.
NRC Publications Record / Notice d'Archives des publications de CNRC:
https://nrc-publications.canada.ca/eng/view/object/?id=a43da737-b5c8-4064-a8d9-d4595ea2aee6 https://publications-cnrc.canada.ca/fra/voir/objet/?id=a43da737-b5c8-4064-a8d9-d4595ea2aee6
Correlation of rheological properties to durability and strength of hardened concrete
Chidiac, S.E.; Maadani, O.; Razaqpur, A.G.; Mailvaganam, N.P.
NRCC-46652
A version of this document is published in / Une version de ce document se trouve dans: Journal of Materials in Civil Engineering, v. 15, no. 4, July/August 2003, pp. 391-399
Correlation of Rheological Properties to the Durability & Strength of Hardened Concrete
By S. E. Chidiac1, O. Maadani2, A. G. Razaqpur3 and N. P. Mailvaganam4
Abstract: Premature deterioration of concrete structures has created an awareness and concern about the durability of concrete. Concrete mixtures used in the construction of residential basement walls and foundations have a high w/c ratio (w/c > 0.6) and low cement content (<280 kg/m3). The result is friable concrete with highly porous surface layer and high potential for cracking. The defects have a direct impact on the durability of concrete.
This experimental study examines the effects of three parameters: mix design, formwork and consolidation, on the quality of the surface of high w/c concrete. The fresh concrete is characterised using its rheological properties, in particular, its yield stress and plastic viscosity. Pulse velocity, pull off strength and compressive strength were measured to evaluate the quality and the mechanical properties of the hardened concrete. The durability of the hardened concrete was evaluated by measuring its surface transport properties, namely its air permeability and
1
Associate Professor, Department of Civil Engineering, McMaster University, Hamilton, Canada L8S 4L7
2
Technical Research Officer, Institute for Research in Construction, National Research Council Canada, Ottawa, Canada K1A 0R6
3
Professor, Department of Civil & Environmental Engineering, Carleton University, Ottawa, Canada K1S 5B6
4
Principal Research Officer, Institute for Research in Construction, National Research Council Canada, Ottawa, Canada K1A 0R6
sorptivity. The results show that it is possible to correlate the rheological properties of fresh concrete to the mechanical and permeation properties of the hardened concrete.
Key Words: Concrete; Durability; Rheological properties; Sorption; Permeability; Vibration; Formwork; Admixtures; Experimental.
INTRODUCTION
Concrete mixtures used in the construction of residential basement walls and foundations possess a high water to cement ratio (w/c) ranging from 0.65 to 0.9, and consistencies ranging from a 175 ± 25 mm slump to fluid condition. The resultant concrete manifests a host of defects, a high potential for cracking and a friable, highly porous surface layer. These defects are known to have a direct impact on the durability of concrete because they reduce its effectiveness as a barrier against the ingress of water and other deleterious agents (Orchard 1973). Concrete processing and placement methods, such as consolidation and curing, influence the quality of concrete, particularly, the integrity of the concrete surface (Dhir et al. 1987; Maadani 1998). Several factors such as cement type and content, water content, admixtures, aggregate type and ratio, type of mould lining material (i.e. rigidity and impermeability), release agents, and type of vibratory equipment and intensity of vibration, and interaction of vibration with mould (i.e. reflection or absorption) are believed to have influence on the finish concrete surface and its integrity.
In this study, the effects of some of the foregoing parameters on the quality of concrete cover of high w/c concrete were investigated experimentally. In particular, the interplay of three parameters, mix design, formwork, and placement conditions (vibration) on the quality of the surface of high w/c concrete were investigated in some detail. For the mix design, the following variables were considered; w/c, water content, cement content, sand to coarse aggregate ratio (S/A), air content and chemical admixtures. The effects of the formwork surface condition on the quality of the concrete cover were evaluated. Two types of formwork were considered, standard plywood form and plywood lined with a coating of 100% solid urethane. Two
placement conditions were considered, no vibration and vibration using a 32 mm diameter poker vibrator.
The mix design was evaluated both in the plastic and hardened states. The fresh concrete was characterised using its rheological properties, in particular its yield stress and plastic viscosity. Destructive and non-destructive test methods were employed to measure the mechanical properties and transport properties of the hardened concrete. Pulse velocity, pull off strength and compressive strength were measured to evaluate the quality and the mechanical properties of the hardened concrete. The durability of the hardened concrete was evaluated by measuring its surface transport properties, namely its air permeability and sorptivity. The rheological properties of fresh concrete are correlated to the mechanical and permeation properties of hardened concrete.
EXPERIMENTAL PROGRAM Materials and Samples
Mix proportions were designed to yield on average 20 MPa for a 28-day compressive strength and a 175 ± 25 mm slump, corresponding to the average properties of basement concrete mixes. Table 1 provides the mix proportions and the admixture types used. Type I cement, a crushed limestone coarse aggregate with maximum size of 25 mm and a silica sand fine aggregate with maximum size of 4.75 mm (fineness modulus of 2.60) was used throughout the experimental work. A lignosulfonate water reducing admixture (WRA) and synthetic detergent air entraining agent (AEA) were used alone or in combination in some of the mixes. The specimens were cast and cured under controlled room temperature at 20o C and at a relative humidity of 50 %. A
total of eight specimens (detailed below) and three 150 by 300 mm standard cylinders were cast from each batch.
Specimens were cast in two geometrical shapes, rectangular and L-shaped corner. The rectangular shaped formwork is 400 mm long by 200 mm thick by 400 mm high, and the corner shape one has equal length sides of 500 mm with a thickness of 200 mm and a height of 300 mm. Four specimens were cast in formworks constructed of plywood and four in formwork constructed of plywood lined with a coating of 100% solid urethane for every mix. Of the eight-specimen cast, four were vibrated using a 32 mm diameter poker vibrator with a central frequency of 226 Hz and a peak acceleration of 1.1g.
Slump & Slump Flow
The flow properties for Mixes 1 to 8 reported in Table 2 are measured in accordance with BS 1881 (1984). Although the target minimum slump was 175 ± 25 mm, the measured slump values ranged from 165 mm to 250 mm. For mixes with slump values originally much greater than 175 mm, the mix was adjusted by increasing the ratio of fine to the total aggregate. The mixes used to cast the specimens are given in Table 1. The slump-flow values represent the average of the final horizontal spread of fresh concrete in two perpendicular directions after the removal of the slump cone; slump-flow and flow values provide a measure of concrete workability. The results are the average of two repetitions, where the maximum difference of 4 % was observed in the measured values. Densities of the fresh concrete are also given in Table 2.
The results in Table 2 show a similar trend (state trend) for both the slump-flow and flow values as the mix design was modified. They clearly show that an increase in w/c ratio results in an increase in the measured slump and slump-flow values. Results for Mixes 4, 5 and 7 show that the addition of either WRA or AEA resulted in an increase in both the slump and slump-flow values. The increase in the ratio of fine to total aggregates, (compare Mixes 5 and 6) largely affected the slump value, with relatively smaller increase in the measured slump-flow. However, for the mixes with 0.83 w/c, the increase in S/A has little effect on the measured slump or the slump flow values.
Closer examination of the slump values revealed that an increase of 3% in the ratio of fine to the total aggregate for mixture with w/c= 0.65 resulted in an 18% reduction in the slump, in contrast to a 4 % decrease only in the slump value of the mixture with w/c = 0.83 when its ratio of fine to total aggregate was increased by 8%. Further, the reduction of w/c ratio from 0.83 to 0.65 resulted in a 75 mm decrease in the slump value. The slump values measured for Mix 5 and 6 indicate that a mixture becomes more sensitive to changes in the ratio of fine to total aggregate as the w/c is reduced. However, the workability is enhanced through the use of water reducing admixture. The same observation can be made for the air-entraining agent by examining Mix 4, 7 and 8.
Air Content & Bleeding
The air content of the concrete mixes and the amount of bleeding were measured for the different mixes and the results are given in Table 2. The air content test and the bleeding test were performed according to ASTM C 231 (1991) and C 232 (1992), respectively. As expected, Mix
1 had the highest amount of bleeding, with approximately 15 mm of free water accumulating on the top surface of the concrete specimens, especially those specimens cast in lined moulds. The amount of bleeding decreased when the sand to the total aggregate ratio was increased from 0.52 to 0.6, Mix 2. The change in the mix design resulted in 8.3 percent less bleeding in Mix 2 compared to Mix 1. For a 0.65 w/c, Mix 4, approximately 5 mm free water was measured on the surface of concrete specimens. However, when Mix 5 was vibrated, the amount of free water increased. Consequently, the mix was modified by increasing the amount of sand to the total aggregate ratio from 0.49 to 0.52 to produce Mix 6. The modification showed slight improvement over Mix 5, with about 2 mm free water. A comparison between the measured slump values and the bleeding shown in Figure 1 indicates that the percent bleeding in general increases as the slump value increases due to the addition of water, and that the increase of slump value due to the addition of admixture has resulted in either a minimal decrease, or no change in the amount of free water measured at the top surface. Further, increasing the ratio of fine to total aggregates has minimal impact on the bleeding. From Figure 1, it can be observed that the amount of bleeding increases as the amount of air decreases.
Mixes 1, 2 and 4 are considered as non-air entrained concrete, and they contain less than the recommended total air content of concrete (ACI 211 1991) for the specified level of exposure and for the maximum size of aggregate (20 mm) used. Mixes 5, 6, 7, and 8 are considered as air-entrained concrete. Mixes 5 and 6 are suitable for moderate level of exposure while Mixes 7 and 8 are suitable for severe level of exposure.
Rheology of Concrete Mixtures
The rheological properties of the mix were evaluated from the measured flow properties of the fresh concrete. By using a mathematical model derived from the premise that fresh concrete flow follows Bingham material model and that flow initiates when the second invariant of the deviatoric stress exceeds the yield limit, the shear stress and plastic viscosity are evaluated (Chidiac et al. 2000). Following the Bingham material model, yield stress is the critical shear stress value above which the material flows like a viscous liquid, and the plastic viscosity is a material property that provides a measure of the resistance to changes in the shape or arrangements of its constituents. Accordingly, the yield stress is computed as a function of the density, ρ, and the slump-flow, S , of the fresh concrete, f
2 f 2 f y S S 3 V 4 ρ =β ρ π = τ g (1)
where g and V are the gravitational constant and volume of the slump cone, respectively.
Plastic viscosity of fresh concrete is important for predicting consistency in high fluidity concrete. A relationship for the plastic viscosity was derived from the yield stress, slump value,
, and total slump time,
l S tslump, slump l y slump 2 f l t S t S S 150 V H =χτ π ρ = η g (2)
where H is the height of the slump cone. The slump time corresponds to the total time taken for the fresh concrete to reach its final slump. Measured flow properties and computed rheological properties are given in Table 3.
Pulse Velocity
Concrete pulse velocity is often used to assess the quality of concrete through the detection of flaws and damage. The tests were conducted in accordance with ASTM C 597 (1983) and the ultra-sound device, “Pundit”, was used to assess the effects of the formwork and placement methods on the quality of the different hardened concrete mixes. The sensors were located at mid-length and mid-height of the specimen, corresponding to the location where cores were extracted. The orientation of the sensors was normal to the direction of casting.
The average pulse velocity results of two repetitions, summarized in Table 4, show that the concrete with 0.65 w/c ratio cast in lined form and vibrated had the highest pulse velocity. Vibration has beneficial effect even for mixes with high w/c ratio since the vibrated concrete has generally higher pulse velocity in comparison to the un-vibrated one. Furthermore, with the exception of Mix 7, the specimens vibrated in lined forms had relatively higher pulse velocity than the specimens vibrated in wood forms (Fig. 2). It is recognised that the preceding observations are not definitive conclusions because they are based on the comparison of the average pulse velocity of the various specimens. In fact, the recorded standard deviation values in Table 4 could alter some of these conclusions. Further work is needed to definitively establish a relationship between some of the present test parameters and the pulse velocity of the specimens.
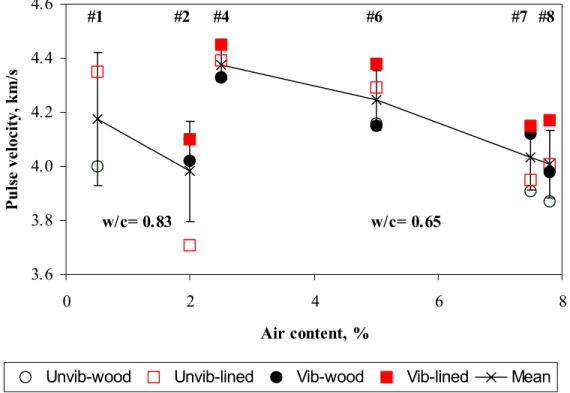
Plot of recorded average pulse velocities versus concrete density is shown in Figure 2. It can be observed that in general the denser mixes have higher pulse velocity. Further, the effect of the
concrete air content on the pulse velocity is noticeable in Figure 3 where mixes with higher air content have lower density and lower measured pulse velocity.
The results of Figures 2 and 3 show that mixes with high w/c that were vibrated have higher pulse velocity. The magnitude of the pulse velocity quantitatively confirms the empirical knowledge that the use of vibration reduces voids and air pockets and improves the compactness of concrete.
Cylinder Compressive Strength
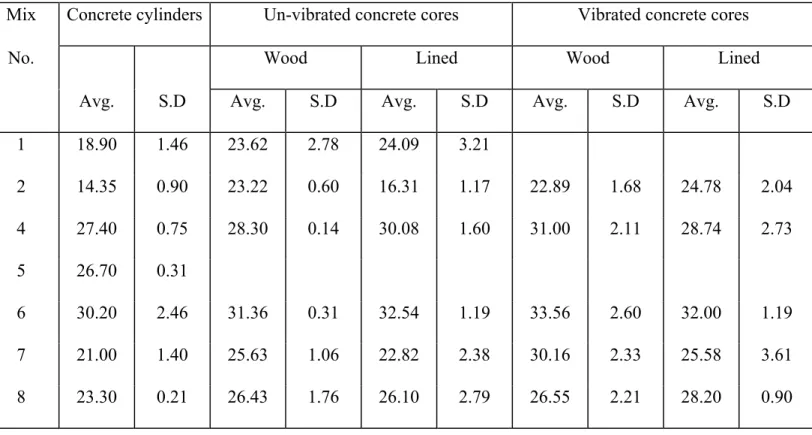
Three 150 x 300 mm standard cylinders were cast for each concrete mix, and were cured for 28 days according to ASTM C 39 (1996). Prior to testing, the cylinders were capped with a sulphur compound and the test procedure was conducted according to ASTM C 39 (1996). The 28-day compressive strength including the standard deviation obtained from the 150 x 300 mm standard cylinders of each mix are given in Table 5. Although the design 28-day compressive strength was 20 MPa, the measured values ranged from 14 MPa to 30 MPa. With the exception of mixes 1 and 2, which had the w/c ratio of 0.83, the other mixes reached their design compressive strength.
As expected, mixes with lower w/c have higher compressive strength. The addition of air entraining agent resulted in a reduction in the cylinder compressive strength while the addition of WRA has very little effects on the strength. Mixes with higher air volume had generally a lower compressive strength.
Core Compressive Strength
Several cores normal to the direction of casting were extracted from the hardened concrete specimens in order to evaluate the effect of the form lining material on the properties of the hardened mix. The cores were located at mid-height and mid-length of the specimen. The 28 days average compressive strength and the corresponding standard deviation obtained by testing three specimens of each mix are given in Table 5. The results are found to be consistent with the maximum standard deviation of 3.61 MPa noted for Mix 7. To visualize the various effects, the average compressive strength is shown in Figures 4 and 5.
Ratio of core strength to the standard cylinder strength of the same age is found greater than one. The difference is attributed to the orientation of the cored specimens and the size of the cylinder. The cores avoid the areas of bleeding channels, a phenomenon known to affect the standard cylinder strength. During the preparation of the cylinder, bleeding water was observed at the surface of the specimens. Results of Figure 4 show that the difference between the core strength and cylinder strength decreases as the strength increases. Additionally, the core were 100 ×200 mm cylinders while the test cylinders for compressive strength were 150 300 mm. However, the difference in samples size is expected to yield a difference of no more than 5%.
×
The results of Figure 5 confirm that generally mixes with low water content have higher strength values. The addition of air entraining agent decreases the strength. These observations are consistent with those made about the cylinder compressive strength. The vibrated concrete cast in wood form had on the average slightly higher compressive strength.
Pull off Test
Pull off test, which provides measurements of the concrete cover tensile strength, is carried out to evaluate the quality of the finished concrete surface. Pull-off tests were performed on the rectangular shape forms of the present mixes in accordance with BS 1881 (1992). Three repetitions were carried out for each mix. The average pull-off strength and standard deviation corresponding to each mix are given in Table 6. The same results are graphically represented in Figure 6.
For mixes with water content = 229 kg, one can observe that specimens cast in wood form have slightly higher pull-off strength than those cast in lined form, provided the mixture was not vibrated. For vibrated mixes with water content = 229 kg, specimens cast in lined form produced somewhat higher values. When comparing the recorded results for mixes with water content = 229 kg to mixes with water content = 179 kg, the vibrated mixes had higher pull-off strength values. The addition of water reducer admixture and air entraining agent to the mixture enhanced the strength, most notably for those specimen cast in the wood form. These observations show that non-absorbing water surface such as the urethane lined-wood form can have negative effects on the quality of the surface for concrete made with high water content.
Surface Air Tightness
Mass transport properties of concrete are a measure of its potential durability. This observation is based on the fact that the penetration of air/water or deleterious chemical is controlled by the mass transport properties of concrete cover. In this study, the focus was on assessing the properties of the cover, namely the air tightness and sorptivity.
Surface air tests were conducted on the test specimens according to the SCHUPACK Tester Procedure (SCONTEC 1993). The surface air tightness was measured in two orthogonal directions, which will be referred to as the face and the side, respectively. The results of 18 tests, i.e. mean and standard deviation, for each mix are given in Table 7 and illustrated graphically in Figure 7. The results reveal a trend between the surface air tightness and the form surface finish in practically all cases. It can be seen that in many cases the lowest air leakage is exhibited by the specimens that were cast in lined forms. On the other hand, no trend can be established for the effect of vibration on the air tightness of the concrete surface. The un-vibrated concrete with water content = 229 kg had relatively higher air leakage than the un-vibrated concrete with water content of 179 kg.
The results in Figure 7 indicate that water content has significant influence on air permeability; higher water content produces greater air leakage. This conclusion is consistent with observations by others (Neville 1981; Dhir et al. 1987, 1989; Figg 1989; Long et al. 1995). The present test results also revealed that the side of the specimens had in general higher air leakage than the face, perhaps due to restrictions imposed by the corner effect. As for the effect of form
finish and vibration, the specimens cast in lined forms showed relatively better surface air tightness than those cast in wood forms.
Sorptivity
Sorptivity is a property associated with capillary effects and is defined as the gradient of volume of water absorbed per unit area of section surface and the square root of the absorption time. The testing method and procedure for measuring sorptivity are given by Chidiac et al. (1997) and Hall (1989). The recorded water sorptivity values given in Table 8 show concrete with w/c ratio of 0.83 has an average sorptivity value greater than 0.8 mm/h½ while mixes with w/c ratio of 0.65 have on average values less than 0.4 mm/h½. This is a clear indication of why high w/c ratio and particularly high water content has a detrimental effect on the durability of the concrete.
Comparison between the results of specimens cast in the two types of formwork reveals that concrete cast in wood has lower sorptivity values for all mixes. Consolidation is found to reduce the sorptivity value for mixes with w/c = 0.83 and to increase the sorptivity value for mixes with a w/c = 0.65. Exception is found for mix 8 where consolidation of the mix has resulted in a lower value for sorptivity.
COMPARATIVE EVALUATION BETWEEN RHEOLOGY OF FRESH CONCRETE AND PROPERTIES OF HARDENED CONCRETE
Research (Tattersall 1991, Banfill 1993, Hu et al. 1996, Chidiac et al. 2000) has found that rheological properties; namely, yield stress and plastic viscosity can be used to characterise the
flow properties of fresh concrete in a quantifiable manner. Given the fact that no standard test methods are available for measuring the rheological properties of fresh concrete, the rheological properties defined in Chidiac et al. (2000) could be used for the comparative evaluation. The objective of this evaluation is to determine whether relationships exist between the rheological properties and the properties of hardened concrete made with high w/c ratio.
Surface air tightness
Figures 8 and 9 show the variation of air permeability with plastic viscosity and yield, respectively. It would appear from Figure 8 that irrespective of the type of formwork and consolidation conditions, the surface air leakage for the concrete cover decreases first then increases slightly with increased values for plastic viscosity. The range between 20 and 60 Pa.s produces the lowest values of air leakage. A similar observation can be made from Figure 9 for the yield, where an improved air leakage value occurs between 900 and 1100 Pa. This observation follows the general trend where concrete with low viscosity and yield stress results in porous concrete while that with high viscosity and yield stress contains air cavities.
Sorptivity
Plots of water sorptivity versus the plastic viscosity and yield values are shown in Figures 10 and 11, respectively. The results show a clear difference in response between mixes with 0.83 and 0.65 w/c. The rheological values that do not fit the trend correspond to mixes whose total aggregate content are different from the majority of the mixes. In general, it is observed that sorptivity decreases as the plastic viscosity and yield stress increase, irrespective of the formwork and vibration. Close examination reveals that sorptivity increases slowly when plastic
viscosity exceeds 60 Pa.s. Similar trends can be noted in Figure 11 for a yield value greater than 1100 Pa. Further testing is obviously needed to verify the current observation for various concrete mixes. However, the results indicate that it is possible to have un-vibrated concrete with relatively low sorptivity provided its plastic viscosity is maintained in the range of 20 to 60 Pa.s and its yield stress in the range of 900 to 1100 Pa. The proposition of controlling the quality of hardened concrete through rheological properties of fresh concrete has potential.
Core strength
Figures 12 and 13 show the core compressive strength increases as the values for plastic viscosity and yield stress increase. Closer examination of the two plots reveals that the relation between the plastic viscosity and the core compressive strength is similar to that between the yield value and the core strength. The trend is very similar (inversely) to the one observed for the mass transport properties. This further illustrates the relationship between the rheological properties and the hardened concrete properties. Again, mixes whose plastic viscosity is 60 Pa.s, corresponding to yield stress value of 1100 Pa, possess the largest core strength. Mixes with rheological properties either greater or smaller than the above noted ones yielded lower core strength values. This trend is similar to that noted for the transport properties.
Pull off strength
The pull-off strength is an indication of the tensile strength of the concrete surface. The plotted values of pull-off strength versus the plastic viscosity and the yield values are shown in Figures 14 and 15, respectively. From the results it can be stated that on the average the pull off strength has the highest value when the plastic viscosity is between 20 and 60 Pa.s and the yield is
between 900 and 1100 Pa. Although the pull-off strength of the concrete is more affected by factors such as curing condition, form type and level of vibration, nevertheless the effects of the rheological properties can also be marginally noted.
Pulse velocity
The measured pulse velocity across concrete is a function of its elastic properties and density. As illustrated in Figures 16 and 17, the pulse velocity that provides a measure of the quality of the concrete, can be related to the rheological properties. Pulse velocity increase is an indicator of better quality control as the values of both yield stress and plastic viscosity increase. Although the intent is not to derive a relationship between the rheological properties and the pulse velocity; nevertheless the results demonstrate that the rheological properties can be used as a quality control measure for the hardened concrete.
CONCLUSIONS
Based on the results of the current experimental study, it can be concluded that the flow behaviour of concrete mixes with high w/c typically used in the construction of residential basements and walls can be characterised by their rheological properties. These results have shown that:
a) Plastic viscosity and yield value increase with decreasing w/c ratio; b) Plastic viscosity and yield value increase with increasing S/A ratio;
c) Plastic viscosity and yield value decrease with the addition of WRA and AEA; d) Plastic viscosity and yield value increase with decreasing cement content; e) Plastic viscosity and yield value decrease with increasing air volume.
From the results of the comparative evaluation between rheology of fresh concrete and properties of hardened concrete, the following conclusions can be drawn:
1. Mixes with low yield value (less than 500 Pa) tend to promote bleeding. Further, mixes whose plastic viscosity ranges from 20 to 70 Pa.s, which correspond to yield values of 800 to 1600 Pa, are found to cause little bleeding and are not dry mixes.
2. Specimens that were vibrated in lined forms were found to exhibit the tightest air surface. 3. Surface air leakage and water sorptivity increase with increasing water content.
4. Specimens cast in wood form have the lowest water sorptivity irrespective of vibration effect.
5. Vibration decreases the water sorptivity irrespective of the type of forming materials.
6. Plastic viscosity and yield stress vary inversely with the water sorptivity, provided their respective values are less than 60 Pa. s and 1100 Pa.
7. Core strength is found to increase with increasing yield value and plastic viscosity up to a plastic viscosity and yield value of 60 Pa s and 1100 Pa, respectively.
8. Increase in plastic viscosity and yield value is found to correspond to an increase in the measured pulse velocity of hardened concrete. Concrete specimens vibrated in lined forms had the highest pulse velocity.
From the present investigation, it can be concluded that high water content concrete mixes with a plastic viscosity value of 60 Pa. s and a yield stress value of 1100 Pa, possess on average
i. the least amount of bleeding, ii. the lowest air leakage,
iii. the lowest water sorptivity, iv. the highest pull off strength, and
v. the largest compressive strength.
These results show that it is possible to correlate the rheological properties of fresh concrete to the mechanical and permeation properties of the hardened concrete.
ACKNOWLEDGEMENTS
The financial support of Canada Mortgage & Housing Corporation is gratefully acknowledged. The authors are equally grateful to Mr. G. Chan of IRC/NRCC for assisting in the mixing and cast of fresh concrete, Mr. T. Hoogeveen of IRC/NRCC for assisting in the construction of the forms and the slump rate machine, and Mr. D. Guenter of IRC/NRCC for coring the specimen.
REFERENCES
ACI Committee 211. (1991). “Standard Practice for selecting proportions for normal, heavy weight and mass concrete.” American Concrete Institute, Farmington Hills, Mich.
ASTM C 597-83. (1983). ”Standard test method for pulse velocity through concrete.” Annual Book of ASTM Standards, ASTM, West Conshohocken, Pa.
ASTM C 231-91. (1991). ”Standard test method for air content of freshly mixed concrete by the pressure method.” Annual Book of ASTM Standards, ASTM, West Conshohocken, Pa. ASTM C 232-92. (1992). ”Standard test method for bleeding of concrete.” Annual Book of
ASTM Standards, ASTM, West Conshohocken, Pa.
ASTM C 39-96. (1996). ”Standard test method for compressive strength of cylindrical concrete specimens.” Annual Book of ASTM Standards, ASTM, West Conshohocken, Pa.
Banfill, P.F.G. (1993). “Structure and rheology of cement based systems.” Proc. Materials Research Society Symposia, 289, 149-160.
BS 1881. (1984). ”Method for determination of flow.” British Standards Institute, Part 105, London.
BS 1881. (1992). ”Recommendations for the assessment of concrete strength by near the surface tests.” British Standards Institute, Part 207, London.
Chidiac, S.E., Grattan-Bellew, P.E., Hoogeveen, T.J., and Razaqpur, A.G. (1997). “Effects of stress induced damages on the permeation properties of concrete.” Proc., Int’l Conf. on Engineering Materials, CSCE/JSCE, Ottawa, 283-292.
Chidiac, S.E., Maadani, O., Razaqpur, A.G. and Mailvaganam, N.P. (2000). “Controlling the quality of fresh concrete-a new approach." Magazine of Concrete Research, 52(5), 353-363.
Dhir, R.K., Hewlett, P.C. and Chan, Y.N. (1987). “Near surface characteristics of concrete: assessment and development of in situ test methods.” Magazine of Concrete Research, 39(141), 183-195.
Dhir, R.K., Hewlett, P.C. and Chan, Y.N. (1989). ”Near surface characteristics of concrete: Intrinsic permeability.” Magazine of Concrete Research, 41(147), 87-97.
Figg, J. (1989). ”Concrete Surface permeability: measurement and meaning”. Chemistry and Industry, 714-719.
Hall, C. (1989) “Water sorptivity of mortars and concretes: a review,” Magazine of Concrete Research, 41(147), 51-61.
Hu, C., Larrard, F., Sedran, T., Boulay, C., Bosc, F., and Deflorenne, F. (1996). “Validation of BTRHEOM, the new rheometer for soft to fluid concrete”. Materials and Structures, 29, 620-631.
Long, A.E., Shaat, A.A. and Basheer, P.A.M. (1995). “The influence of controlled permeability form work on the durability and transport properties of near surface concrete.” Advances in concrete technology, Proc., 2nd CANMET/ACI Int’l Symp., ACI, Detroit, 41-54.
Maadani, O.R. (1998). “Rheology – Covercrete: A concept for controlling quality and durability of concrete.” Master of Engineering thesis, Department of Civil & Environmental Engineering, Carleton University, Ottawa, Canada.
Neville, A.M. (1981). Properties of concrete, 3rd ed., Longman Scientific & Technical, England. Orchard, D.F. (1973). Concrete Technology, V. 2, 3rd ed., John Wiley & Sons, New York. SCONTEC (1993). SCHUPACK concrete tightness tester – Instruction manual, Norwalk CT. Tattersall, G.H. (1991). Workability and quality control of concrete, E & FN Spon, London.
Table 1: Mix designs used in the current investigation
Mix Cement w/c Water content Coarse agg. S/A WRA AEA No. (kg/m3) (kg/m3) (kg/m3) (%) (ml/m3) (ml/m3) 1 275 0.83 228 947 0.52 2 275 0.83 228 750 0.60 3 286 0.65 186 976 0.49 4 275 0.65 179 980 0.49 5 275 0.65 179 980 0.49 687.5 6 275 0.65 179 923 0.52 687.5 7 275 0.65 179 980 0.49 137.5 8 275 0.65 179 923 0.52 687.5 55.0
Table 2: Properties of fresh concrete for mixes used in the study
Mix Density Slump Slump-flow Flow test Air content Bleeding No. (kg/m3) (mm) (mm) (mm) (%) (%) 1 2333 250 488 710 0.5 21.1 2 2338 240 475 665 2.0 12.8 3 2376 170 270 573 4 2377 165 245 510 2.5 5.3 5 2318 205 315 575 4.2 5.5 6 2292 168 293 540 5.0 4.2 7 2257 195 292 533 7.5 1.8 8 2224 200 318 594 7.8 2.0
Table 3: Rheological properties of fresh concrete for mixes used in this investigation
Mix Slump time Slump Slump-flow Yield stress Plastic viscosity
No. (s) (mm) (mm) (Pa) (Pa.s)
1 4.0 250 488 388 5 2 7.5 240 475 411 7 3 10.3 170 270 1292 60 4 10.0 165 245 1570 68 5 8.9 205 315 926 26 6 11.1 168 293 1058 59 7 7.5 195 292 1049 32 8 6.5 200 318 872 21
Table 4: Pulse velocity of the hardened concrete Mix No. Statistical Pulse velocity (km/s)
analysis Un-vibrated Vibrated Wood Lined Wood Lined
1 Avg. 4.00 4.35 S.D 0.06 0.03 2 Avg. 4.10 3.71 4.02 4.10 S.D 0.02 0.03 0.07 0.03 4 Avg. 4.33 4.39 4.33 4.45 S.D 0.06 0.06 0.07 0.06 6 Avg. 4.16 4.29 4.15 4.38 S.D 0.07 0.06 0.05 0.07 7 Avg. 3.91 3.95 4.12 4.15 S.D 0.05 0.09 0.03 0.11 8 Avg. 3.87 4.01 3.98 4.17 S.D 0.01 0.03 0.17 0.10
Table 5: Compressive strength of concrete cylinders and cores (MPa)
Mix Concrete cylinders Un-vibrated concrete cores Vibrated concrete cores
No. Wood Lined Wood Lined
Avg. S.D Avg. S.D Avg. S.D Avg. S.D Avg. S.D 1 18.90 1.46 23.62 2.78 24.09 3.21 2 14.35 0.90 23.22 0.60 16.31 1.17 22.89 1.68 24.78 2.04 4 27.40 0.75 28.30 0.14 30.08 1.60 31.00 2.11 28.74 2.73 5 26.70 0.31 6 30.20 2.46 31.36 0.31 32.54 1.19 33.56 2.60 32.00 1.19 7 21.00 1.40 25.63 1.06 22.82 2.38 30.16 2.33 25.58 3.61 8 23.30 0.21 26.43 1.76 26.10 2.79 26.55 2.21 28.20 0.90
Table 6: Pull off strength of hardened concrete Mix Statistica
l
Pull off strength (MPa)
No. analysis Un-vibrated Vibrated Wood Lined Wood Lined
1 Avg. 3.06 2.86 S.D 0.31 0.42 2 Avg. 2.91 2.23 2.23 2.63 S.D 0.16 0.16 0.76 0.08 4 Avg. 1.80 2.66 2.00 2.66 S.D 0.17 0.27 0.10 0.90 6 Avg. 2.77 2.81 2.64 2.98 S.D 0.80 0.12 0.72 0.40 7 Avg. 3.95 2.63 3.26 2.83 S.D 0.54 0.12 0.43 0.25 8 Avg. 2.61 2.64 3.60 2.75 S.D 0.47 0.19 0.32 0.47
Table 7: Surface air tightness of hardened concrete Mix No. Face or
side
Statistical
analysis Air tightness
kPa s
Un-vibrated Vibrated Wood Lined Wood Lined
1 F Avg. 1.23 1.25 S.D 0.22 0.24 S Avg. 1.16 1.15 S.D 0.27 0.18 2 F Avg. 1.10 1.30 1.11 1.00 S.D 0.20 0.17 0.33 0.26 S Avg. 1.16 1.41 1.13 1.00 S.D 0.26 0.00 0.27 0.22 4 F Avg. 1.02 0.71 1.16 0.92 S.D 0.31 0.45 0.37 0.31 S Avg. 1.31 0.96 1.25 1.04 S.D 0.07 0.36 0.16 0.38 6 F Avg. 0.94 0.45 1.02 0.49 S.D 0.24 0.29 0.30 0.36 S Avg. 1.01 0.37 0.93 0.60 S.D 0.22 0.29 0.22 0.39 7 F Avg. 0.58 0.54 0.75 0.49 S.D 0.16 0.21 0.35 0.34 S Avg. 0.84 0.51 0.88 0.79 S.D 0.33 0.15 0.23 0.42 8 F Avg. 1.14 0.41 0.76 0.53 S.D 0.34 0.22 0.17 0.24 S Avg. 0.82 0.49 1.12 0.86 S.D 0.23 0.11 0.30 0.41
Table 8: Sorptivity of hardened concrete
Mix Vib. Form Sorptivity Percent difference (%)
No. (mm/h1/2) Wood/ Un-vib./
Lined Vib. 1 N Wood 0.73 -14 Lined 0.85 2 N Wood 0.96 -32 14 Lined 1.42 63 Y Wood 0.84 -3 Lined 0.87 4 N Wood 0.30 -40 -3 Lined 0.50 6 Y Wood 0.31 -34 Lined 0.47 6 N Wood 0.22 -31 -39 Lined 0.32 -18 Y Wood 0.36 -8 Lined 0.39 7 N Wood 0.25 -11 -11 Lined 0.28 -22 Y Wood 0.28 -22 Lined 0.36 8 N Wood 0.41 -7 37 Lined 0.44 10 Y Wood 0.30 -25 Lined 0.40
List of Figure Captions ** All 17 figures are to be reduced to fit 2.5 x 3.5 in.
Figure 1: Relationship between bleeding, slump value and air content for the test mixes. Figure 2: Influence of density on pulse velocity.
Figure 3: Influence of air content on pulse velocity.
Figure 4: Relationship between core strength and cylinder strength. Figure 5: Relationship between core strength and water content. Figure 6: Relationship between pull off strength and water content. Figure 7: Relationship between surface air tightness and water content. Figure 8: Surface air tightness versus plastic viscosity.
Figure 9: Surface air tightness versus yield stress. Figure 10: Water sorptivity versus plastic viscosity. Figure 11: Water sorptivity versus yield stress. Figure 12: Core strength versus plastic viscosity. Figure 13: Core strength versus yield stress.
Figure 14: Pull off strength versus plastic viscosity. Figure 15: Pull off strength versus yield stress. Figure 16: Pulse velocity versus plastic viscosity. Figure 17: Pulse velocity versus yield stress.
150 175 200 225 250 275 0 5 10 15 20 25 Bleeding, % Slump, mm 0 2 4 6 8 Air content, % #6 #7 #8 #5 #2 #1 #1 #2 #6 #8 #7 Air content Slump #4 #5 #4
Figure 1: Relationship between bleeding, slump values and air content for the test mixes.
#6 #1#2 #4 w/c= 0.83 3.6 3.9 4.1 4.4 4.6 2200 2250 2300 2350 2400 Density, kg/m^3 Pulse velocity, km/s
Unvib-wood Unvib-lined Vib-wood Vib-lined Mean
#8 #7
w/c= 0.65
3.6 3.8 4.0 4.2 4.4 4.6 0 2 4 6 8 Air content, % Pulse velocity, km/s
Unvib-wood Unvib-lined Vib-wood Vib-lined Mean
#8 #7 #6
#1 #2 #4
w/c= 0.83 w/c= 0.65
Figure 3: Influence of air content on pulse velocity.
10 15 20 25 30 35 40 10 15 20 25 30 35 40
Cylinder compressive strength, MPa
Core compressive strength, MPa
Unvib-wood Unvib-lined Vib-wood Vib-lined Mean
15 20 25 30 35 170 180 190 200 210 220 230 240 Water content, kg/m^3
Core compressive strength, MPa
Unvib-wood Unvib-lined
Vib-wood Vib-lined
Mean-wood Mean-lined
Figure 5: Relationship between core strength and water content.
1. 5 2. 0 2. 5 3. 0 3. 5 4. 0 170 180 190 200 210 220 230 240 Water content, kg/m^3
Pull off strength, MPa
Unvib-wood Unvib-lined
Vib-wood Vib-lined
Mean-wood Mean-lined
0. 25 0. 50 0. 75 1. 00 1. 25 1. 50 170 180 190 200 210 220 230 240 Water content, kg/m^3
Pressure decay, kPa/s Unvib-wood Unvib-lined
Vib-wood Vib-lined
Mean-wood Mean-lined
Figure 7: Relationship between surface air tightness and water content
0.0 0.5 1.0 1.5 2.0 0 10 20 30 40 50 60 7
Plastic viscosity, Pa.s
Pres su re d ecay, k P a/s 0 Unvib-wood Unvib-lined Vib-wood Vib-lined Mean #1 #2 #8 #7 #6 #4
0.0 0.5 1.0 1.5 2.0 250 500 750 1000 1250 1500 1750 Yield stress, Pa Pres su re d ecay, k P a/s Unvib-wood Unvib-lined Vib-wood Vib-lined Mean #1 #2 #8 #7 #6 #4
Figure 9: Surface air tightness versus yield stress.
0.0 0.5 1.0 1.5 0 10 20 3 Plastic Sorptivity, mm/h^0.5 0 40 50 60 70 viscosity, Pa.s nvib-wood Unvib-lined ib-wood Vib-lined ean #7 #6 #4 U V M #1 #2 #8
0.0 0.5 1.0 1.5 250 500 750 1000 1250 1500 1750 Yield, Pa Sorptivity, mm/h^0.5 Unvib-wood Unvib-lined Vib-wood Vib-lined Mean #1 #2 #8 #7#6 #4
Figure 11: Water sorptivity versus yield stress.
10 20 30 40 0 10 20 Plastic
Core strength, MPa
30 40 50 60 70 viscocity, Pa.s nvib-wood Unvib-lined b-wood Vib-lined ean #7 #6 #4 U Vi M #1 #2 #8
10 20 30 40 250 500 750 1000 1250 1500 1750 Yield, Pa
Core strength, MPa
Unvib-wood Unvib-lined
Vib-wood Vib-lined
Mean
#1#2 #8 #7 #6 #4
Figure 13: Core strength versus yield stress.
0 1 2 3 4 5 0 10 20 30 40 50 60 7
Plastic viscosity, Pa.s
Pull off strength, MPa
0
Unvib-wood Unvib-lined
Vib-wood Vib-lined
Mean
#1#2 #8 #7 #6 #4
0 1 2 3 4 5 250 500 750 1000 1250 1500 1750 Yield, Pa
Pull off strength, MPa Unvib-wood Unvib-lined
Vib-wood Vib-lined
Mean
#1#2 #8 #7 #6 #4
Figure 15. Pull off strength versus yield stress.
3.50 3.75 4.00 4.25 4.50 0 10 20 30 40 50 60 7
Plastic viscocity, Pa.s
Pulse velocity, km/s 0 Unvib-wood Unvib-lined Vib-wood Vib-lined Mean #1 #2 #8 #7 #6 #4
3.50 3.75 4.00 4.25 4.50 250 500 750 1000 1250 1500 1750 Yield, Pa
Pulse velocity, km/s Unvib-wood Unvib-lined
Vib-wood Vib-lined
Mean
#1 #2 #8 #7 #6 #4