HAL Id: hal-00090850
https://hal.archives-ouvertes.fr/hal-00090850v2
Submitted on 14 Aug 2008
HAL is a multi-disciplinary open access
archive for the deposit and dissemination of
sci-entific research documents, whether they are
pub-lished or not. The documents may come from
teaching and research institutions in France or
abroad, or from public or private research centers.
L’archive ouverte pluridisciplinaire HAL, est
destinée au dépôt et à la diffusion de documents
scientifiques de niveau recherche, publiés ou non,
émanant des établissements d’enseignement et de
recherche français ou étrangers, des laboratoires
publics ou privés.
doped spin-Peierls CuGeO3
Virginie Simonet, Beatrice Grenier, Françoise Villain, Anne-Marie Flank, Guy
Dhalenne, Alexandre Revcolevschi, Jean-Pierre Renard
To cite this version:
Virginie Simonet, Beatrice Grenier, Françoise Villain, Anne-Marie Flank, Guy Dhalenne, et al.. Effect
of structural distortions on the magnetism of doped spin-Peierls CuGeO3. European Physical Journal
B: Condensed Matter and Complex Systems, Springer-Verlag, 2006, 53, pp.155.
�10.1140/epjb/e2006-00357-8�. �hal-00090850v2�
(will be inserted by the editor)
Effect of structural distortions on the magnetism of doped
spin-Peierls CuGeO
3
V. Simonet1, B. Grenier2,3, F. Villain4, A.-M. Flank5, G. Dhalenne6, A. Revcolevschi6, and J.-P. Renard7
1 Laboratoire Louis N´eel, UPR 5051, B.P. 166, F-38042 Grenoble Cedex 9, France 2 CEA-Grenoble, DRFMC / SPSMS / MDN, F-38054 Grenoble Cedex 9, France 3 Universit´e Joseph Fourier, B.P. 53, F-38041 Grenoble Cedex 9, France
4 Laboratoire de Chimie Inorganique et Mat´eriaux Mol´eculaires, UMR 7071, UPMC, 4 place Jussieu, F-75252 Paris Cedex 05,
France
5 SOLEIL, L’Orme des Merisiers, Saint-Aubin - BP 48, F-91192 Gif-sur-Yvette Cedex, France
6 Laboratoire de Physico-Chimie de l’Etat Solide, UMR 8648, Universit´e Paris-Sud, Bˆat. 414, F-91405 Orsay Cedex, France 7 Institut d’´electronique Fondamentale, UMR 8622, Bˆat. 220, Universit´e Paris-Sud, F-91405 Orsay Cedex, France
Received: date / Revised version: date
Abstract. The chemical selectivity and great sensitivity of the Extended X-ray Absorption Spectroscopy technique allowed the determination, in the paramagnetic phase, of the structural distortions induced by doping in the spin-Peierls CuGeO3 compound. The distorted environments were analyzed as a function of
concentration, magnetic nature of impurity and the substitution site (Ni, Mn and Zn impurities on the Cu site, Si impurity on the Ge site). This has led to estimate the variation of the angles and pair distances, and hence to evaluate the magnetic coupling along the Cu chains in the vicinity of the impurities. The antiferromagnetic interaction between Cu first neighbors in the pure sample is found to be weakened around Ni, almost cancelled in the case of Mn doping, and even to change sign, producing a ferromagnetic coupling for Si doping. More generally, the structural distortions on a local scale are shown to be key parameters for the understanding of the magnetic properties of doped spin-Peierls compounds.
PACS. 61.10.Ht X-ray absorption spectroscopy: EXAFS, NEXAFS, XANES, etc. – 61.72.-y Defects and impurities in crystals; microstructure – 75.10.Pq Spin chain models
1 Introduction
The first inorganic spin-Peierls (SP) compound, CuGeO3,[1]
has already been extensively studied for its original mag-netic properties. The possibility of substituting the cationic sites, Cu or Ge, by different magnetic or non-magnetic el-ements, has brought new information and rose new ques-tions.
The structure of CuGeO3 can be described as a
stack-ing of CuO6 octahedra and GeO4 tetrahedra along the
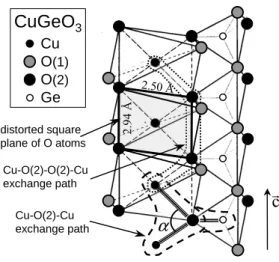
c direction of the structure. Each O belongs to both a Ge tetrahedron and a Cu octahedron. The stacking of distorted octahedra (elongated along the direction of the apical O(1) and with a planar distorted square of basal O(2) in the perpendicular direction) results in chains of magnetic Cu2+ ions located at the center of edge
shar-ing squares of O(2) runnshar-ing along the c axis (Fig. 1). At room temperature, this compound then consists of uni-form chains of spins S=1/2, interacting by superexchange through O(2) atoms leading to an antiferromagnetic (AF) Heisenberg-type coupling (Fig. 1). A magnetoelastic in-stability produces a dimerization of the chains below a critical temperature TSP of 14.25 K. This leads to a
sin-CuGeO
3 Cu O(1) O(2) Ge distorted square plane of O atoms 2.50 Å Cu-O(2)-Cu exchange path Cu-O(2)-O(2)-Cu exchange pathα
r
c
2 .9 4 ÅFig. 1. Schematic structure of CuGeO3
glet (non-magnetic) ground state separated from the first excited triplet state (S = 1) by an energy gap of 2 meV. Below TSP, the magnetic susceptibility drops to zero with
a temperature activated behavior, and diffraction experi-ments reveal new superlattice peaks [2].
Doping, either with Zn, Ni, Mg or Mn on the Cu site [3, 4,5] or with Si on the Ge site [6,7], results into a decrease of TSP and, at a lower temperature, the N´eel temperature
TN, into a transition to an AF long-range ordering (LRO).
Some of these impurities are magnetic, like Ni with spin 1 and Mn with spin 5/2 [8], while the others, Zn, Mg and Si, are non magnetic. They also have very different ionic radii whose consequence on the magnetic properties will be discussed in Sec. IV and V. A systematic study of the magnetic properties of single crystals with various doping levels (CuGe1−xSixO3 with 0 < x ≤ 0.08, and
Cu1−yMyGeO3 with M = Zn, Mg, Ni and 0 < y ≤ 0.1),
all synthesized and characterized in the same way, has allowed establishing a quasi-universal phase diagram for the spin-Peierls transition [5]. The variation of TSP versus
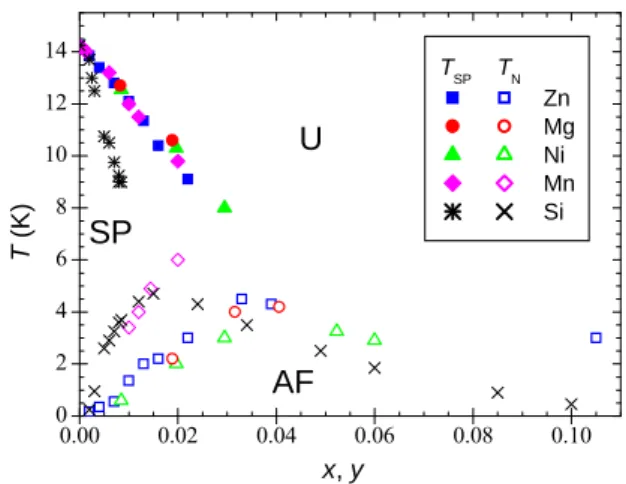
concentration was found identical for all impurities on the Cu site, including Mn, which has been studied since Ref. [5] (for 0 < y ≤ 0.02), and for Si impurities applying a scaling factor y ≈ 3x. This is illustrated in Fig. 2 of Ref. [5] and in the alternative representation of the present Fig. 2 where no scaling factor y ≈ 3x is applied in view of the discussion of Sec. V.B. Surprisingly, doping outside the spin chains is thus about three times more efficient in destroying the spin-Peierls phase than doping within the chains1. In contrast, T
N varies with the type of impurity:
it is higher for Mn and Si-doping and slightly lower for Ni-doping, in comparison with the value, found identical, for the non-magnetic impurities Mg and Zn. A difference between Ge site and Cu site doping is observed concerning the TN(y, x) transition line which is continuous in the first
case and presents a kink between a dimerized AF phase at low doping and a uniform AF phase at larger doping in the second case [12]. This behaviour is characteristic of a second-order and a first-order phase transition, re-spectively. Another particularity concerns the easy axis of magnetization in the AF phase: it is the a−axis for Ni doping and the c−axis for all other substitutions, which can be explained by the single-ion anisotropy of Ni2+ in a
distorted octahedral environment [13].
These results must be considered in the light of the dif-ferent couplings along the Cu chains. The magnetic prop-erties are mainly driven by two kinds of AF couplings: A superexchange coupling Cu-O(2)-Cu between first Cu
1 Note that, while for Ni, Zn and Mg, the results of
Gre-nier et al. [5] are in rather good agreement with the work of other groups on crystals of different origin, a large spread of re-sults exists concerning Si-doping. The slope of TSP(x) from the
works of Katano et al. [9] and Hiroi et al. [10] is smaller than that found by Grenier et al. while it is similar in the work of Wang et al.[11], leading to the scaling factors y = x, y = 1.5 x and y ∼ 2 − 3 x respectively. However, we are more confident in the results of Grenier et al. concerning the Si-doping data since the weaker effect measured by other groups suggests that not all Si ions enter the CuGeO3structure and/or part of them
segregates (as was already observed in highly doped samples). This leads to overestimate x and thus results in an apparent smaller scaling factor between y and x.
0.00 0.02 0.04 0.06 0.08 0.10 0 2 4 6 8 10 12 14
U
AF
SP
T ( K ) x, y TSP TN Zn Mg Ni Mn SiFig. 2. (Temperature - concentration) magnetic phase diagram for CuGe1−xSixO3 and Cu1−yMyGeO3, with M =Zn, Mg, Ni,
and Mn.
neighbors with an AF exchange constant J1= 120 − 180
K and a frustrating AF coupling between second neigh-bors J2 = 0.24 − 0.36 J1 via the Cu-O(2)-O(2)-Cu path
[14,15] (Fig. 1). The inter-chain couplings are one order and two orders of magnitude smaller along the b and a axes, respectively [15]. These inter-chain couplings induce a coherence between the phases of the distortion waves on different chains. In CuGeO3, the dimerization pattern
is out of phase for adjacent chains in the b and a di-rections. The strength and nature of the magnetic inter-actions are strongly dependent on the Cu-O(2) and Ge-O(2) distances and even more drastically on the Cu-Ge-O(2)- Cu-O(2)-Cu superexchange angle (denoted α). The Goodenough-Kanamori-Anderson rules [16] state that the exchange is ferromagnetic (FM) for an angle of 90◦. The deviation of
the Cu-O(2)-Cu angle from this value (α=99◦in CuGeO 3)
will drive the exchange towards antiferromagnetism [17]. However, Geertsma and Khomskii pointed out that cal-culations taking into account this sole effect still yield a slightly ferromagnetic exchange coupling [18]: The hy-bridization of Ge orbitals with the 2py ones of the O(2),
which destroys the equivalence of 2px and 2py O(2)
or-bitals, must indeed be taken into account to obtain, for J1, an AF exchange with a reasonable value of 135 K.
The aim of the present work is to understand the effect of doping the Cu chains, with magnetic and non-magnetic impurities, and out of the chains in the case of Si-doping, by measuring the induced structural distortions of doped CuGeO3. These distortions should strongly influence the
magnetic properties, in particular via the variation of the superexchange angle α and thus of the related magnetic coupling J1. The EXAFS (Extended X-ray Absorption
Fine Structure) spectroscopy technique was chosen for this purpose as a local order probe, with chemical sensitivity, and for its possibility to measure very diluted systems. For the first time with this technique, the influence of Ni, Mn, Zn and Si-doping was investigated in the paramagnetic
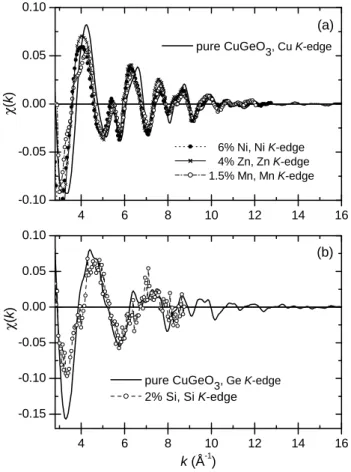
4 6 8 10 12 14 16 -0.10 -0.05 0.00 0.05 0.10 4 6 8 10 12 14 16 -0.15 -0.10 -0.05 0.00 0.05 0.10 (a) 6% Ni, Ni K-edge 4% Zn, Zn K-edge 1.5% Mn, Mn K-edge χ (k ) pure CuGeO 3, Cu K-edge (b) χ (k ) k (Å-1)
pure CuGeO3, Ge K-edge
2% Si, Si K-edge
Fig. 3. Comparison of the measured χ(k) functions (a) for pure CuGeO3at the Cu K-edge, and for 6% Ni, 1.5% Mn and
4% Zn doped samples, at the impurity K-edges and (b) for pure CuGeO3 at the Ge K-edge and for 2% Si-doped sample
at the Si K-edge.
phase (T > TSP) but not that of Mg-doping because of
the too low energy absorption of the Mg atom.
The next section is devoted to the experimental details and to a brief recall of the EXAFS analysis methodology. The EXAFS results are reported in section III for Cu site and Ge site doping. The structural distortions, as deduced from the EXAFS refined parameters, are analyzed in sec-tion IV. Their influence is discussed in secsec-tion V, in re-lation with the magnetic properties, and a conclusion is given in Sec. VI.
2 Experiment
The EXAFS measurements at the Cu and Ge absorption K-edges, in transmission detection mode, and at the Ni, Mn and Zn absorption K-edges, in fluorescence detection mode, were carried out at LURE (Orsay) on the D42 and D44 beamlines of the DCI storage ring. The experiments were performed at 78 K, in the paramagnetic phase, above the spin-Peierls transition. The incident energy was varied by 2 eV steps using a Si(111) single crystal monochroma-tor. The EXAFS oscillations were obtained in
transmis-sion detection mode by measuring the X-ray beam inten-sities with ionization chambers, before (I0) and after (I1)
the sample, in an energy range close to the absorption K-edge of Cu (λCu
K =8979 eV) and Ge (λGeK=11103 eV).
The samples studied in the transmission detection mode were pellets of homogeneous thickness made of a mixture of about 15 mg of single crystal ground into very fine powder and 35 mg of cellulose. In the fluorescence detec-tion mode, the powder obtained from ground doped crys-tals was spread on an adhesive tape. The EXAFS spectra were measured in the fluorescence detection mode with a multielements detector around the impurities K-edges in the 2% and the 6% Ni-doped samples (absorption K-edge λN i
K = 8333 eV), 1.5% Mn-doped sample (λMnK = 6539
eV), and the 4% Zn-doped sample (λZn
K = 9659 eV).
The Si K-edge EXAFS experiment was performed on the SA32 beamline of SUPERACO using a 2 InSb crystals monochromator. A thin slice of 2% Si-doped single crys-tal (absorption K-edge λSi
K = 1839 eV) was cleaved and
stuck with Ag glue on an indium covered sample-holder. The absorption signal was recorded with a monoelement detector in the fluorescence detection mode.
The EXAFS oscillations were analyzed using the FEFF package [19]. The EXAFS oscillations, χ(k), were extracted from the experimentally measured absorption coefficient µ(E) using the AUTOBK program with k, the wavenum-ber of ejected photoelectron, equal to:
k = q
2m(E − E0)/¯h2 (1)
where E0 is the absorption energy for the K-edge and m
the electron mass.
For an absorbing central atom surrounded by N iden-tical atoms, when considering only single scattering paths, EXAFS oscillations created by the backscattering of the photoelectron from the neighboring atoms are given by:
χ(k) = −S02 N kr2 |F (k, π) | e−2k 2σ2 e−2r/λ(k) sin [2kr + 2δ(k) + Φ(k)] (2) where r is the mean pair distance, σ2 is the associated
Debye-Waller factor which takes into account the struc-tural and dynamical disorders, and S2
0 is the amplitude
reduction factor accounting for many-body effects within the absorbing central atom. The other parameters in Eq. (2) are the phase Φ(k) and the modulus of the complex function F (k, π), which both depend on the nature of the backscattering atom, the mean free path λ(k) and the absorbing atom phase shift δ(k). They are derived from the theoretical ab-initio multiple scattering calculations by the FEFF program using crystallographic data. In or-der to describe a real environment, the surrounding atoms are gathered into atomic shells (atoms at approximately the same distance from the absorber), themselves subdi-vided into several subshells, for each kind of chemically and crystallographically equivalent neighbors.
Representative measured EXAFS oscillations χ(k) are shown in Fig. 3. Note that the spectra of the doped sam-ples, recorded at the impurity K-edge, are more noisy than
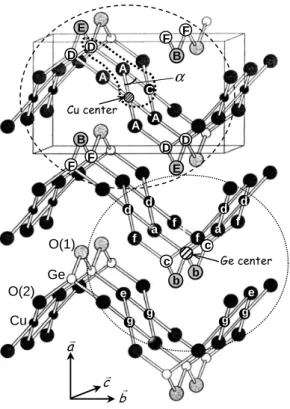
cr ar br α A A A A B B C D D D D E E F F F F O(2) Cu O(1) Ge f c a a f f f f c b b e e d d d d g g g g Cu center Ge center
Fig. 4. Structure of CuGeO3. The Cu and Ge environments are
materialized: starting from the dashed Cu and Ge absorbers, the atoms labelled ”A”,”B”, ... ”F” (for Cu) and ”a”, ”b”, ... ”g” (for Ge) are their neighbors going from the closest to the furthest ones that were accessible in the EXAFS experiment.
those recorded at the Cu and Ge K-edges because of the small amount of absorbers and of the fluorescence detec-tion mode. In consequence, the EXAFS analysis could not be performed up to such large k values at the impurity edges compared to the Cu and Ge ones. For the Si K-edge spectrum, an additional source of noise was the low fluorescence yield and the small photon flux at this low en-ergy. The complex Fourier transforms (denoted FT) of the k3 weighted χ(k) functions were then calculated using a
Hanning window. The amplitude of this FT can be associ-ated with a pseudo-radial atomic distribution around the absorber in the r-space. Lastly, the EXAFS oscillations of the atomic shells of interest have been isolated by a subse-quent inverse Fourier-transform (denoted IFT) performed in a restricted appropriate r-range and leading to a Fourier filtered k3χ(k) function. The FT and IFT were simulated
with the FEFFIT program by summing the contributions given in Eq. (2) for all subshells obtained from the struc-tural model. The multiple scattering paths, whose contri-bution was checked to be weak, were not included in the calculation. In the fit, the pair distances, the Debye-Waller factors and the energy shift ∆E0 were allowed to vary2.
For the analysis of the EXAFS oscillations recorded at the
2 ∆E
0 accounts for inaccuracies in the FEFF determination
of the absorption threshold energy E0. Different values of ∆E0
were refined for the O, Cu and Ge neighbors. These extra shifts
1 2 3 4 0 2 4 6 8 10 12 14 0 5 10 15 -10 -5 0 5 10 0 2 4 6 8 10 12 14 -15 -10 -5 0 5 10 15 0.5 1.0 1.5 2.0 2.5 3.0 3.5 4.0 0 5 10 15 |F T (k 3 χ (k )) | r (Å) subshells: O(2) O(1) Cu Ge Cu K-edge F ilt e re d k 3 χ (k ) k (Å-1) pure CuGeO 3 F ilt e re d k 3 χ (k ) k (Å-1 ) Ge K-edge |F T (k 3 χ (k )) | r (Å)
Fig. 5. EXAFS results for the pure CuGeO3 sample.
Ampli-tude of the FT of k3χ(k) (left) and Fourier filtered k3χ(k)
(right) at the Cu (top) and Ge (bottom) K-edges. The mea-sured spectra are represented by full circles, the fit by a thick solid line. The contributions of each kind of neighbors are also shown on the FT plots (left).
impurity absorption edges, the FEFF files for each scat-tering path were recalculated with the impurity replacing Cu or Ge absorber within the same structure.
3 Results
3.1 Pure sample
The structure of CuGeO3 in the paramagnetic state was
initially refined by V¨ollenkle et al. [20] and later by Braden et al. [17,21] (space group P bmm, a = 4.796 ˚A, b = 8.466 ˚A, c = 2.940 ˚A at 295 K), from Rietvelt refinement of X-ray and neutron powder diffractograms3. The
crys-tallographic data of Braden et al. [17] were used as input
are meant to correct errors introduced by FEFF in the calcu-lation of the scattering phase shifts.
3 The structure was revised by M. Hidaka et al., J. Phys.:
Condens. Matter 9, 809 (1997). They found a different space group P 212121and a larger unit cell 2a × b× 4c than Braden et
of the FEFF program in our EXAFS analysis. These struc-tural parameters yield, for the atomic distribution around Cu atoms, a first shell with the 4 square planar O(2) at 1.942 ˚A and a second shell including the 2 apical O(1) at 2.78 ˚A, the 2 chain neighbors Cu at 2.95 ˚A and 4 Ge at 3.30 ˚A (top of Fig. 4). The atomic distribution around Ge atomsis made of a first shell with the 4 O of the tetra-hedron (2 O(2) at 1.737 ˚A and 2 O(1) at 1.778 ˚A) and a second shell including 2 Ge at 2.946 ˚A and 4 Cu at 3.30 ˚A (cf. bottom of Fig. 4). This shell description is summarized in Table I.
The EXAFS fitting procedure was tested on the pure CuGeO3 sample. The first two atomic shells of the
ra-dial distributions at both Cu and Ge K-edges were simul-taneously fitted. This implies that the distance and the Debye-Waller factor corresponding to each Ge-Cu paths were hold identical for the two sets of data during the re-finement. The k range used for the FT and for the fitting procedure was [3.5, 15 ˚A−1] while the r range used for
the IFT was [1, 3.4 ˚A] at both edges. The fits are in good agreement with the experimental spectra, as shown in Fig. 5, where the contribution of each kind of neighbors is rep-resented. Note that, at the Cu K-edge, the signal from the two apical oxygens O(1) is already very weak and the fur-ther O(1) neighbors were not considered because yielding a negligibly small contribution. However, the presence of the next 4 Ge atoms at about 3.786 ˚A was found necessary to fit correctly the second shell. The resulting structural parameters obtained at both edges are listed in Table I and the comparison with their initial values shows the consistency of the fit. After this first EXAFS analysis, the same procedure was applied to the doped samples.
3.2 Substitution on the Cu site
The Ni and Mn K-edges EXAFS oscillations were ana-lyzed up to k = 12 ˚A−1 (see Fig. 3). In the case of Zn, an
additional difficulty arose from the mixing of Cu K-edge and Zn K-edge EXAFS oscillations due to the closeness of the absorption energies of both elements: 8979 eV for Cu and 9659 eV for Zn.4. Therefore, the Zn K-edge
spec-trum, after correction from the contamination by the Cu K-edge oscillations, could be analyzed in a more limited k range, up to 9 ˚A−1 (cf. Fig. 3).
First, the structural results derived at the Cu K-edge in the doped samples were found identical to those of the pure sample, even for doping levels as high as 6% (Ni). The distortions induced by the impurities were then de-duced from the comparison of the structural parameters
al.[17], who nonetheless reconfirmed the initial structure one year later [21].
4 To correct the Zn K-edge spectrum, the Cu K-edge
oscil-lations χ(E) of the pure sample, recorded up to 9998 eV, were converted into χ(k) using Eq.(1) with the absorption energy E0 of Zn. The Cu EXAFS contribution, whose amplitude at
the Zn edge was obtained from the ratio of both absorption jumps recorded in a unique scan in the doped sample, was then subtracted from the Zn spectrum.
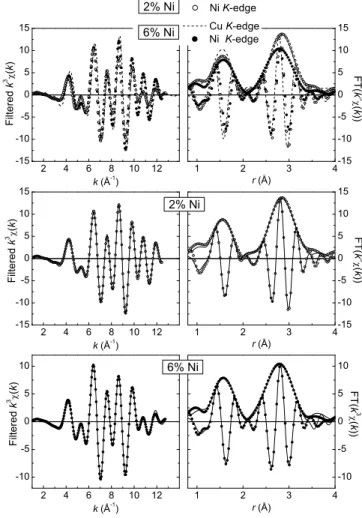
2 4 6 8 10 12 -10 -5 0 5 10 2 4 6 8 10 12 -15 -10 -5 0 5 10 15 1 2 3 4 -15 -10 -5 0 5 10 15 1 2 3 4 -10 -5 0 5 10 2 4 6 8 10 12 -15 -10 -5 0 5 10 15 1 2 3 4 -15 -10 -5 0 5 10 15 F i l t e r e d k 3 ( k ) k (Å -1 ) 2% Ni F i l t e r e d k 3 ( k ) k (Å -1 ) F T ( k 3 ( k ) ) F T ( k 3 ( k ) ) r (Å) r (Å) 6% Ni Cu K-edge Ni K-edge 6% Ni Ni K-edge F i l t e r e d k 3 ( k ) k (Å -1 ) 2% Ni F T ( k 3 ( k ) ) r (Å)
Fig. 6. EXAFS results for the 2% and 6% Ni-doped CuGeO3.
Amplitude and imaginary part of the FT of k3χ(k) (right) and Fourier filtered k3χ(k) (left). Comparison of the measured spectra at the Ni K-edge for both doping levels and at the Cu K-edge for 6% Ni sample (top). Comparison of the measured spectra (circles) and of the fits (solid lines) at the Ni K-edge for 2% doping (middle) and 6% doping (bottom).
obtained at the impurity and at the Cu K-edge in the same sample and using the same k and r-ranges of anal-ysis for the EXAFS oscillations. Note that we did not try to take into account impurity neighbors in our structural model (although there can be some for high doping lev-els) because it is most probably impossible to distinguish them from Cu neighbors in the EXAFS analysis.
The FT of k3χ(k) and Fourier filtered k3χ(k) are shown
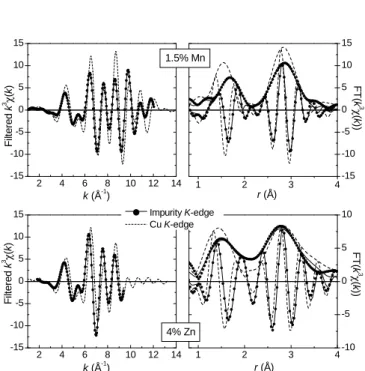
in Fig. 6 for the 2% and 6% Ni-doped compounds and in Fig. 7 for the 1.5% Mn and 4% Zn-doped compounds. The spectrum recorded at the impurity K-edge in each com-pound is compared to its fit and to the reference spectrum at the Cu K-edge. The structural parameters extracted from the fits are reported in Table II. The fits in k and r spaces are of rather good quality. For all doping values, the amplitude of the FT, for the first O shell, is smaller at the impurity K-edge than at the Cu one, which is related
Table 1. Structural parameters of the atomic radial distribution up to 3.95 ˚Acentered on Cu and Ge atoms, from the crystal-lographic data of Braden et al. [17] and from the EXAFS simulations of the pure CuGeO3sample at both Cu and Ge K-edges.
The atom labels are those of Fig. 4. Crystallographic data of Braden et al. [17] imply two slightly different Ge-O distances for the two pairs of oxygens within the tetrahedron. The parameters reported with no error bar were held fixed during the fit. The error bars only account for the statistical uncertainties and are therefore probably underestimated. The pair distances r and Debye-Waller factors σ2are in ˚A and ˚A2respectively. The quality of the EXAFS fit is given by the R-factor: Rf =0.002 at the Cu K-edge and Rf =0.008 at the Ge K-edge. The refined S20 values are 0.927 at the Cu K-edge and 0.953 at the Ge K-edge.
Cu center Ref. [17] EXAFS Ge center Ref. [17] EXAFS
atom label r r σ2 atom label r r σ2
4 O(2) A 1.9324 1.942(5) 0.0032(4) 2 O(2) a 1.7322 1.737(3) 0.0022(3) 2 O(1) B 2.7547 2.77(4) 0.010(6) 2 O(1) b 1.7729 1.778(3) 0.0022(3) 2 Cu C 2.9400 2.944(7) 0.0027(4) 2 Ge c 2.9400 2.941(5) 0.0022(3) 4 Ge D 3.2872 3.294(7) 0.0040(2) 4 Cu d 3.2872 3.294(7) 0.0040(3) 2 O(1) E 3.6975 2 O(2) e 3.3015 3.301 0.006(4) 4 O(2) f 3.4123 3.412 0.006(4) 4 Ge F 3.7717 3.74(3) 0.014(2) 4 Cu g 3.7717 3.74(3) 0.014(2) 2 4 6 8 10 12 14 -15 -10 -5 0 5 10 15 2 4 6 8 10 12 14 -15 -10 -5 0 5 10 15 1 2 3 4-15 -10 -5 0 5 10 15 1 2 3 4-10 -5 0 5 10 F ilt e re d k 3 χ (k ) 1.5% Mn k (Å-1 ) Impurity K-edge Cu K-edge F ilt e re d k 3χ (k ) 4% Zn k (Å-1) F T (k 3 χ (k )) r (Å) F T (k 3 χ (k )) r (Å)
Fig. 7. EXAFS results for 1.5% Mn (top) and 4% Zn (bot-tom) doped CuGeO3 : amplitude and imaginary parts of the
FT of k3χ(k) (right) and Fourier filtered k3χ(k) (left) of the
measured data (full circles) and their fits (solid lines) at the im-purity K-edge. The Cu K-edge spectra measured on the same sample are also shown (dashed lines), for comparison.
to an increase of the Debye-Waller factor, in agreement with a doping-induced structural disorder. An increased Debye-Waller factor is also observed for the second shell in the case of the 6% Ni and 1.5% Mn-doped compound. Note that the 4% Zn-doped compound shells are less well-defined because of the smaller k range of integration. For all compounds, the first shell is shifted towards larger r values. The distance from the absorber to the O(2) first neighbors increases more and more when replacing Cu by Ni (∆r/r = 1.4% and 2.2% for 2 and 6% doping resp.),
Zn (∆r/r = 4.5%) and Mn (∆r/r = 7.3%). Interestingly, the structural distortion varies also for a same impurity as a function of its doping level, as shown by the increase of the Debye-Waller factor and first Ni-O(2) distance from 2% to 6% Ni. For Ni and Zn impurities, there is an ambigu-ity concerning the position of the next nearest neighbors, the apical oxygens O(1). They are found either closer or further away from the impurity than from Cu (see param-eters of the equally good EXAFS fits in Table II). At the Mn K-edge, there is no such ambiguity since the EXAFS spectra is 10 times better fitted when the O(1) atoms are closer from the impurity than further away, as compared to the Cu environment. Lastly, there is a clear variation of the distances to the next Cu and Ge neighbors with respect to the Cu environment (1.6% and 1% increase, respectively) in the case of the Mn impurity only.
3.3 Substitution on the Ge site
The EXAFS oscillations, recorded at the Si K-edge in a 2% Si-doped sample, are limited to 8.7 ˚A−1 and allow
get-ting information only about the first O tetrahedral shell. Note that, due to the small range of fitting, the Debye-Waller factor could not be accurately refined and was fixed to 0.002 ˚A2, i.e. to the value found in the pure sample at
the Ge K-edge. This may be one reason for the small dis-crepancies (R-factor value of 0.011) observed between the fit and the experimental data (Fig. 8). The results, ob-tained using S2
0=0.81 in the fitting procedure, indicate a
strong contraction of the Si-O distance of about 8.4% with respect to the Ge-O distance. In addition, a more symmet-ric environment is found around the Si than around the Ge atoms, that can be described by a small regular O tetrahedron with distance from center to corner of 1.61(2) ˚
A (instead of 1.74 and 1.78 ˚A for the two pairs of oxy-gen forming the distorted tetrahedron surrounding the Ge atoms).
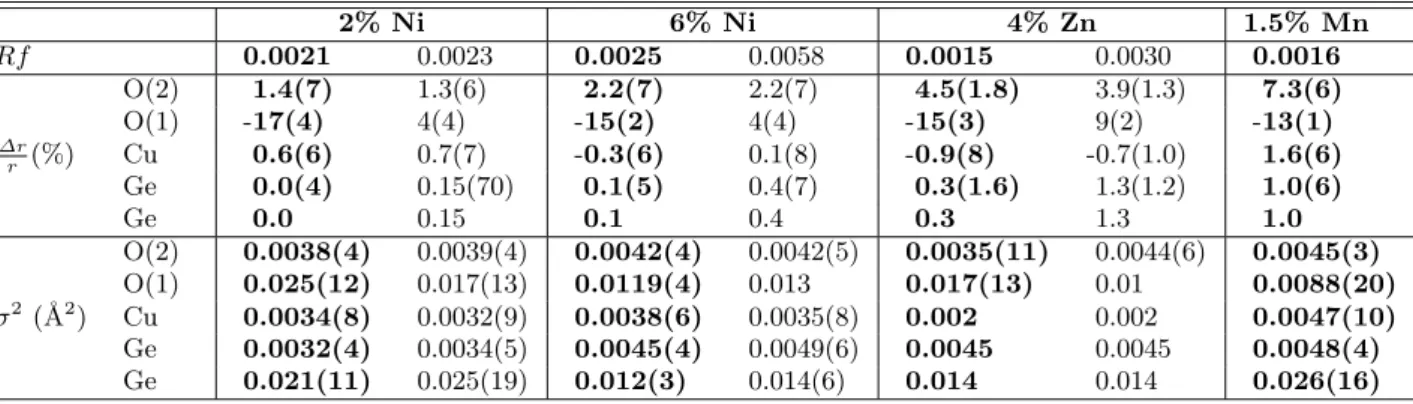
Table 2. Structural parameters obtained from the simulations of the EXAFS spectra at the impurities K-edges of the Cu-site doped CuGeO3 samples: R-factors (quality of the fit), relative distance variations ∆r/r and Debye-Waller factors σ2. The
relative distance variations induced by impurities are calculated with respect to the results obtained for the Cu K-edge spectrum of the same sample analyzed using the same k and r ranges (see Table 1). For Ni and Zn impurities, two roughly equivalent solutions of the EXAFS fits are reported with a different distance from the impurity to the apical oxygens O(1), while only one solution is relevant for Mn. The results given in bold characters correspond to the solutions validated by the analysis presented in Sec. 4.1. Note that the parameters presented with no error bar were held fixed during the fit and equal to the Cu K-edge refined value in the same sample. The S20 factors at all the impurities K-edges were fixed to the value of 0.927 obtained at the
Cu K-edge. 2% Ni 6% Ni 4% Zn 1.5% Mn Rf 0.0021 0.0023 0.0025 0.0058 0.0015 0.0030 0.0016 O(2) 1.4(7) 1.3(6) 2.2(7) 2.2(7) 4.5(1.8) 3.9(1.3) 7.3(6) O(1) -17(4) 4(4) -15(2) 4(4) -15(3) 9(2) -13(1) ∆r r (%) Cu 0.6(6) 0.7(7) -0.3(6) 0.1(8) -0.9(8) -0.7(1.0) 1.6(6) Ge 0.0(4) 0.15(70) 0.1(5) 0.4(7) 0.3(1.6) 1.3(1.2) 1.0(6) Ge 0.0 0.15 0.1 0.4 0.3 1.3 1.0 O(2) 0.0038(4) 0.0039(4) 0.0042(4) 0.0042(5) 0.0035(11) 0.0044(6) 0.0045(3) O(1) 0.025(12) 0.017(13) 0.0119(4) 0.013 0.017(13) 0.01 0.0088(20) σ2(˚A2) Cu 0.0034(8) 0.0032(9) 0.0038(6) 0.0035(8) 0.002 0.002 0.0047(10) Ge 0.0032(4) 0.0034(5) 0.0045(4) 0.0049(6) 0.0045 0.0045 0.0048(4) Ge 0.021(11) 0.025(19) 0.012(3) 0.014(6) 0.014 0.014 0.026(16) 2 4 6 8 10 12 14 -10 -8 -6 -4 -2 0 2 4 6 8 10 0.0 0.5 1.0 1.5 2.0 2.5-15 -10 -5 0 5 10 15 Si K-edge
pure CuGeO3, Ge K-edge 2% Si F ilt e re d k 3 χ (k ) k (Å-1) F T (k 3 χ (k )) r (Å)
Fig. 8. EXAFS results for 2% Si-doped CuGeO3. Amplitude
and imaginary part of the FT of k3χ(k) (right) and Fourier filtered k3χ(k) (left) at the Si K-edge of the doped sample (full circles) compared to the fit (solid lines) and to the results obtained at the Ge K-edge on the pure sample (dashed lines).
4 Analysis
4.1 Comparison with ionic radii
The ionic radius for each chemical species, which depends mainly on its oxydation and spin states, on its coordi-nation number (the radius increases with the number of neighbors) and on the polyhedral description of its envi-ronment, can be roughly estimated as a function of these sole criteria and independently of the detailed structure [22]. It is therefore interesting to compare the results of the present experiment concerning the structural
distor-tion of the first shell around the impurities with the pair distances evaluated from these ionic radii (tabulated in Table I of Ref. [22]). This qualitative analysis allows check-ing the validity of the EXAFS analysis and liftcheck-ing some remaining ambiguities.
In practice, the M -O pair distance (M denoting the absorbing ion on the Cu or Ge site) is evaluated by sum-ming the ionic radii of M and of its O2− first neighbors
for comparison with the distances obtained from EXAFS. The results are summarized in Table III. The simplest case concerns the Ge site in which Ge4+and Si4+ions are
surrounded by a slightly distorted and a regular tetrahe-dron, respectively. The calculations of the Ge-O and Si-O distances determined from EXAFS are in excellent agree-ment with the distances derived from the ionic radii [22]. The case of the Cu site is more complex. The Cu2+
is surrounded by an elongated octahedron made of a dis-torted basal square of 4 O(2) and 2 apical O(1) at a much larger distance. The calculated Cu-O distance from the ionic radii, in the hypothesis of square planar configura-tion, yields a very good agreement with the measured Cu-O(2) distance indicating that the orbital configuration of the Cu is mainly sensitive to the 4 closer O(2). Accord-ing to the EXAFS results, there are two indistAccord-inguish- indistinguish-able solutions for the geometry of the oxygen octahedra around Ni2+and Zn2+impurities on the Cu site. The
api-cal O(1) would get closer to the impurity or further away as compared to the Cu environment, corresponding to an environment closer to a regular octahedron or closer to a square planar environment, respectively. Note however that a square planar configuration exists only for Cu and Ni. Concerning the Ni, the only way to reproduce the ob-served increase of the Ni-O(2) distance, as compared to the Cu one, is an orbital configuration compatible with an O octahedron around the Ni and excludes a square
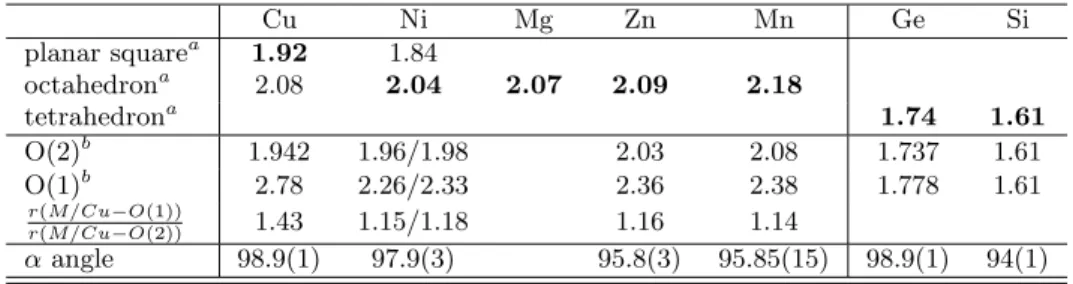
Table 3. Distances to the first O neighbors, in ˚A, calculated from the ionic radii (a, from Ref. [22]) in octahedral and in square planar environments (when possible) for the Cu site, and in tetrahedral environment for the Ge site. The distances in bold are compatible with those derived from EXAFS and reported below (b) with the corresponding elongation ratio of the octahedron. The 2% and 6% Ni-doping results are reported. The last line of both tables gives the superexchange α angle in degrees, estimated from these EXAFS results (see Sec. 4.2).
Cu Ni Mg Zn Mn Ge Si planar squarea 1.92 1.84 octahedrona 2.08 2.04 2.07 2.09 2.18 tetrahedrona 1.74 1.61 O(2)b 1.942 1.96/1.98 2.03 2.08 1.737 1.61 O(1)b 2.78 2.26/2.33 2.36 2.38 1.778 1.61 r(M/Cu−O(1)) r(M/Cu−O(2)) 1.43 1.15/1.18 1.16 1.14 α angle 98.9(1) 97.9(3) 95.8(3) 95.85(15) 98.9(1) 94(1)
planar description. This conclusion also holds for Zn, for which only an octahedral environment is expected to ex-ist. For Mn2+, the EXAFS analysis was unambiguous. A
Mn-O distance close to the one derived from the EXAFS analysis is indeed found when the ionic radius of Mn2+ is
evaluated assuming an octahedral environment and a high spin state (i.e. S=5/2), as inferred from the fine structure splitting of the ESR spectra at low temperature [8]. Note that the M -O distances for Ni, Zn and Mn, are slightly smaller than the one derived from the ionic radii because the octahedron is distorted. Some characteristic features of elongated octahedral environments are also observed in the X-ray Absorption Near Edge Structure spectra mea-sured at the Cu K-edge in the pure compound and at the Cu-site impurities K-edge in the doped compounds, in agreement with the present analysis. These considerations allow to validate the EXAFS soluconsiderations for the M -O distances and to reproduce qualitatively their increase when substituting Cu by Ni, Zn and Mn, in this order. For the non-magnetic Mg impurity, extensively studied but for which no EXAFS measurements could be done, the follow-ing prediction can be made based on the same ionic radii analysis: the distortions around Mg are expected to be in-termediate between those induced by Ni and Zn. Note that the distortion reduction of the oxygen octahedron, when replacing Cu by the other impurities, could be expected since the axial elongation in the Cu2+ case is related to
a strong Jahn-Teller effect, usual for this ion. Its substi-tution with non-magnetic or non Jahn-Teller 3d ions, like Ni2+ or high spin Mn2+, should reduce this effect. The
remaining octahedral distortion is then only induced by the structural environment.
To summarize, i- the Cu environment is closer to a square planar one (rCu−O(1)/rCu−O(2) ≃ 1.4) while sub-stituting this site yields an environment closer to a reg-ular octahedron (rM−O(1)/rM−O(2) ≃1.14-1.18 for M = Ni, Zn, Mn) with the first distance increasing with re-spect to Cu in the following order: M = Ni, Mg, Zn, Mn, ii- Si-doping on the Ge site induces a contraction of its surrounding oxygen tetrahedron, as strong as the pushing away of the O(2) first neighbors around the Mn impurity.
4.2 Superexchange angle calculation
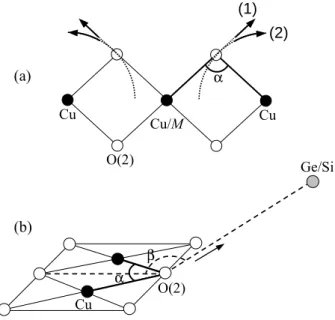
The distance variations in the impurities environment de-termined from the present experiment can now be used to calculate a structural parameter relevant for the mag-netic properties: the superexchange angle α, connecting 2 adjacent Cu sites through the O(2) atom. In the case of doping on the Cu site, this angle α = M −O(2)−Cu will be modified within one chain on both sides of the impurity M , while in the case of doping on the Ge site, this angle α = Cu−O(2)−Cu involves the O(2) connected to the Si impurity and will thus be altered on two adjacent chains along the b direction (see Fig. 4).
Concerning the Cu-site impurities M = Zn, Ni and Mn, two hypothesis for the direction of displacement of their nearest neighbors can be made in order to estimate α from the measured rM−O(2) and rM−Cudistances. Note that the distance rM−Cu is altered only in the case of Mn doping. In the first hypothesis, the O(2) are pushed away from the impurity in the same direction than the initial Cu-O(2) one (cf. Fig. 9(a), arrow (1)). This also produces a slight modification of the distance between the O(2) and the first Cu neighbor of the impurity. In the second hy-pothesis, this Cu-O(2) distance is held identical to that in the pure sample, provided a small modification of the M -O(2) direction is made (cf. Fig. 9(a), arrow (2)). This assumption is suggested by the rigidity of the Cu-O(2) bond whose length is found unchanged in the otherwise largely distorted CuSiO3 compound [23,24]. The
calcu-lated α values with both hypothesis are 98-97.7◦ for 2%
Ni, 97.6-97.2◦for 6% Ni, 96.1-95.5◦for 4% Zn, and
95.7-96◦ for 1.5% Mn respectively, yielding the average values
listed in Table III. The angle decreases for all impurities on the Cu site, with respect to their value in the pure compound (99◦), but this effect is smaller in Ni-doped
compounds than in the Zn and Mn-doped compounds. In the case of substitution by Si on the Ge site, a com-plication arises from the fact that the whole geometry is not planar i.e. the β angle between the Cu-O(2) ribbons and the Ge-O(2) segment is equal to 159.5◦(cf. Fig. 9(b)).
A simple assumption for the Si-induced distortion is a con-traction of the O tetrahedron around the impurity without change of bond direction with respect to the Ge
environ-(a) (b) Ge/Si O(2) α β Cu α Cu Cu/M Cu O(2) (1) (2)
Fig. 9. Schematic view of the local deformation, due to M /Cu (a) and Si/Ge (b) substitution, assumed for the calculation of the local Cu(or M )-O(2)-Cu angle α (see text for the different scenarii).
ment. In this case, the O(2) atom is pulled towards the Si atom by 0.13 ˚A (arrow in Fig. 9(b)). This leads to an increase of the β angle (161.7◦) and a decrease of the α
angle down to 94.1◦. Note that a different variation of β
towards larger (resp. smaller) values would increase (resp. decrease) the value of α (estimated variation within ± 1◦). A possible contraction of the Cu-Cu distance was not
taken into account in this simple estimation of α, while it is suggested from the study of Si-doped polycrystals by X-ray diffraction (variation of the c parameter) [25]. This would decrease even more the Cu-O(2)-Cu angle. In conclusion, the reduction of the α angle should be even stronger for Si than for Zn and Mn-doping.
5 Discussion
5.1 State of the art
The next step is to relate the EXAFS results, and espe-cially the above determination of the superexchange angle, to the magnetic properties of doped CuGeO3. Let us recall
that there is a universal decrease of TSPversus the doping
concentration with y ≈ 3x in (Cu1−yMy)(Ge1−xSix)O3,
whereas the lower temperature onset of an AF LRO oc-curs at different TN values depending on the impurity [5].
Two observations have stimulated a lot of theoretical work [26,27,28,29,30,31]: the coexistence of both AF and SP LRO for small Si, Zn, Ni and Mn doping, as shown by neutron scattering studies [32,33,4,34], and the apparent absence of critical concentration of impurities for the on-set of this AF LRO [35]. From the different models that have been proposed, a generally admitted description of
the magnetic excitation of these dimerized chains emerges in terms of topological defects connecting regions of oppo-site dimerization parity. These defects, that can be intro-duced through doping, are then constituted by a soliton, pinned to the Cu substituent, followed on the same chain by an antisoliton which restores the interchain phasing. Although mobile in the isolated chains, the antisoliton remains confined close to the impurity site when inter-chain couplings are accounted for in order to minimize the size of the defective segment which presents an out-of-phase dimerization with respect to the 3D pattern [36, 28,30,31]. Such a description of the solitonic defects, in terms of soliton-antisoliton pairs carrying an uncompen-sated spin 1/2, leads to large AF fluctuations coexisting with underlying reduced dimerization. In pure samples, the spin-Peierls phase is established when the critical size and phase coherence of the dimerized domains is reached, allowing the system to collapse into a long-range ordered state. This average size of coherent dimerized domains is limited by thermally activated and/or doping-induced solitonic defects. This qualitatively explains the decrease of TSP with increasing impurity concentration. On the
other hand, in the presence of inter-chain coupling, the on-set of an AF LRO occurs when the AF correlated regions associated with these doping-induced soliton-antisoliton pairs overlap.
The magnetic behavior under doping is thus qualita-tively explained for non-magnetic impurities within the Cu chains. They simply cut one dimer, thus releasing one spin 1/2 solitonic defect confined close to the impurity. However, this is less obvious in the case of magnetic im-purities on the Cu site, which may still be magnetically coupled to the neighbor Cu spins, and even less for Si im-purities that are introduced outside the Cu chains. The na-ture of the released soliton-antisoliton pair through doping is a key feature in the understanding of the establishment of the AF LRO. Its nature will crucially depend on the strength of the local magnetic interaction. It is therefore necessary to relate the structural parameters determined in the vicinity of the impurity in the previous sections with the value of the Cu-M exchange interaction. The variation of the in-chain nearest neighbor constant, J1, with the
Cu-O(2)-Cu superexchange angle α was inferred from the pressure dependence of the susceptibility in CuGeO3and
found to be equal to: δJ1/(J1δα) ≈5.8% [37,38]. Various
calculations based on the analysis of microscopic magne-toelastic coupling [39] and microscopic structural mod-els [17] yielded different estimations: δJ1/(J1δα) ≈ 10%
and 22%, respectively. A value of δJ1/(J1δα) ranging
be-tween 10 and 20% was also found in microscopic calcula-tions of the exchange constants carried out using different approaches: perturbation theory, exact diagonalization of Cu2O2 clusters, and band calculations [38]. The general
result of these studies is that α reaches its critical value, corresponding to the cancellation of J1, i.e. to the
transi-tion from AF to FM coupling, between 90 and 95◦. Other
structural parameters can also affect J1 like the angle β
between the Cu-O(2) ribbons and the Ge-O(2) segment, or the pair distances involved in the exchange path, and
more generally, all the parameters that may influence the strength of the orbital hybridization.
5.2 Antiferromagnetism vs distortions 5.2.1 In-chain magnetic impurities
Concerning the magnetic impurities on the Cu site, let us recall that they drive the system towards an AF LRO at a temperature TN different from that induced by
non-magnetic Cu-site impurities, slightly lower for Ni and larger for Mn. From our estimation of the local α angle (Ta-ble III), the magnetic local coupling Jloc
1 between Ni2+
(spin 1) and its Cu2+ neighbors in Ni-doped CuGeO 3 is
expected to be still AF but smaller than the coupling be-tween Cu neighbors (J1= 120 − 180K). Both an analysis
of the thermal dependence of the magnetic susceptibility [5] and a resonance model for ESR results [13] have in-deed evidenced the formation of Ni-Cu pairs with an AF coupling Jloc
1 weaker than J1(most probable value of J1loc
estimated to be around 75 K [13]). The spin 1 of the Ni im-purity and the released spin 1/2 of the Cu therefore form an effective spin 1/2 solitonic defect at low temperature. In the case of Mn-doping, the α value for the Mn-O(2)-Cu path (Table III) suggests that Jloc
1 , although still AF,
becomes very weak, which could be reinforced by the frus-trating J2 next nearest neighbor interaction. Here again,
some ESR measurements [8] support this result with the observation of an hyperfine spectrum of the 55Mn
(nu-clear spin I=5/2) with fully developed 6 lines for very low Mn concentration (0.1 %). An upper value of Jloc
1 ≃4 mK
can be estimated from the splitting of the hyperfine lines. The detection of quasi free 5/2 spins between TSP and
TN thus demonstrates that the effective coupling between
Mn2+ and Cu2+ is close to zero. Hence, the onset of the
AF LRO is mainly due to a collective behaviour of the spins 1/2 solitonic defects, decoupled from the free 5/2 spins of the Mn impurities. It is indeed excluded for the direct Mn exchange to be responsible for the transition to AF LRO, due to the very large distances between the Mn atoms.
Therefore, the AF LRO transition observed for all the in-chain impurities presently studied seems to be mainly due to the cooperative behavior of soliton-antisoliton pairs (one released per impurity) carrying a spin 1/2, whatever the magnetic state of the impurity. Now, another param-eter can be considered in order to explain the differences between the various TN(y) transition lines. The present
study has revealed differences in the amplitude of the dis-tortion around each kind of impurities related to their ionic radii. For instance, the first neighbor distances to the impurity increases with respect to the Cu environment following the sequence Ni/Mg/Zn/Mn (section 4.1). The strongest local distortion, in the case of Mn, clearly affects further neighbors (more than two Cu-Cu distances). It is interesting to note that the TN values somehow vary in the
same way. The distortions induced by the impurities along the Cu chains can be very large (Table II) compared to the atomic displacements produced by the dimerization itself :
0.2% relative variation of the first Cu-Cu distance. In con-sequence, they will destroy locally the in-chain dimeriza-tion and will render the energetic criterion for inter-chain phase coherence ineffective. This could in turn affect the spatial distribution of the soliton-antisoliton pairs along the chain axis, i.e. their overall size or/and the mobility of the antisoliton. It would become easier for the antisoli-ton to accommodate its distance from the impurity and the global size of the soliton-antisoliton pair could be en-hanced. As a result, this additional degree of freedom may favor the overlap of the AF correlated regions and thus in-crease the TN. This mechanism provides an explanation
for the reported higher TN value for Mn with respect to Zn
due to the larger structural distortion of its environment. On the contrary, for Ni, the distortions are the smallest implying the lowest TN, as observed. Furthermore, the
AF coupling between the spin 1 Ni and the spin 1/2 Cu may pin the global spin 1/2 soliton-antisoliton pair closer to the impurity. As a result, the overlap between the AF correlations is reduced and the TN is lowered. Lastly, close
enough to TN, one can not rule out an indirect
polarisa-tion of the AF correlated regions by the Mn2+ spin (via
the inter-chain interactions for instance), which could ac-celerate the transition towards the AF LRO.
5.2.2 Out-of-chain Si impurity
An unsolved issue remains concerning the strong influence of the out-of-chain Si-doping on the magnetic properties of CuGeO3. The present study has allowed us to determine
the large local decrease of the superexchange angle α due to Ge substitution by the much smaller Si ion. α was found to be smaller than the one calculated in the case of Mn-doping for which an almost vanishing Jloc
1 was inferred
(Table III). This strongly suggests that Jloc
1 , coupling the
spins of each Cu pair on both chains facing the Si impurity, is indeed ferromagnetic. This is in agreement with theo-retical predictions of a weakly ferromagnetic value of Jloc
1 ,
which was calculated using realistic structural parameters: α=95◦ and Si-O bond length smaller by 0.13 ˚A than the
Ge-O one [18,38]. The authors have invoked additional parameters enhancing this trend towards ferromagnetism: the further weakening of the hybridization of the 2py O(2)
orbitals with Si, with respect to Ge, and the influence of frustrating J2next nearest interaction. This result is also
comforted by the structure and magnetic properties of an isostructural CuSiO3 single crystal [23,24]. The α angle
is equal to 94-95◦ in this compound [23,40], i.e. close to
the one determined locally around Si impurities in doped CuGeO3 (cf. section IV.B). The analysis, from
magne-tometry measurements and a neutron powder diffraction experiment, of the peculiar AF LRO arising around 8 K in CuSiO3, suggests a weak ferromagnetic nearest
neigh-bor exchange interaction J1and a stronger
antiferromag-netic next nearest neighbor interaction J2, similar to the
CuGeO3 one [23,40].
Important consequences are expected from a ferromag-netic Jloc
1 on the nature of the solitonic defects produced
properties. The dimerization pattern imposes that the Si impurity faces one strong bond corresponding to a dimer and one weak bond between two dimers. One can rea-sonably assume that this local variation of J1 will alter
only the strong bond, freeing two spins 1/2, and will have no effect on the other chain (even locally reinforcing its dimerization). In this case, the two released spins 1/2 of the dimer, ferromagnetically coupled, may combine into an effective free spin 1.
The Curie constant, extracted from the temperature dependence of the susceptibility between TSP and TN, in
a series of CuGe1−xSixO3 samples [7], was previously
an-alyzed according to Eq. 3 in a simple model where local spins S=1/2 are associated with the solitonic defects.
χpara(T ) = Kpara (g µB) 2
3kB(T − θ)
S(S + 1) (3)
with g = 2.05, the Land´e factor, µB the Bohr magneton,
kB the Boltzman constant, θ the Curie-Weiss
tempera-ture, and Kpara = N x with N the number of released
effective spins S per impurity. Once the contribution of spins 1/2 due to intrinsic impurities has been subtracted, the number N of spins 1/2 per Si is found close to 3, a puzzling value5. Assuming now that the solitonic defects
are ferromagnetic pairs of spin 1/2, the susceptibility of one pair is given by :
χpair(T ) = (g µB)2 kBT 2 3 + exp(−Jloc 1 /kBT ) (4) At low temperature, the expression of χpara(T ) then
re-duces to Eq. 3 for N such magnetic entities with an effec-tive spin S=1. This analysis yields N ∼ 1.2, which is close enough to the expected value of one ferromagnetic pair of spins 1/2 per Si impurity in this new description. This can be further argued from the analysis of the magnetization measured in a 0.3% Si-doped CuGeO3 sample (see Fig. 2
of Ref. [41]). The M (H) curve reaches a first saturation plateau Msat = N xgµBS = 0.0077µB in the SP phase
before entering the incommensurate phase. The analysis of the whole M (H) curve with Brillouin functions, after correction for the intrinsic impurities contribution, yields N ∼ 1.1 spins 1 or N ∼ 2.2 spins 1/2. The first result is in better agreement with the expected number of effective spins 1 and with the previous estimation of N , deduced from susceptibility analysis. The revised analysis of the magnetic measurements in Si-doped compounds is there-fore in favor of the release of one solitonic defect per Si with an effective spin 1, on one of both adjacent chains.
A consequence of the effective spin 1 of the solitonic de-fect produced by Si will be to renormalize TN ∝ S(S + 1)
by a factor of 2.67 as compared to the case of spin 1/2 solitonic defects released by the same concentration of Cu-site impurities. However, this comparison only holds if the spatial extension of the solitonic defect is otherwise iden-tical, thus producing the same overlap between AF cor-related regions. The overall size of the soliton-antisoliton
5 Note that in Ref. [7], the values of K
para were not
cor-rected for the 0.11% intrinsic spin 1/2 impurities found in pure CuGeO3and expected to be also present in doped samples.
pair along the c−axis was indeed estimated to be the same for Si and Zn from X-ray measurements [42]. This sup-ported the origin of the factor ∼3 between the TN of Si
and of non-magnetic Cu-site impurities from the differ-ent types of the effective spin associated to the solitonic defects, at least for low doping levels (see Fig. 2). The reason why this scaling does not hold at higher x may be due to a different mechanism involved in the onset of AF LRO. The distances between impurities are becoming shorter than the 1D magnetic correlations, and moreover, a first-order transition is observed in the case of Cu-site impurities between a dimerized and a uniform AF LRO, whereas the coherence length of the spin-Peierls ordering decreases progressively in the Si doping case [43].
5.3 Spin-Peierls transition vs distortions
Contrary to the sensitivity of the AF LRO to the nature of the impurity, discussed in the previous section on the basis of the EXAFS results, the decrease of the spin-Peierls tem-perature appears to be more universal. On the Cu site, the decrease of TSPhas exactly the same concentration
depen-dence for all studied Cu substituents, whatever the spin impurity and the amplitude of the in-chain local distor-tions around impurities (see Fig. 2). For Si-doping on the Ge site, TSP decreases ∼ 3 times faster with the
concen-tration, although the size of the solitonic defect induced by Si in the chain direction is similar to the one induced by Zn impurities [42].
Moreover, the average correlation length of the dimer-ized regions along c does not seem to be so relevant for the appearance of the SP LRO, as shown by the mea-surements of fluctuations in pure and doped CuGeO3for
different impurities above the SP transition [44,42]. First, the regime of 1D pretransitional fluctuations along the chain direction in pure CuGeO3 was shown to start well
above TSP, while these fluctuations become 2D and then
3D much closer to TSP. Secondly, the average size of the
dimerized regions along c in the pretransitional regime for Si, is comparable to that of Zn despite the factor ∼ 3 in their TSP. Last, the extension of the 1D pretransional
fluctuations along c is much smaller for Ni than for Zn or Mg [42], whereas their decrease of TSP has exactly the
same doping level dependence.
Therefore, all these experimental results point out that the relevant parameter for the decrease of TSP through
doping is not the way the dimerization is affected along the chain direction, but perpendicular to it through the stabilization of the out-of-phase 3D dimerization pattern. This is supported by a major difference observed concern-ing the spatial extension of the perturbation of the dimer-ized regions when doping inside and outside of the Cu chains: Only one chain is affected for in-chain doping by Zn instead of three chains in the case of out-of-chain Si-doping [42]. This has provided Pouget et al. [42] with a simple model explaining the factor 3, between Si and Zn doping, in the respective decrease of TSP and in the
crit-ical concentration above which the SP LRO is destroyed. According to the present study, we can generalize this last
result concerning Zn to the other Cu substituents, Ni and Mg, which produce smaller local distortions. As concerns the Mn impurity, which leads to stronger distortions than Zn, the fact that TSP has the same concentration
depen-dence tends to show that Mn-doping affects only one Cu chain. Note that the furthest analyzed atomic distance probed by our EXAFS experiment is shorter than that to the next Cu on a neighboring chain (4.25 ˚A). In summary, the universality of the SP transition seems to be related to the transverse weakening of the dimerization which de-pends therefore essentially on the position of the impurity, outside or inside the chains.
Lastly, let us come back to the difference in the dis-tortions induced by different concentrations of the same impurity. The Ni-O(2) distance to the first neighbors in-creases more for 6% Ni than for 2% Ni doping with respect to the Cu environment. The higher doped compound, also, has a more disordered environment. It is interesting to note that these concentrations lie before and after the end of the TSP line, and on each side of the transition
from dimerized to uniform AF LRO. This result under-lines some influence of the disorder in the disappearance of the spin-Peierls phase.
6 Conclusion
In the present study, the EXAFS technique was used as a powerful probe of the local atomic arrangement around various impurities in the paramagnetic state of doped CuGeO3.
This technique has allowed us to quantify the distortions in the impurity environment, such as the modification of the shape of the O octahedron around the Cu site, and to evaluate the local modification of the angles and dis-tances relevant for the magnetic properties. An increase of the first neighbor distance to the Cu site was observed when substituting Cu by Ni, Zn and Mn, in this order. An elongation of the distances to the further neighbors was evidenced in the case of Mn-doping which thus produces the largest alteration among the Cu site impurities. The angle α of the Cu-O-Cu superexchange path leading to the AF J1interaction between Cu2+first neighbors was found
to decrease progressively when doping with Ni, then with Zn or Mn, and at last with Si. These results have allowed establishing the local weakening of the J1 interaction for
Ni/Cu substitution, its almost cancellation in the case of Mn/Cu substitution and, lastly, its change of sign for Si doping on the Ge site, leading to a small ferromagnetic coupling between each set of Cu pairs of two adjacent chains.
In a global scheme where each impurity is considered to release magnetic solitonic defects, an analysis of the structural distortions of the doped CuGeO3 in relation
with their magnetic properties could then be proposed. A good description of the magnetic behavior of Si-doped compounds is obtained calling upon ferromagnetic pairs of spins 1/2, which yields in particular a simple explana-tion for the renormalizaexplana-tion of TN for Si with respect to
Zn-doping. Another interesting consequence of this study concerns the Cu-site impurities for which the amplitude
of the structural distortion, rather than the magnetic mo-ment of the impurity, is found to be correlated to the variation of TN. This last result underlines the importance
of the structural distortions in the magnetic behavior of spin-Peierls doped compounds and opens the way to mod-els taking into account realistic structural parameters.
We would like to thank B. Canals, P. Monod, R. M´elin, D. Khomskii and N. Laflorencie for fruitful discussions.
References
1. M. Hase, I. Terasaki, K. Uchinokura, Phys. Rev. Lett. 70, 3651 (1993)
2. J.-P. Pouget, L.-P. Regnault, M. A¨in, B. Hennion, J.-P. Renard, P. Veillet, G. Dhalenne, A. Revcolevschi, Phys. Rev. Lett. 72, 4037 (1994)
3. M. Hase, I. Terasaki, Y. Sasago, K. Uchinokura, H. Obara, Phys. Rev. Lett. 71, 4059 (1993); S. B. Oseroff, S.-W. Cheong, B. Aktas, M. F. Hundley, Z. Fisk, L. W. Rupp, Jr., Phys. Rev. Lett. 74, 1450 (1995); Y. Ajiro, T. Asano, F. Masui, M. Mekata, H. Aruga-Katori, T. Goto, H. Kikuchi, Phys. Rev. B 51, 9399 (1995)
4. S. Coad, J. G. Lussier, D. F. McMorrow, D. McK. Paul, J. Phys.: Condens. Matter 8, 6251 (1996)
5. B. Grenier, J.-P. Renard, P. Veillet, C. Paulsen, G. Dhalenne, A. Revcolevschi, Phys. Rev. B 58, 8202 (1998) 6. J. -P. Renard, K. Le Dang, P. Veillet, G. Dhalenne, A. Revcolevschi, L.-P. Regnault, Europhys. Lett. 30, 475 (1995)
7. B. Grenier, J.-P. Renard, P. Veillet, C. Paulsen, R. Calem-czuk, G. Dhalenne, A. Revcolevschi, Phys. Rev. B 57, 3444 (1998)
8. B. Grenier, P. Monod et al., in preparation
9. S. Katano, O. Fujita, J. Akimitsu, M. Nishi, K. Kakurai, Y. Fujii, Phys. Rev. B 57, 10280 (1998)
10. M. Hiroi, T. Hamamoto, M. Sera, H. Nojiri, N. Kobayashi, M. Motokawa, O. Fujita, A. Ogiwara, J. Akimitsu, Phys. Rev. B 55, R6125 (1997)
11. Y. J. Wang, Y. J. Kim, R. J. Christianson, S. C. LaMarra, F. C. Chou, T. Masuda, I. Tsukada, K. Uchinokura R. J. Birgeneau, J. Phys. Soc. Japan 72, 1544 (2003)
12. T. Masuda, A. Fujioka, Y. Uchiyama, I. Tsukada, K. Uchi-nokura, Phys. Rev. Lett. 80, 4566 (1998); T. Masuda, I. Tsukada, K. Uchinokura, Y. J. Wang, V. Kiryukhin, and R. J. Birgeneau, Phys. Rev. B 61, 4103 (2000); T. Masuda, N. Koide, K. Uchinokura, Progress Theor. Phys. Suppl. 145, 306 (2002)
13. B. Grenier, P. Monod, M. Hagiwara, M. Matsuda, K. Katsumata, S. Cl´ement, J.-P. Renard, A. L. Barra, G. Dhalenne, A. Revcolevschi, Phys. Rev. B 65, 94425 (2002) 14. G. Castilla, S. Chakravarty, V. J. Emery, Phys. Rev. Lett. 75, 1823 (1995); J. Riera and A. Dobry, Phys. Rev. B 51, 16098 (1995); K. Fabricius, A. Kl¨umper, U. L¨ow, B. B¨uchner, T. Lorenz, G. Dhalenne, and A. Revcolevschi, Phys. Rev. B 57, 1102 (1998)
15. M. Nishi, O. Fujita, J. Akimitsu, Phys. Rev. B 50, 6508 (1994); L. P. Regnault, M. A¨in, B. Hennion, G. Dhalenne, A. Revcolevschi, Phys. Rev. B 53, 5579 (1996)
16. J. B. Goodenough, in Magnetism and the chemical bond (John Wiley and Sons, New York, 1963).
17. M. Braden, G. Wilkendorf, J. Lorenzana, M. A¨in, G. J. McIntyre, M. Behruzi, G. Heger, G. Dhalenne, A. Revcolevschi, Phys. Rev. B 54, 1105 (1996)
18. W. Geertsma and D. Khomskii, Phys. Rev. B 54, 3011 (1996).
19. M. Newville, P. Livins, Y. Yacoby, J. J. Rehr, E. A. Stern, Phys. Rev. B 47, 14126 (1993) ; S. I. Zabinsky, J. J. Rehr, A. Ankudinov, R. C. Albers, M. J. Eller, Phys. Rev. B 52, 2995 (1995) ; M. Newville, R. Ravel, D. Haskel, J. J. Rehr, E. A. Stern, Y. Yacoby, Physica B 208-209, 154 (1995) 20. H. V¨ollenkle, A. Wittmann, H. Nowotny, Monatsh. Chem.
98, 1352 (1967)
21. M. Braden, E. Ressouche, B. B¨uchner, R. Keβler, G. Heger, G. Dhalenne, A. Revcolevschi, Phys. Rev. B 57, 11497 (1998)
22. R. D. Shannon, Acta Cryst. A 32, 751 (1976)
23. H. H. Otto, M. Meibohm, Z. Kristallogr. 214, 558 (1999) 24. M. Baenitz, C. Geibel, M. Dischner, G. Sparn, F. Steglich, H. H. Otto, M. Meibohm, A. A. Gippius, Phys. Rev. B 62, 12201 (2000)
25. M. Weiden, R. Hauptmann, W. Richter, C. Geibel, P. Hell-mann, M. K¨oppen, F. Steglich, M. Fischer, P. Lemmens, G. G¨untherodt, A. Krimmel, G. Nieva, Phys. Rev. B 55, 15067 (1997)
26. H. Fukuyama, T. Tanimoto, M. Saito, J. Phys. Soc. Jpn. 65, 1182 (1996)
27. M. Fabrizio, R. M´elin, Phys. Rev. Lett. 78, 3382 (1997); M. Fabrizio, R. M´elin, Phys. Rev. B 56, 5996 (1997);M. Fabrizio, R. M´elin, J. Souletie, Eur. Phys. J. B 10, 607 (1999)
28. D. Khomskii, W. Geertsma, M. Mostovoy, Czech. J. Phys. 46, Suppl. S6, 3240 (1996); M. Mostovoy, D. Khomskii, Z. Phys. B 103, 209 (1997)
29. M. Mostovoy, D. Khomskii, J. Knoester, Phys. Rev. B 58, 8190 (1998)
30. E. Sorensen, I. Affleck, D. Augier, D. Poilblanc, Phys. Rev. B 58, R14701 (1998); A. Dobry, P. Hansen, J. Riera, D. Augier, D. Poilblanc, Phys. Rev. B 60, 4065 (1999); D. Augier, J. Riera, D. Poilblanc, Phys. Rev. B 61, 6741 (2000)
31. N. Laflorencie, D. Poilblanc, Phys. Rev. Lett. 90, 157202 (2003); N. Laflorencie, D. Poilblanc, A. W. Sandvik, Phys. Rev. B 69, 212412 (2004)
32. L.-P. Regnault, J.-P. Renard, G. Dhalenne, A. Revcolevschi, Europhys. Lett. 32, 579 (1995)
33. Y. Sasago, N. Koide, K. Uchinokura, M.C. Martin, M. Hase, K. Hirota, G. Shirane, Phys. Rev. B54, R6835 (1996) 34. B. Grenier, L.-P. Regnault et al., in preparation
35. K. Manabe, H. Ishimoto, N. Koide, Y. Sasago, K. Uchi-nokura, Phys. Rev. B 58, R575 (1998)
36. K. M. Kojima, Y. Fudamoto, M. Larkin, G. M. Luke, J. Merrin, B. Nachumi, Y. J. Uemura, M. Hase, Y. Sagaso, K. Uchinokura, Y. Ajiro, A. Revcolevschi, J.-P. Renard, Phys. Rev. Lett. 79, 503 (1997)
37. B. B¨uchner, U. Ammerahl, T. Lorenz, W. Brenig, G. Dhalenne, A. Revcolevschi, Phys. Rev. Lett. 77, 1624 (1996)
38. W. Geertsma, D. Khomskii, cond-mat/0007421
39. R. Werner, C. Gros, M. Braden, Phys. Rev. B 59, 14356 (1999)
40. H. Wolfram, H. H. Otto, M. Cwik, M. Braden, G. Andr´e, F. Bour´ee, M. Baenitz, F. Steglich, Phys. rev. B 69, 144115 (2004)
41. B. Grenier, L.-P. Regnault, J.E. Lorenzo, J. Voiron, J. Bossy, J.-P. Renard, G. Dhalenne, A. Revcolevschi, Eu-rophys. Lett. 44, 511 (1998)
42. J.-P. Pouget, S. Ravy, J.-P. Schoeffel, G. Dhalenne, A. Revcolevschi, Eur. Phys. J. B 38, 581 (2004)
43. B. Grenier, L.-P. Regnault, J.E. Lorenzo, J.-P. Renard, G. Dhalenne, A. Revcolevschi, Physica B 280, 313 (2000) 44. J.-P. Schoeffel, J.-P. Pouget, G. Dhalenne, A. Revcolevschi,