HAL Id: hal-02296400
https://hal.archives-ouvertes.fr/hal-02296400
Submitted on 6 Jan 2020
HAL is a multi-disciplinary open access
archive for the deposit and dissemination of sci-entific research documents, whether they are pub-lished or not. The documents may come from teaching and research institutions in France or abroad, or from public or private research centers.
L’archive ouverte pluridisciplinaire HAL, est destinée au dépôt et à la diffusion de documents scientifiques de niveau recherche, publiés ou non, émanant des établissements d’enseignement et de recherche français ou étrangers, des laboratoires publics ou privés.
Silver centers luminescence in phosphate glasses
subjected to X-Rays or combined X-rays and
femtosecond laser exposure
Théo Guérineau, Francesca Cova, Yannick Petit, Alain Abou Khalil,
Alexandre Fargues, Marc Dussauze, Sylvain Danto, Anna Vedda, Lionel
Canioni, Thierry Cardinal
To cite this version:
Théo Guérineau, Francesca Cova, Yannick Petit, Alain Abou Khalil, Alexandre Fargues, et al.. Silver centers luminescence in phosphate glasses subjected to X-Rays or combined X-rays and femtosec-ond laser exposure. International Journal of Applied Glass Science, Wiley, 2020, 11 (1), pp.15-26. �10.1111/ijag.13957�. �hal-02296400�
Silver centers luminescence in phosphate glasses subjected to X-Rays
or combined X-rays and femtosecond laser exposure
Théo GUERINEAU,1 Francesca COVA,2 Yannick PETIT,1,3 Alain ABOU KHALIL,3 Alexandre FARGUES,1 Marc
DUSSAUZE,4 Sylvain DANTO,1 Anna VEDDA,2 Lionel CANIONI3 and Thierry CARDINAL1
1 Université de Bordeaux, CNRS, ICMCB, UPR 9048, F-33608 Pessac, France
2 Department of Materials Science, University of Milano-Bicocca, 20125 Milan, Italy 3 Université de Bordeaux, CNRS, CEA, CELIA, UMR 5107, F-33405 Talence, France 4 Université de Bordeaux, ISM, CNRS, UMR 5255, F-33405 Talence, France
Abstract
The generation of silver species has been investigated in silver containing sodo-gallo-phosphate glasses
subjected to X-rays irradiations. Radio-luminescence spectroscopy has evidenced the presence of
isolated and paired silver ions. The proportion of silver pairing is found dominant in ortho-phosphate
glass compositions, compared to poly-phosphate counterparts. The phosphate glass network is
reported to have a decisive impact on the X-Ray photosensitivity and the formation of luminescent
silver species, namely Ag2+ hole trap silver ions and Ag
mx+ silver clusters. The subsistence of
femtosecond laser produced silver luminescent structures under X-Ray irradiation has been
demonstrated.
I.
Introduction
Radio-Photo-Luminescence (RPL) of silver-containing phosphate glasses has been studied
extensively since Schulman et al (1). Nowadays it is considered as a reliable radiation dosimetry
remains a hot topic as no clear unanimity has been established concerning the nature of the centers
responsible for the luminescence properties. During the irradiation process using ionizing radiations
such as X-Ray or gamma radiations, exciton pairs are released in the glass matrix and then are proposed
to recombine with the Ag+ silver ions, leading to the formation of electron and hole trapped silver
species, such as Ag0 and Ag2+ respectively (8). Subsequently to this phenomenon, clustering process (9)
may occur, then generating various silver clusters with a variety of charge and parity (10).
Recently, Direct Laser Writing (DLW) technique has offered new opportunities in silver containing
glass modifications for fabricating integrated devices. Indeed, supported by the Ag+ silver ions (11), the
Infra-red femtosecond (IR fs) DLW enables the generation of local properties such as fluorescence (12–
14), second (15,16) and third (17) order nonlinearities, plasmonic resonance (18,19) or localized
refractive index change (20,21). Unlike current commercialized RPL dosimeters, a silver ion content by
two-orders-of-magnitude higher is preferable for IR fs DLW. To our knowledge, no investigation
combining RPL and IR fs DLW has been conducted on such glasses. Depending on the [O]/[P]
Oxygen-to-Phosphorus ratio, the phosphate chain length can be described as a sequence of phosphorus
tetrahedron of four different kinds. To define them, the phosphate tetrahedron is expresses as a Qn
units (22,23), where n denotes the number of bridging oxygen between phosphorus elements and Q
the PO4 tetrahedron. The poly-phosphate glass exhibits long chains of Q2 entities while pyro- and
ortho-phosphate exhibit a majority of Q1 paired and Q0 isolated PO
4 tetrahedra, respectively.
Commonly conducted in silver-containing pyro-phosphate glasses, IR fs DLW has been also carried out
on both poly- and ortho-phosphate compositions in the system Na2O-P2O5-Ga2O3 to evaluate the glass
network influence on IR fs laser photosensitivity (12). We show that ortho-phosphate and
pyro-phosphate glass networks exhibit higher photosensitivity for fs DLW as compared to the
poly-phosphate glass.
In this paper, we report the impacts of X-rays irradiation of silver-containing ortho- and pyro-
phosphates in the glass system Na2O-P2O5-Ga2O3 (labelled as GPNo and GPNp glasses, respectively) in
time resolved luminescence spectroscopies have been conducted. Moreover, the impact of X-Rays
irradiation on IR fs DLW structures using micro-luminescence spectroscopy has been investigated.
II.
Experimental procedures
II-1. Glass preparation
From the ternary diagram P2O5-Ga2O3-Na2O, selected pyro and ortho-phosphate glass
compositions have been elaborated and doped with a fixed amount of silver oxide (2 mol%). Both
glasses were synthesized from H3PO4 (Roth, 85%), Na2CO3 (Alfa Aesar, 99.95%), Ga2O3 (Strem
Chemicals, 99.998%) and AgNO3 (Alfa Aesar, 99.995%) precursors. These precursors are all mixed into
a Teflon beaker in aqueous solution and dried on a sand bath during 12 hours. After a grind step, the
obtained powder was melted at 1050 °C and 1400 °C, respectively for the pyro and ortho-phosphate,
for 24 hours to optimize the Ag+ silver ions homogenization. To reduce the mechanical constraints,
glasses were annealed 30 °C below the glass transition temperature (Tg) for 4 hours, then cut and optically polished on both parallel faces.
II-2. Infrared femtosecond Direct Laser Writing (DLW)
Infrared (IR) femtosecond (fs) DLW were carried out with a KGW:Yb femtosecond oscillator (up to
2.6 W, 10 MHz and 390 fs FWHM at 1030 nm) combined with an acousto-optic modulator in order to
control the energy and number of pulses. The DLW structures were generated using a Zeiss microscope
objective (20x, 0.75 NA), focusing 160 µm below the glass surface. In order to eliminate spherical
aberrations, a spatial light modulator (LCOS; X10468-03, Hamamatsu Photonics) was used. The sample
positioning and displacements were performed with a 3D translation stage XMS-50, enabling a
precision up to 50 nm.
II-3. Radio-luminescence, radio-photo-luminescence and X-Rays irradiation
Radio-luminescence (RL) and radio-photo-luminescence (RPL) measurements were conducted
Milano-Bicocca. The setup consists of back-illuminated, UV-enhanced, liquid nitrogen-cooled CCD detector
(Jobin-Yvon Spectrum One 3000) coupled to a monochromator (Jobin-Yvon Triax 180). The RL
experiment consists in monitoring the emitted light during a continuous irradiation of a sample with
X-rays. For RL and RPL irradiations, a Philips PW2274 X-rays tube with tungsten anode (operating at
respectively 20 or 32 kV) was used. At these voltages, the bremsstrahlung process drives the X-rays
generation mechanism. The excitation laser diode was an export mod. LCS-DTL-374QT 355 nm
operating with the 3rd harmonic of a Nd:YAG laser (pulse width of 5 ns, repetition rate of 20 KHz and 5
mW power). A circular Al mask with a diameter of 5 mm limits the irradiated area allowing for a
quantitative comparison between samples (RL and RPL) and the localization of the X-rays irradiation
and laser probed area (mainly useful for the localized DLW induced structures during the RPL). The
dose values reported in the article for X-rays irradiations were obtained by comparison with a
calibrated 90Sr - 90Y beta radioactive source and using optically stimulated luminescence emission from
quartz crystalline powder (100 - 200 μm). For the X-rays induced optical absorption study, the samples
were irradiated with a Machlett OEG50 X-ray tube with tungsten anode, operating at 32 kV. Also in
this case, X-rays are produced by bremsstrahlung. Dose evaluation was performed by a PTW Duplex
calibrated ionization chamber.
II-4. Pristine glass characterization
Micro-Raman spectroscopy was conducted on both compositions at room temperature thanks to
a LABRAM 800-HR Raman spectrometer (Horiba Jobin-Yvon) with a single longitudinal mode laser
source at 532 nm, coupled with a microscope objective (50×, NA 0.75) assuring the micron-scale spatial
resolution. All spectra were recorded from 600 to 1400 cm-1 with a 2.5 cm-1 resolution.
UV-Visible transmission spectra were recorded with a Cary 5000 (Varian) spectrometer in the
range 200 – 800 nm with a step of 1 nm and an integration time of 0.1 s.
The refractive indices were measured at 589 nm with an Abbe refractometer enabling a precision
A Fisher scientific Sartorius YDK01 was used to performed the density determination by
Archimedes’ method at room temperature and by immerging the glasses in diethyl phthalate.
The glass transition temperature was determined by measuring the differential scanning
calorimetry on a Netzsch DTA 404 PC apparatus in DSC mode, on glass chunks in a Pt pan up to 650 °C
at a heating rate of 10 °C.min-1 and a precision of ±3 °C.
II-5. Post DLW/X-Rays irradiated glass characterization
The micro-luminescence was carried out with a LABRAM 800-HR spectrophotometer (Horiba
Jobin-Yvon) equipped with an Olympus microscope objective (100×, NA 0.9), a CW laser diode
excitation at 405 nm (100 mW, TEM00, OBIS, COHERENT) and a thermoelectric cooled CCD camera
(Synapse Model 354308). A correction function determined by two reference samples with broad
spectral emission was used to correct the recorded spectra.
The UV-Visible transmission spectra were recorded with the same apparatus as that for the
pristine glasses, in the same conditions. Note that the absorption spectra have been also collected over
the entire glass thickness after DLW and/or X-rays irradiations.
The excitation spectra were recorded with a SPEX Fluorolog-2 spectrofluorimeter (Horiba
Jobin-Yvon) at room temperature, equipped with a 450 W xenon lamp and a Hamamatsu R298
photomultiplier. The emission spectra were recorded at room temperature with an Edinburgh
Analytical Instruments M300 Monochromator, a Xe-900 lamp and an AMHERST SCIENTIFIC CORP. 4100
cooled PMT.
The lifetime results have been extracted from time-resolved spectroscopy. A Continuum Surelite
SL II-10 laser was used as a pulsed 355 nm excitation source (10 Hz, 70 mJ, 4-6 ns) followed by a half
wave plate and a polarized beam splitter in order to control the laser pulse fluence, ensuring that the
measurement behaves only as an excitation regime in a lifetime probing regime (and not in an
irradiance regime that would lead to a glass modifications). Emission spectra were recorded thanks to
a monochromator and a gated ICCD camera (Andor) being optically trigged by the pulsed UV laser.
III-1. Structural impact on X-Rays irradiated phosphate photosensitivity
The pristine glass properties of both selected silver-doped phosphate glasses have been measured.
Hereafter in Table 1 is reported their nominal glass composition, O/P ratio, density, refractive index,
and glass transition temperature.
Table 1 Glass compositions and various properties of the considered GPNp and GPNo glasses
Acronym
Nominal cationic composition (%)
O/P ratio Density (±0.005 g.cm-3) n589 (±0.005) Tg (±3 °C) PO5/2 GaO3/2 NaO1/2 AgO1/2
GPNp 56.0 28.0 14.0 2.0 3.4 3.15 1.566 497
GPNo 31.0 20.6 46.4 2.0 4.3 3.08 1.541 385
Considering the nominal cationic compositions, one observes that for a constant silver amount
the element percentages of the other compounds are shifting. The most important point lies in the
atomic ratios O/P, which is equal to 3.4 for the GPNp glass, typical of a pyro-phosphate (22), while it is
4.3 for the GPNo, typical of an ortho-phosphate network (23) accordingly with Brow et al.
nomenclature (22,23).
From a previous study (12), the glass network structure has been identified as a key point to
explain the variation in the silver-doped phosphate glass photosensitivity, while silver content was kept
the same. Hence, the Raman spectroscopy has been performed on the selected GPNp and GPNo glasses
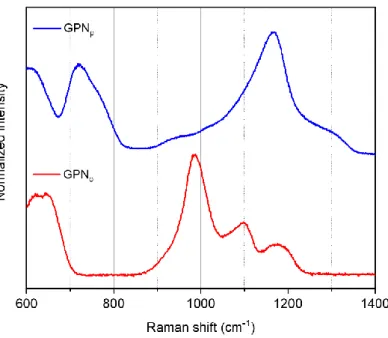
Figure 1 Normalized raw Raman spectra of GPNp and GPNo glasses
The Raman signature of GPNp (blue line) and GPNo (red line) glasses are presented in Figure 1.
The GPNp sample features major contribution bands centered at 710 cm-1, 740 cm-1 and 1160 cm-1. The
low frequency bands are assigned respectively to symmetric P-O-P bond stretching mode between two
Q2 phosphate tetrahedrons (22,24,25) and inside a phosphate tetrahedron dimeric entity (22,24–27),
while the high frequency band is related to (PO2-) symmetric stretching vibrations in Q2 (22,24,26,28).
These considerations are consistent with a majority of Q2 and Q1 phosphate entities. Meanwhile, the
GPNo glass exhibits low band intensities related to asymmetric (PO32-) vibrations of Q1 entities
(24,26,28) as well as symmetric and asymmetric stretching of the Q2 phosphate tetrahedron
(22,24,26,28) respectively peaking at 1100 cm-1, 1170 cm-1 and 1200 cm-1. While the main contributions
at 640 cm-1 and 980 cm-1, respectively assigned to [GaO
4]- stretching vibrations (24–26,29–31) and
symmetric (PO43-) stretching in Q0 phosphate entity (22,24) emphasizes a majority of Q0 phosphate
entities surrounded by sodium ions or gallium in tetrahedral sites [GaO4]-.
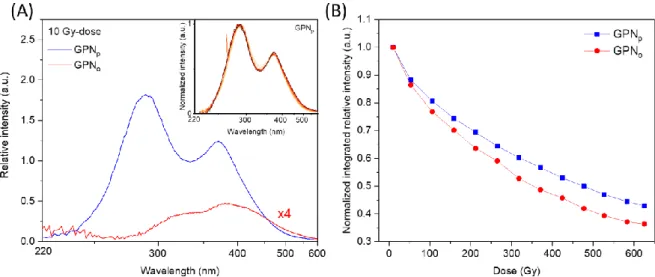
The radioluminescence measurements (RL) on the GPNp and GPNo glasses have been
performed at a fixed dose rate while recording the emission spectra every 30 seconds, i.e. for
subsequent cumulative doses. The RL spectra corresponding to an X-rays dose of 10 Gy are presented
phosphate network leading to radiative emissions specific of the Ag+ silver ions. One emission band is
observed with two contributions centered at 290 nm and 380 nm for the GPNp glass (Figure 2A – blue
curve) and only one at 380 nm for the GPNo glass (Figure 2A – red curve). The emission at 290 nm is
attributed to isolated Ag+ silver ions and more precisely to the dipolar electric transition 4d10 → 4d9
5s1. When two Ag+ silver ions are close enough, their atomic orbitals are slightly modified leading to
the observable emission at 380 nm, such as the silver dimer Ag+-Ag+ observed in crystalline compounds
under UV excitation (32). An experimental artefact at about 350 nm is present with a low emission
intensity, which distorts the spectral distribution homothetically with the XR dose increase. The inset
depicts the RL spectra from 10 to 625 Gy, normalized for the GPNp glass. As the spectral shape remains
perfectly constant for both glasses, the relative intensity has been integrated over the entire spectrum
for the GPNp sample, and from 275 to 600 nm for the GPNo, and then normalized to the first integrated
spectrum intensity. The resulting intensity evolution versus the X-rays dose is presented in Figure 2B.
Both glasses present an intensity decrease by dose increasing, which is more pronounced for the
ortho-phosphate glass.
Figure 2 (A) Radioluminescence spectra for both GPNp (blue curve) and GPNo (red curve) glasses (inset: normalized GPNp RL spectra from 10 to 625 Gy-doses. Note that the higher X-rays doses lead to the weaker normalized emission, as detailed
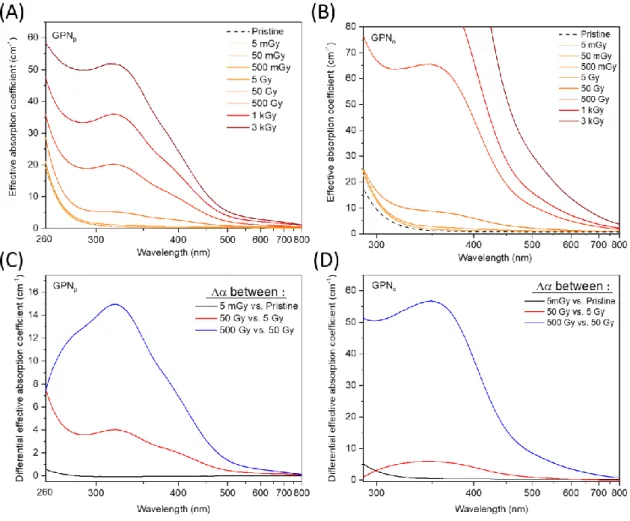
The effective linear absorption coefficient (α) of both glasses is depicted in Figure 3A (GPNp)
and Figure 3B (GPNo) after an X-rays irradiation series from 5 mGy to 3 kGy. The GPNp and GPNo pristine
glasses do not present absorption above 300 nm. While increasing the X-rays dose, new absorption
band contributions appear and grow with a maximum at about 320 nm for GPNp and 360 nm for GPNo,
respectively. To better identify and track changes in the band contributions, the absorption coefficient
difference spectra between 5 mGy dose versus unirradiated samples, 50 Gy versus 5 Gy dose, and 500
Gy versus 50 Gy dose samples for both studied GPN glasses have been performed as depicted in Figure
3C and Figure 3D. For the 5 mGy vs. Pristine difference spectrum of the GPNp glass, a shoulder below
260 nm is revealed. This shoulder increases at higher X-rays doses such as in the 50 Gy vs. 5 Gy dose
difference spectrum with complementary contribution bands at 320 and 390 nm.
Both absorption bands grow for 500 Gy vs. 50 Gy dose difference spectrum with an additional 290
nm-contribution band. For the GPNo glass, the absorption contributions evolve differently. First, for the 5
mGy vs. Pristine dose difference spectrum, one band shoulder is observed below 300 nm. By increasing
X-rays irradiation, the 50 Gy vs. 5 Gy dose difference spectrum highlights two main contributions at
320 and 350 nm, determined from a Gaussian fitting. For higher dose such as in the 500 Gy vs. 50 Gy
Figure 3 Radiation induced absorption spectra for GPNp (A) and GPNo (B) after various X-rays irradiation doses from 5 mGy to 3 kGy. The difference absorption coefficient spectra for 5 mGy vs. Pristine, 50 Gy vs. 5 Gy and 500 Gy vs. 50 Gy in both
glass compositions is shown in (C) and (D), respectively.
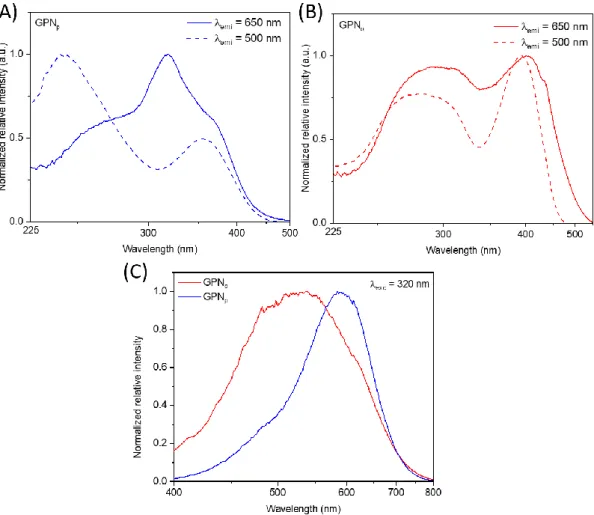
The luminescence on each irradiated glass, for both glass compositions, has been performed at
various excitation and emission wavelengths. The 650 nm and 500 nm excitation spectra, as well as
the 320 nm emission spectra, are displayed in Figure 4 for both GPN glasses after a 500 Gy-dose
irradiation. This specific dose has been selected in order to have a good compromise of the pristine
and irradiated glass luminescence properties in both glass compositions. For an excitation at 320 nm
(Figure 4C), the GPNp glass exhibits a main emission band at 600 nm with a shoulder at about 500 nm,
while for the same excitation, the GPNo glass displays only one broad emission in the entire visible
range centered at 520 nm. Considering the emission spectra at 650 nm (Figure 4A), the GPNp glass
the excitation bands are located at about 240 nm and 355 nm. Meanwhile, for the GPNo glass (Figure
4B), the red excitation spectrum highlights a broad band at 280 nm and a narrower one at 420 nm,
while for the visible range excitation spectrum, the two latter bands are shifting at 290 nm and 390 nm
respectively. The lifetime of the red and visible range emissions has been extracted from time-resolved
spectroscopy experiments for GPNp and GPNo glasses under 355 nm excitation. In both glass
compositions, the red emission centered at 600 nm is characterized by a 3 µs lifetime, while the visible
range luminescence has a lifetime of about 5 ns.
Figure 4 Luminescence of both GPN glass compositions after a 500 Gy-dose irradiation. Excitation spectra at 650 nm and 500 nm for GPNo (A) and GPNp (B) glasses. (C) Emission spectra for both glasses under an UV excitation at 320 nm.
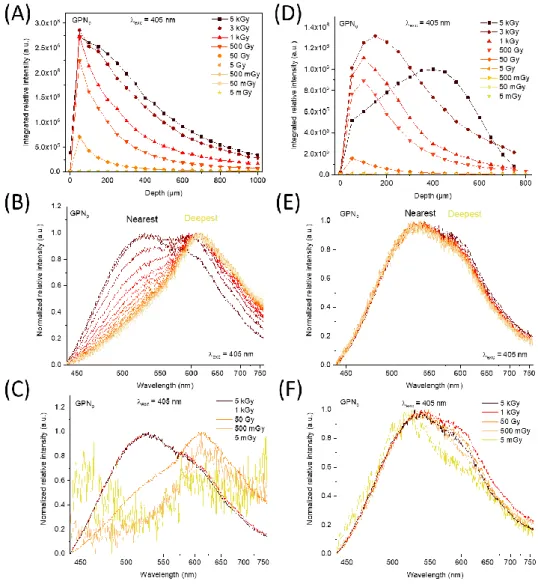
Moreover, micro-luminescence measurements have been performed on the lateral edge of
the glass, perpendicularly to the front X-rays irradiated face. Such lateral face had been optically
spectra were recorded, over a typical glass thickness of 1 mm, every 50 µm over a linear edge-to-edge
cartography in both GPN glasses irradiated from 5 mGy to 5 kGy. Each cartography started few tens of
microns prior to the glass edge, such initial lateral position corresponding to the 0 µm-depth. The
evolution of the integrated spectral distribution in the entire spectrum at lateral position,
corresponding to each depth of X-rays irradiation, is reported on Figure 5A (GPNp) and 5D (GPNo) for
all X-rays doses. Figures 5B and 5E depict the spectral distribution evolution for a 500 Gy-dose at
several depths while Figure 5C and 5F display it for a 50 µm-depth at several doses, for both GPN
glasses. First, for the GPNp glass, the integrated luminescence intensity increases with the dose. For
the two highest doses, the intensity decrease does not drop as fast as for the other doses on first
hundreds of micron. Meanwhile, at a given dose the intensity profile exhibits a general decrease, which
naturally results from the X-rays attenuation during in-depth glass penetration (Figure 5A). As
observed in Figure 5B, the spectral distribution is changing from the surface up to the deepest
measured point. The nearest-from-the-surface recorded spectrum shows a wide band from 440 nm to
760 nm centered at about 520 nm. The deeper, the more red-shifted is the maximum intensity
position. For the deepest spectrum, the maximal intensity peaks now at 620 nm. The spectral
distribution evolution at a fixed depth of 50 µm has also been studied as depicted in Figure 5C. For the
highest doses (1 and 5 kGy), the main contribution is centered at around 520 nm while for the lowest
dose the weak luminescence spectrum peaks at around 620 nm. For the GPNo glass, the integrated
relative intensity evolution as function of the depth is presented on Figure 5D. Up to 50 Gy, the same
intensity profile as in the GPNp glass is observed. From 500 Gy to 5 kGy, the highest integrated intensity
is no longer located near the front irradiated surface but rather moves towards the glass bulk. After
this maximum, the integrated intensity declines with the depth. As observed on Figures 5E and 5F
whether at fixed 500 Gy-dose or 50 µm-depth, the spectral distribution does not present any significant
Figure 5 Micro-luminescence of irradiated GPN glasses performed on the glass optically polished side: (A),(D) integrated relative intensity, (B),(E) normalized spectrum evolution for the 500 Gy-dose and (C),(F) 50 µm-depth for the GPNp and GPNo
glass compositions, respectively.
III-2. Investigation of the resilience to X-rays of IR fs DLW generated structures
A large 3×3 mm2 square has been pre-inscribed by IR fs DLW at 160 µm below the GPN p glass
surface using an experimental procedure described elsewhere (12). Two different laser parameters
were used in two identical GPNp glass samples, corresponding to high and low DLW dose depositions
(11). Both DLW depositions lead to a luminescence being dominated by the silver clusters Agmx+ (33)
The respective laser parameters correspond to an irradiance of 13.4 TW.cm-2 for a sample
of 250 µm.s-1. All-in-one radio-photo-luminescence (RPL) experiments (combining an X-rays irradiation
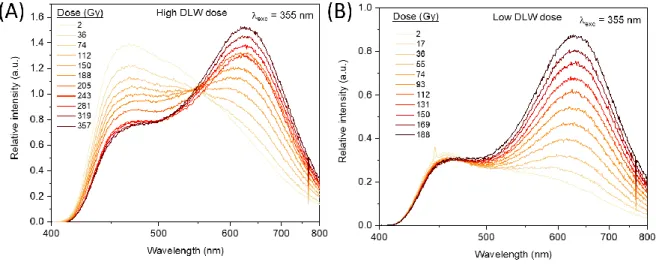
and UV excitation at 355 nm) have been carried out on the fs laser inscribed samples. The RPL spectra
were recorded every 10 seconds at a fixed dose rate of 0.2 Gy.s-1 for X-rays doses spanning from 2 Gy
up to 188 Gy for the low DLW dose, and up to 376 Gy for the high DLW dose, as reported in Figure 6A
and 6B respectively. Both samples present a wide band luminescence centered at 460 nm with a
shoulder at around 620 nm. While increasing the X-rays dose, one observes that both samples act
differently in terms of emission profiles. For the high DLW dose glass, the 460 nm-luminescence loses
about half of its original intensity, while a 630 nm luminescence band appears and increases to become
predominant beyond a dose of 112 Gy (Figure 6A). For the low DLW dose glass, the 630 nm
luminescence band overcomes substantially the emission band at 460 nm after few tens of Gy (Figure
6B), while the 460 nm band remains stable all along the RPL experiment.
Figure 6 Radio-photo-luminescence measurement of the GPNp glass in which two square structures are generated by IR femtosecond direct laser writing at (A) high and (B) low laser dose.
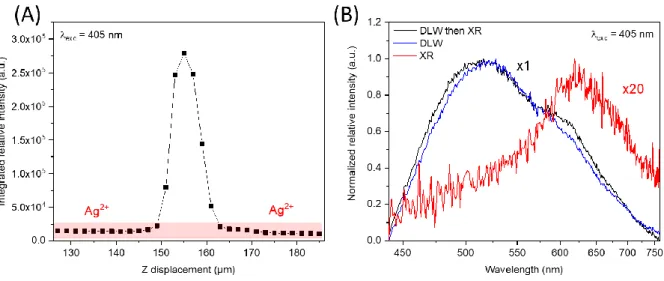
To evaluate the effect of X-rays irradiation on the DLW luminescent structures, a
micro-luminescence measurement under a laser diode excitation at 405 nm has been performed after the
X-rays irradiation on a fresh optically polished glass edge in order to intersect the DLW structure, on both
high and low dose laser written samples. The emission spectra were recorded every 2 µm during a
linear cartography. The intensity profile of integrated spectral distribution for the higher DLW dose are
centered at 630 nm, corresponding to the XR red curve on the Figure 7B. While approaching the
femtosecond produced structures, the intensity profile increases sharply, with a corresponding 520
nm-luminescence (black curve – Figure 7B) characteristic of the Agmx+ silver clusters. The DLW structure
luminescence before X-rays irradiation has been added in the Figure 7B in order to compare the
spectral distribution, which corresponds to the DLW blue curve.
Figure 7 Linear micro-luminescence cartography under a 405 nm excitation of the GPNp glass after a high DLW dose. (A) Intensity profile evolution over the glass depth. (B) Spectral distribution of the high DLW dose luminescence before RPL
experiment corresponding respectively to blue and black curve. The red curve is related to the luminescence recorded outside of the DLW structure after X-Rays irradiation.
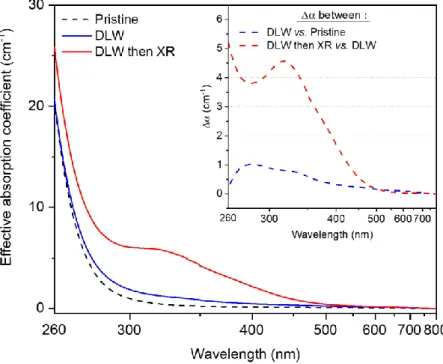
In Figure 8, the effective absorption coefficient has been measured and calculated for the GPNp
sample before any type of irradiation (dashed black curve), after the IR fs DLW inscription with Agmx+
(blue curve) and then irradiated during the RPL experiment up to a dose of about 400 Gy (red curve).
Note that such effective absorption coefficient is estimated by taking into account the full thickness of
the glass sample, while the highly absorbing silver clusters only spread over thickness of 5 to 10 µm.
Amplitudes and profiles of the relative graphs in Figure 8B should be considered with caution. Indeed,
the two resulting difference spectra between each experiment are depicted in the inset: respectively
blue dashed curve corresponding to DLW structure vs. pristine glass and red dashed curve
structure vs. pristine glass differential absorption spectrum, two bands at 280 nm and 340 nm are
noticeable. The DLW structure after and before X-rays irradiation differential spectrum shows an
important band at 320 nm with an additional shoulder at 380 nm and tail below 300 nm.
Figure 8 Effective absorption coefficient on pristine GPNp glass, after high dose IR fs DLW and then irradiated by X-rays during RPL experiment. Inset shows the respective difference spectrum for DLW structure vs. pristine glass and X-rays
exposure in the location of the DLW structure vs. DLW structure.
IV.
Discussion
IV-1. Structural impact on X-rays irradiated phosphate photosensitivity
As described elsewhere (12), the increase of Na+ sodium ion content in silver-doped GPN glasses
leads to a progressive increase of the Oxygen-to-Phosphorus ratio, which is a good indicator of the
glass structure (ultra-, poly-, pyro- or ortho-phosphate). However, acting as a network modifier, Na+
sodium ions shrink the phosphate chains, which then decreases the glass durability. This aspect could
be compensated by an increase of the Gallium content, since Masera et al. (34) have demonstrated an
modification affects the glass properties such as density, refractive index, glass transition temperature,
as reported in Table 1.
The Raman spectral response of the GPNp, highlighting symmetrical stretching vibrations of P-O-P
bonds and (PO2-) tetrahedron in Q2 and Q1 entities, indicates that GPNp glass acts as a poly-phosphate
and pyro-phosphate. However, with an O/P = 3.4 ratio closer to pyro-phosphate (O/P = 3.5) compared
to poly-phosphate (O/P > 3), the GPNp glass is considered as a pyro-phosphate. Meanwhile in the GPNo
glass, the absence of the P-O-P bonds spectral signature, as well as the presence of the (PO43)
symmetrical stretching vibrations, emphasizes an ortho-phosphate network behavior (O/P > 4) (23).
Regarding the 640 cm-1 band contribution related to [GaO
4]- stretching vibration in both studied
glasses, one observes a higher intensity in GPNo glass than in the GPNp. Indeed, previous observation
could be explained by the intermediate role of the Gallium shifting from an octahedral site to a
tetrahedral one when the Gallium-to-Phosphorous ratio is increasing (24,35), which is the case from
GPNp (Ga/P ratio = 0.5) to GPNo (Ga/P ratio = 0.66) glasses. This phenomenon results in a covalent
compensation of the depolymerized phosphate chains, which in turn strengthens the glass network
(26,35).
The radioluminescence experiment in silver-doped phosphate glass is a powerful tool as it allows
for following the emission evolution under X-rays irradiations. Tanaka et al. reported a luminescence
study in many silver-doped phosphate glasses (36), and one of them containing Al2O3 allows for a
reasonable comparison with GPN glasses. The silver luminescence (excitation and emission) decline is
observed while increasing the X-rays dose, supported by either silver ion consumption, competitive
absorption due to X-rays-generated species, or possibly both. Here, in Figure 2A, we report also a
luminescence decrease with the X-rays dose, which is in good agreement with previous study from
Tanaka et al. The RL experiment combining excitation and irradiation allows for a silver consumption
tracking, as observed in Figure 2B. The RL spectral distribution being homothetic at various doses
(Figure 2A - inset), the isolated silver ions Ag+ (λ
emi = 290 nm) and silver pairings Ag+-Ag+ (λemi = 380 nm)
silver-based entities can be detected. This observation could be interpreted as isolated and paired silver ions
act as a same silver reservoir, giving rise to the simplified X-rays irradiation process denoted as:
[Ag+] + hν
XRay → Ag2+ + Ag0
The one-phase exponential decay mathematical expression of the silver reservoir [Ag+] consumption.
derives from the Beer-Lambert law (9) applied on Figure 2B is:
𝐼(𝑡)
𝐼(0)= exp(−𝑟𝑐∗ 𝑡) + 𝑦𝑜 (1)
Where 𝐼(𝑡) is the dose-dependent transmitted intensity, 𝐼(0) is the initial relative intensity, 𝑟𝑐 is the
consumption rate, 𝑡 the irradiation time and 𝑦𝑜 is an offset. The determined consumption rates for
both GPNp and GPNo glasses, assuming a limited effect of absorbing XR-produced species, are
respectively of 0.0028 ±0.0002 s-1 and 0.0033 ±0.0002 s-1. A 1st-order kinetic would indicate then that
a constant proportion of the silver reservoir is consumed per unit of dose (or time).
As previously mentioned in the silver reservoir consumption, a one-phase exponential association
mathematical expression derived from the Beer-Lambert law can be considered to model for the
hole-trap center Ag2+ formation (Figure 5A) in GPN
p glasses in the case of high DLW dose:
𝐼(𝑡) = 𝑌𝑏+ 𝐴(1 − exp(−𝑟𝑓∗ 𝑡)) (2)
Where 𝐼(𝑡) is the relative intensity, 𝑌𝑏 is a baseline, 𝐴 is a coefficient function of the initial quantity of
Ag2+ generating species, 𝑟
𝑓 is the Ag2+ formation rate and 𝑡 is the irradiation time. From this equation
(2), the formation rate 𝑟𝑓 has been extracted and is set to 0.0033 ±0.0007 s-1.
Considering the X-Rays irradiated GPN glasses in term of effective absorption coefficients
(Figure 3A and 3B) and the GPNp excitation/emission spectra (Figure 4), the main 620 nm emission
band is related to the absorption/excitation bands peaking at 280 nm, 320 nm and 380 nm. The
associated lifetime is around 3 µs and it corresponds to Ag2+ hole-trap silver species detected by EPR
(not shown here) (5,6). In the GPNp 500 Gy vs. 50 Gy differential absorption spectrum (Figure 3C), the
band intensity ratio between contributions at 280 nm and 320 nm is noticeably different in comparison
to the one in the 650 nm excitation spectrum. Such discrepancy may be related to the presence of
Agmx+ silver clusters (14). The corresponding absorption range is from 280 nm to 500 nm. Finally, the
formation of silver clusters is favored under X-rays irradiation in the GPNo ortho-phosphate glass
matrix, as compared to that of the GPNp pyro-phosphate glass.
In the GPNp glass, the spectral distribution evolutions with the dose or the depth (respectively
Figure 5B and 5C) indicate that the Ag2+ hole-traps are first formed for the lowest doses, whereupon
the silver clusters appear solely at a sufficient X-rays dose. Meanwhile in the GPNo glass, the clusters
are formed from the very first X-rays doses while a weak emission of Ag2+ is measured. As observed in
Figure 5D, the intensity increasing feature in the first tens or hundreds of microns, depending of the
X-rays dose, correlatively goes hand to hand with an increase of a competitive absorption phenomenon
which could be related to the presence of non-luminescent electron traps such as Ag0 (Figure 3B) (4,8).
IV-2. Investigation of the resilience to X-rays of IR fs DLW generated structures
At first glance, during the RPL process a significant increase of the Ag2+ luminescence overlays the
DLW silver clusters luminescence. Nevertheless, there is no evidence of any partial destruction of the
laser written silver clusters. Accordingly to Figure 8, for excitation at 355 nm, the decrease of the silver
cluster emission at 460 nm (Figure 6A) seems to be related to a competitive absorption of exciton-trap
species such as Ag2+ or Ag0 (instead of a reduction of the silver cluster population).
The micro-luminescence experiment on the laser inscribed square structure in the GPNp glass
suggests then that the silver clusters luminescence survives to an X-rays irradiation of at least 357 Gy.
This resilience is strongly supported by the conservation of the Agmx+ localization (Figure 7A) and
emission spectral distribution (Figure 7B).
V.
Conclusion
This work has investigated the structural impact of pyro- and ortho- silver-containing
sodo-gallo-phosphate glasses subject to X-rays irradiations. The shortening of sodo-gallo-phosphate tetrahedra connectivity
influences the nature of the silver ionic species initially present in the glass, resulting in the increase of
generated by X-rays irradiation, namely Ag2+ hole trap silver ions and Ag
mx+ silver clusters, are clearly
identified and point out an improved ability of the silver ions to capture the electron and hole in the
ortho-phosphate glass. Second part of this study has been focused on the subsistence of the fs laser
written structures, which has been validated for the first time for X-rays irradiation up to a 357
Gy-dose.
Acknowledgement and support
The authors acknowledge Angelo Monguzzi for providing the 355 nm Nd:YAG laser allowing the real
time RPL measurement. This work has been carried out in the frame of the EIT SPARK Project (16290),
by the French National Research Agency (ANR-17-CE08-0042-01), “the investments for the future”
Programme IdEx Bordeaux – LAPHIA (ANR-10-IDEX-03-02) and the Region “Nouvelle Aquitaine” in the
frame of the FabMat project (2016-1R10107).