Detecting weak public transport connections
from cellphone and public transport data
The MIT Faculty has made this article openly available.
Please share
how this access benefits you. Your story matters.
Citation
Thomas Holleczek, Liang Yu, Joseph Kang Lee, Oliver Senn,
Carlo Ratti, and Patrick Jaillet. 2014. Detecting weak public
transport connections from cellphone and public transport data.
In Proceedings of the 2014 International Conference on Big Data
Science and Computing (BigDataScience '14). ACM, New York, NY,
USA, 8 pages.
As Published
http://dx.doi.org/10.1145/2640087.2644164
Publisher
Association for Computing Machinery (ACM)
Version
Author's final manuscript
Citable link
http://hdl.handle.net/1721.1/101682
Terms of Use
Creative Commons Attribution-Noncommercial-Share Alike
!
!
!
!
!
!
!
!
!
!
!
!
!
!
!
!
!
!
!
!
!
!
!
!
!
!
!
!
!
!
This paper might be a pre-copy-editing or a post-print author-produced .pdf of an article accepted for publication. For the definitive publisher-authenticated version, please refer directly to publishing house’s archive system.
Detecting weak public transport connections from
cellphone and public transport data
Thomas Holleczek
SingTel Singapore[email protected]
Liang Yu
A*STAR Singapore[email protected]
Joseph Kang Lee
University of British Columbia Vancouver, Canada
[email protected]
Oliver Senn
Singapore-MIT Alliance for Research and Technology
Singapore
[email protected]
Carlo Ratti
Massachusetts Institute of Technology Cambridge, MA[email protected]
Patrick Jaillet
Massachusetts Institute of Technology Cambridge, MA[email protected]
ABSTRACT
Many modern and growing cities are facing declines in public transport usage, with few efficient methods to explain why. In this article, we show that urban mobility patterns and transport mode choices can be derived from cellphone call detail records coupled with public transport data recorded from smart cards. Specifically, we present new data mining approaches to determine the spatial and temporal variabil-ity of public and private transportation usage and transport mode preferences across Singapore. Our results, which were validated by Singapore’s quadriennial Household Interview Travel Survey (HITS), revealed that there are 3.5 million public and 4.3 million private inter-district trips (HITS: 3.5 million and 4.4 million, respectively). Along with classify-ing which transportation connections are weak, the analysis shows that the mode share of public transport use increases from 38 % in the morning to 44 % around mid-day and 52 % in the evening.
Categories and Subject Descriptors
H.4 [Information Systems Applications]: Miscellaneous
General Terms
Public transport, private transport, clustering, cellphone call detail records
1. INTRODUCTION
Securing public transportation ridership is critical for devel-oping a sustainable urban future. However, existing systems for analyzing and identifying weaknesses in public trans-port connections face major limitations. In cities, origin-destination (OD) matrices—which measure the flow of peo-ple between di↵erent geographical regions—are often
gen-erated using household surveys and roadside monitoring, approaches which are time consuming, expensive, and lack spatial and temporal accuracy [9]. Focus in more recent research has been drawn towards using cellphones to over-come the limitations mentioned above—using the cellphone fluctuations in GSM signal strength [18, 7, 8] and location, speed, and acceleration estimates obtained through GPS [16, 21, 19] to detect individual trips and categorize them into classes such as walking, cycling, public transport and driving a car. These approaches are indeed innovative and capture in detail individual travel behavior, but are limited by their sample sizes (e.g. number of volunteers) and currently face difficulties scaling up. While these methods will continue to be valid sources of data and insight, there are emerging op-portunities to analyze urban transportation networks using data mining approaches, specifically in using cellphone call detail records to detect spatio-temporal patterns in urban mobility and transport mode preferences.
As cities not only become denser but also more extensive, there is an increasing pressure to maintain the connectiv-ity and accessibilconnectiv-ity of goods and services through public transportation networks and integrated urban design. How-ever, despite operating highly e↵ective public transporta-tion systems, modern and growing cities such as Singapore are facing declines in public transport usage; local govern-ments and city planners are often equipped with few tools to explain where and why such declines are occurring [11]. Given that cities are becoming increasingly digitized and with the pervasiveness of cellphones, new data-driven meth-ods are surfacing to help understand and explain charac-teristics of urban mobility [20, 17, 9, 10, 13, 15]. Unlike previous work, we derive the mode share of public and pri-vate transportation (including taxis) by examining multiple datasets, namely cellphone call detail records and a public transportation smart card system.
In this article, we use 3.4 million cellphone users’ call detail records to derive the inter-district (55 districts) mobility of people in the dense, metropolitan city-state of Singapore. We then subtract the number of Singapore’s public trans-portation smart card system users from our calculated value of urban mobility to estimate the share of private
trans-portation users between districts. By examining the spatial and temporal patterns of public and private transportation, we can determine to and from where people prefer to take public or private transit and furthermore classify the time periods and the districts that may be considered weakly con-nected by public transportation. Ultimately, we present a novel method of using cellphone data to map the mobility of people in cities and posit that its application can not only benefit urban transportation and planning e↵orts but also other domains focused on or a↵ected by the movement of people across space.
2. DATASETS
We use cellphone call detail records and a public transport dataset to estimate the flows of people using public and pri-vate transport between the 55 administrative districts of Sin-gapore.
2.1 Cellphone dataset
The cellphone dataset consists of location data of 3.4 million anonymized users of SingTel, Singapore’s largest telecommu-nications company with a market share of 45.3 %. The data were recorded during a two-month period from mid-March to mid-May 2011. A call detail record (CDR) includes the location of the cell tower each cellphone connects to and was created by the billing system of SingTel in the case of following network events:
• a phone call was initiated or received (at the beginning and at the end of the call).
• a short message was sent or received.
• the cellphone user accessed the data network (for ex-ample, to open a website or retrieve emails).
There is no information about handovers between base sta-tions during long phone calls. Logging in and out of the cellphone network was also not recorded.
We use the location of the base station a cellphone connects to as the location of a cellphone user and estimate the lo-calization error as follows. The average service radius of a base station is approximately r = 212 m. Due to confiden-tiality of the data, the locations of the base stations were o↵set by a maximum of 200 m. This leads to an average uncertainty radius of 412 m for the location estimation of cellphones. However, the cellphone might not always con-nect to the closest base station (for example, if the closest base station is busy), which can further increase the local-ization error. A study by Ferris et al. [12] shows that the median localization error can be reduced to 128 m with the help of Gaussian processes when considering the received GSM signal strength as well. The received signal strength is, however, not included in our dataset.
The location of a cellphone is only recorded in the case of the network events listed above, which means that subscribers using their cellphone frequently can be tracked more pre-cisely. To measure how frequently cellphone subscribers ac-cess the cellular network, we introduce the network inter-event time. Let t = [t1, t2, . . . tn] be the timestamps of the
0 500 1000 1500 2000 0 2 4 6 8 10 12 14x 10 5
inter−event time [min]
distribution
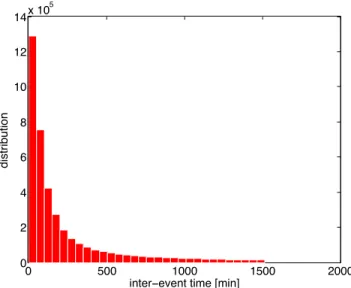
Figure 1: To measure how frequently cellphone sub-scribers access the cellular network, we introduce the network inter-event time. The average inter-event time for the entire dataset is 320 min. The first quartile of the inter-event time is ⌧25 = 41 min, the median is ⌧50 = 114 min and third quartile is ⌧75= 406 min.
network events related to the cellphone subscriber ↵. We then define the network inter-event time ⌧↵of ↵ as
⌧↵= 1 n 1 n X i=2 (ti ti 1). (1)
We determined the distribution of the inter-event time. The average inter-event time for the entire dataset is 320 min. The first quartile of the inter-event time is ⌧25= 41 min, the median is ⌧50= 114 min and third quartile is ⌧75= 406 min. The distribution of the inter-event time is shown in Figure 1. To show that the cellphone dataset is representative of Sin-gapore, we compare the distribution of the home locations of SingTel customers with official census data from 2010 [1]. Call detail records accumulate at home and work locations as these are the places where people spend most of their time [14]. To determine these clusters of call detail record locations, we apply the K-means clustering algorithm to the recorded locations of each subscriber, searching for at most K = 10 clusters. Next, we remove those location points from each cluster that are farther than 1.0 km away from the respective centroid to make sure that no outliers are as-signed to clusters. Finally, we have to find home and work locations among the identified clusters. If the majority of call detail records in a particular cluster occurs between 6 pm and 6 am, we consider that cluster to be a potential home location. Otherwise, that cluster is assumed to be a potential work location. Among all potential home (work) locations of a cellphone subscriber, we consider the cluster with the most call detail records to be the real home (work) location.
people/district 103.6 103.7 103.8 103.9 104 104.1 longitude [deg] 1.15 1.2 1.25 1.3 1.35 1.4 1.45 1.5 latitude [deg] 0 20000 40000 60000 80000 100000 120000
Figure 2: Population (number of home locations) per district determined from the SingTel dataset.
0 0.5 1 1.5 2 2.5 3 x 10⁵ 0 1 2 3 4 5 6 7 8 9 10x 10 4 population (census) population (SingTel)
Figure 3: Population in Singapore’s districts accord-ing to the 2010 census versus the population deter-mined from the SingTel dataset. With a correlation coefficient of 0.94, the two distributions are highly linearly correlated.
Singapore is divided into 55 administrative districts [4]. We determine the population of SingTel customers in these dis-tricts based on the identified home locations (see Figure 2) and compare the results with the 2010 census data [1]. With a correlation coefficient of 0.94, the two distributions are highly linearly correlated (see Figure 3).
2.2 Public transport dataset
The public transport dataset consists of trips made by 4.4 million anonymized users of Singapore’s public transport system during a two-week period in April 2011, which over-laps with the recording period of the cellphone dataset. As mentioned earlier on, we consider taxi trips as private rather than public transport in this study. In Singapore, passengers use smart cards when getting on and o↵ trains and buses [5]. The smart card system records the station and the time of departure and arrival for each trip. Single trips from the same passenger within a certain short period are merged as
a combined trip which reflects the actual origin-destination pair.
3. APPROACH
The flow of people between di↵erent geographical regions R ={r1, r2, . . .} in a given time interval is commonly repre-sented through a quadratic origin-destination (OD) matrix A(ts, te). Ai,k(ts, te) counts the number of trips from re-gion ri to region rk that arrive in the time interval [ts, te]. OD matrices can be aggregated and normalized over time, for example to get hold of the average number of trips on Mondays between 6 and 9 in the morning. We determine origin-destination matrices of Singapore on an hourly ba-sis and average them over all workdays covered by the two datasets.
The flows of people can be partitioned into flows by public and by private transport, as people travel either by a private car (including taxis) or by the public transport system. That means, the overall mobility Asingapore in Singapore can be decomposed into the OD matrix Apublic containing trips by public transport and the OD matrix Aprivatecontaining trips by private transport:
Asingapore= Apublic+ Aprivate. (2)
As geographical regions, we use the 55 administrative dis-tricts of Singapore. We estimate the overall mobility A⇤singapore in Singapore by upscaling the OD matrix Asingtel derived from the cellphone dataset (see 3.1) and determine the ac-curate public transport OD matrix Apublic from the public transport dataset (see Section 3.2). To do this, we extract individual trips from the cellphone and the public trans-port datasets. We then map the start and end points of all determined trips to the 55 administrative districts and group them into hourly OD matrices. Finally, subtracting
Apublicfrom the estimated overall mobility A⇤singaporeyields
an estimate of the private transport OD matrix A⇤private(see Section 3.3).
As every public trip is captured by the public transport smart card system, the public transport OD matrix rep-resents actual numbers. This means that the accuracy of
A⇤private only depends on the accuracy of the overall
mobil-ity A⇤singapore estimated from the cellphone dataset. More specifically, every trip that is not detected in the cellphone dataset directly contributes to the underestimation of the number of private trips. At first sight, it might seem that private trips are more difficult to detect from the cellphone data as people driving a car are much less likely to use their cellphones than while traveling on a train or a bus. However, our trip extraction algorithm is based on the recognition of origins and destinations of trips and only requires cellphones be used before and after, but not during trips.
3.1 Overall OD matrices
We determine the mobility of SingTel customers Asingtel from the cellphone call detail records with a trip detection algorithm (Section 3.1.1) and estimate the overall mobility
A⇤singaporeby upscaling Asingtelto the entire population
(Sec-tion 3.1.2).
The idea behind our trip detection algorithm is that call de-tail records of a particular subscriber accumulate at origins and destinations of trips in the form of clusters. We use an approach inspired by Calabrese et al. [10] to detect these clusters:
• Let x↵= [x1↵, x2↵, . . . , xn↵] denote the sequence of recorded locations of the cellphone user ↵.
• Then, the consecutive locations from xk
↵ through to xk+s
↵ (with 1 < k < k + s < n) can be combined if kxk
↵ xi↵k < d8i 2 [k + 1, k + s]. We use the threshold value d = 2 km, which is sufficiently high to filter out jumps among adjacent cell towers that do not happen due to trips of the cellphone user in Singapore. We define the virtual location yp↵ as the centroid of the combined locations:
yp↵= 1 s + 1 s X i=k xi↵. (3)
Let y↵= [y1↵, y2↵, . . . , ym↵] denote the sequence of vir-tual locations determined for ↵.
• These virtual location do not necessarily have to be ori-gins or destinations of trips as call detail records may also occur cumulatively during a trip (for example, when writing texts on a train) or a short interruption of a trip (for example when refueling at a gas station or when waiting for a bus). We therefore define clus-ters as those virtual locations that can be considered as origins and destinations of trips. A virtual location yk↵is referred to as a cluster if and only if there are at least two call detail records associated with yk
↵and the time ↵ spends at yk
↵ exceeds the threshold value t, which we select as 20 min. Let z↵ = [z1↵, z2↵, . . . , zp↵] denote the sequence of clusters of ↵.
• We then define a trip sk
↵as the path between the two consecutive clusters zk
↵ and zk+1↵ . z1↵ is the origin of the first trip of ↵ in the recorded period, and zp
↵is the destination of the last trip. All other clusters zk↵serve as both origins and destinations of trips.
To determine the origin-destination matrix Asingtel(ts, te), we map the start and end points of all detected trips to the 55 administrative districts of Singapore and add only these trips to Asingtel(ts, te) whose end time is2 [ts, te].
3.1.2 Upscaling
Next, the OD matrix Asingtelmust be upscaled to represent the overall mobility of Singapore. Taking into account the market share of SingTel, we estimate there were about 7.5 million cellphone subscribers in Singapore in 2011:
number of cellphone subscribers = number of SingTel subscribers
SingTel market share = 7.5⇥ 10
6. (4)
A population of around 5.2 million in 2011 [3] yields a cell-phone penetration of about 144 % when not considering pre-paid cellphones. To estimate the overall mobility A⇤singapore,
we upscale Asingtelby dividing it by the SingTel market share and the cellphone penetration in Singapore:
A⇤singapore=
Asingtel
market share⇥ cellphone penetration. (5) This scaling assumes that the travel behavior of SingTel cus-tomers represents the travel behavior of all people in Singa-pore.
3.2 Public transport OD matrices
Trips can be extracted fairly easily from the public trans-port dataset as each entry represents a single trip. Should the time between two consecutive trips of a particular per-son be less than 45 min—which is the time allowed by the smart card system to transfer [6]—we consider this as tran-sit time and combine these trips as we are only interested in the final destination of trips. Finally, the origins and the destinations of the trips are mapped to the 55 administra-tive districts of Singapore, and hourly public OD matrices can be determined. As each trip is captured by the smart card system, the resulting OD matrices are not an estimate but represent actual numbers of public transport trips.
3.3 Private transport OD matrices
Subtracting the public transport OD matrix Apublic from the estimated overall mobility A⇤singaporeyields an estimate of the number of people that do not take public transport:
A⇤private= A⇤singapore Apublic. (6)
As a trip is either public or private, the resulting OD matrix describes the flows of passengers using private transport.
4. EVALUATION
We use the results of the latest Household Interview Travel Survey (HITS) from 2008 to evaluate the performance of our trip extraction algorithm and the precision of the cor-responding OD matrices. According to the HITS, 20 % of all trips remain in the same district. On the contrary, only 4 % of all trips remain in the same district according to our study. Short intra-district trips cannot be recognized from the cellphone dataset for the following two reasons:
1. In our study, we estimate the location of a cellphone as the location of the connecting base station. To fil-ter out jumps between adjacent base stations, our trip recognition algorithm is based on a clustering algo-rithm. As a consequence, trips shorter than 2.0 km cannot be detected with our dataset.
2. If two consecutive trips are too short, it is unlikely even for very frequent users with an inter-event time of 60 min that a network event occurs, resulting in only one detected trip rather than two.
We therefore do not consider intra-district trips in our anal-yses. The number of samples of the latest HITS is not suffi-cient to compare the number of people traveling on specific connections (only one percent of all households were inter-viewed), which is why we focus on the overall number of trips and the mode share of public transport. Our mobility study shows a good correspondence with the latest HITS and a more recent study by the Land Transport Authority:
• We estimate the number of inter-district trips (both public and private) as 7.8 million per day. According to the HITS from 2008, there were 9.9 million trips per day in Singapore, 7.9 million of which were inter-district [11].
• According to our study, 45 % of the trips in Singapore are produced by public transport and 55 % by private transport (including taxi trips) on average. These re-sults are backed up by a travel survey conducted by the Land Transport Authority in 2011 (44 % by public transport and 56 % by private transport) [2].
These figures suggest that our trip detection algorithm for call detail records as well as the presented correction and up-scaling methods produce good estimates of the overall mo-bility in Singapore as well as the flows of private transport.
5. RESULTS
To identify weak public transport connections depending on the time of the day, we determine OD matrices for the morn-ing (6 am to 10 am), mid-day (10 am to 5 pm) and the evening (5 pm to 10 pm) based on hourly OD matrices that were averaged over all workdays. We investigate the evolu-tion of the public transport mode share over the day and identify weak public transport connections.
5.1 Mode share of public transport
The mode share of public transport in Singapore increases with time of the day. It is 38 % in the morning, reaches 44 % around mid-day and peaks at 52 % in the evening. One rea-son for this observation could be people feeling tempted to go to work by taxi when being in a hurry in the morning and using public transport back home in the evening, people car-pooling in the morning and returning back home separately, or parents dropping their kids at school on the way to work.
5.2 Weak public transport connections
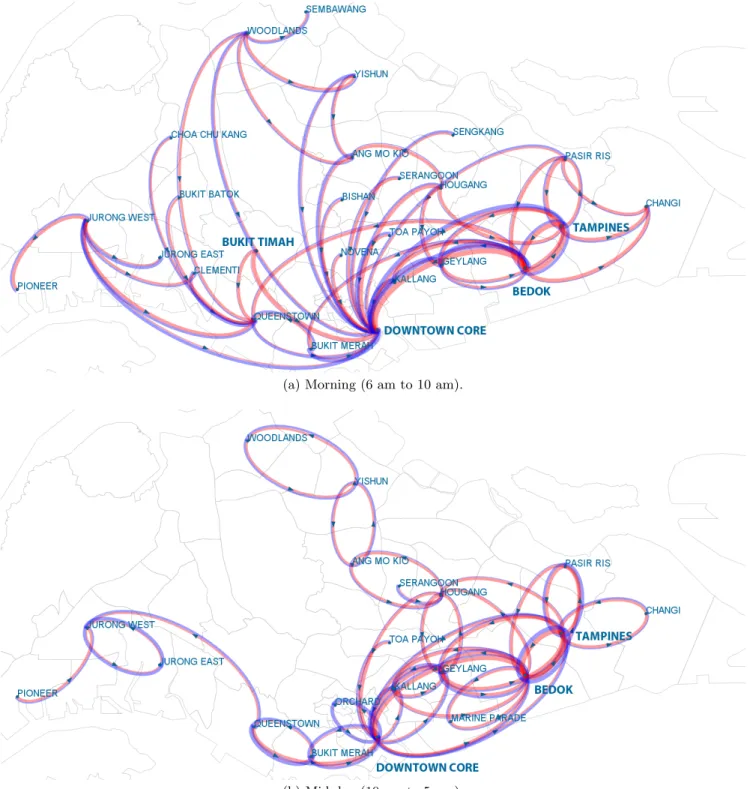
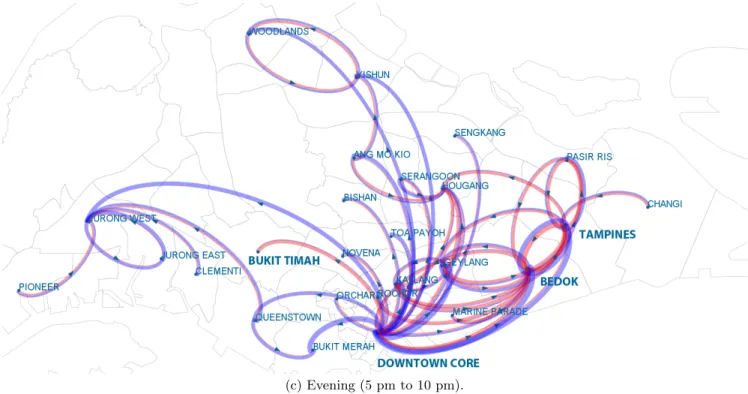
We define a connection to be weak by public transport when more people use private than public transport on this con-nection in a given period of time. Being particularly inter-ested in the major connections, we present only the 50 bus-iest out of the 2970 inter-district connections in Figure 4. The plots show the number of passengers taking public as well as private transport. Almost all trips are directed to-wards the city center in the morning. In the evening, the situation is reverse with most trips departing from the city center. The highest mode share of private traffic (around 80 %) can be observed between Bukit Timah, a large resi-dential area without access to a subway line, and the city center in the morning and in the evening. The Downtown Line, a new subway line in Singapore opening from 2013 to 2017, will cover this connection. Moreover, many weak public transport connections can be found around Bedok and Tampines, the most and third-most populated districts, which are located in the east of Singapore.
6. OUTLOOK
Traditional approaches to understanding public and private transportation flows through a city use travel surveys that are not only expensive, but also time consuming, inaccurate,
and only sample a small percentage of a city’s total popula-tion. Using a data mining approach, we present methods and analyses that show that mobility and connectivity in cities can be accurately described by cellphone call detail records quickly, efficiently, in real-time, and with district-level spa-tial resolution or better. Coupled with public transport smart card records, we show that we can further identify the spatio-temporal variability of public and private trans-port use and begin to examine how and why such patterns exist. However, the value and reliability of such an approach is not limited to only this use-case. In fact, the implications of harnessing these types of datasets, specifically those be-ing created from pervasive urban sensor networks and smart-phones, are immense for planning and designing more livable and sustainable cities.
By analyzing these highly granular datasets, produced in real-time, there are emerging opportunities to address a wide range of environmental, epidemiological, and socio-cultural questions that result from urban living and vis-a-vis human mobility in cities. With respect to transportation, using cellphone based mobility patterns opens up new ways to plan for the ever growing population of aging citizens—a particular issue for countries in Europe and in Japan, the United States, Singapore, among others. In order to guaran-tee accessibility to goods and services for populations with limited mobility options, big, urban datasets such as cell-phone call detail records can help inform short-, medium-, and long-term decisions to planmedium-, locatemedium-, and designmedium-, for example, mixed-use settlements, walkable connections and corridors, and mobility on-demand services.
Lastly, a role for cellphone based urban mobility detection has significant implications for disease control in cities. As humans serve as the primary and secondary vectors of many infectious diseases, understanding from where people arrive and depart and by which transportation modes people are traveling, we have the potential to model how and where diseases might be spreading and from where they might originate. Big data analytics such as the analysis presented here, may introduce a distinctly new and interdisciplinary approach to modern epidemiological studies in both the de-veloped and developing world.
Examining the digital breadcrumbs left behind by people in cities introduces new methods for examining urban mo-bility. Here, we emphasize the promising role for cellphone network analysis to generate meaningful descriptions of city scale transportation use and to comment on future avenues of urban research and planning.
7. REFERENCES
[1] Singapore census of population 2010. Technical report, Singapore Department of Statistics, 2010.
[2] JOURNEYS – Sharing Urban Transport Solutions, volume 7. Land Transport Authority, Singapore, 2011. [3] Statistics Singapore – Population (mid-year
estimates). http:
//www.singstat.gov.sg/stats/latestdata.html#12, retrieved on 2012-11-29.
[4] Administrative divisions of Singapore.
http://en.wikipedia.org/wiki/Administrative_ divisions_of_Singapore, retrieved on 2012-12-03.
(a) Morning (6 am to 10 am).
(b) Mid-day (10 am to 5 pm).
Figure 4: The 50 busiest inter-district connections, depending on the time of the day. The width of the lines represents the number of people traveling between the connected districts. Blue lines indicate the number of people taking public transport, and red lines the number of people taking private transport. The highest mode share of private traffic can be observed between Bukit Timah and the city center. Moreover, many weak public transport connections can be found around Bedok and Tampines.
(c) Evening (5 pm to 10 pm).
Figure 4: The 50 busiest inter-district connections, depending on the time of the day. The width of the lines represents the number of people traveling between the connected districts. Blue lines indicate the number of people taking public transport, and red lines the number of people taking private transport. The highest mode share of private traffic can be observed between Bukit Timah and the city center. Moreover, many weak public transport connections can be found around Bedok and Tampines.
[5] Ez-link card. http://www.ezlink.com.sg/index.php, retrieved on 2013-04-04.
[6] Transport fares. http://www.sbstransit.com.sg/ transport/trpt_lrt_fares.aspx, retrieved on 2013-04-04.
[7] I. Anderson and H. Muller. Practical context awareness for GSM cell phones. In Proceedings of the 10th IEEE International Symposium on Wearable Computers (ISWC 2006), pages 127–128, 2006. [8] I. Anderson and H. Muller. Exploring GSM data in
pervasive environments. International Journal of Pervasive Computing and Communications, 4(1):8–25, 2008.
[9] N. Caceres, J. Wideberg, and F. Benitez. Deriving origin destination data from a mobile phone network. Intelligent Transport Systems, 1(1):15–26, 2007. [10] F. Calabrese, G. Di Lorenzo, L. Liu, and C. Ratti.
Estimating origin-destination flows using
opportunistically collected mobile phone location data. Pervasive Computing, 10(4):36–44, 2011.
[11] C. Choi and R. Toh. Household interview surveys from 1998 to 2008 – a decade of changing travel behaviors. Technical report, Land Transport Authority, Singapore Government, 2008.
[12] B. Ferris, D. H¨ahnel, and D. Fox. Gaussian processes for signal strength-based location estimation. In Proceedings of Robotics: Science and Systems II, Cambridge, Massachusetts, USA, 2007. MIT Press. [13] V. Frias-Martinez, C. Soguero, and E. Frias-Martinez.
Estimation of urban commuting patterns using cellphone network data. In Proceedings of the ACM SIGKDD International Workshop on Urban
Computing (UrbComp 2012), pages 9–16. ACM, 2012. [14] S. Isaacman, R. Becker, R. C´aceres, S. Kobourov,
M. Martonosi, J. Rowland, and A. Varshavsky. Identifying important places in people’s lives from cellular network data. In Pervasive Computing, pages 133–151. Springer, 2011.
[15] C. Kang, S. Sobolevsky, Y. Liu, and C. Ratti. Exploring human movements in Singapore: a comparative analysis based on mobile phone and taxicab usages. In Proceedings of the 2nd ACM SIGKDD International Workshop on Urban Computing (UrbComp 2013), 2013.
[16] L. Liao, D. Patterson, D. Fox, and H. Kautz. Learning and inferring transportation routines. Artificial Intelligence, 171(5-6):311–331, 2007.
[17] C. Pan, J. Lu, S. Di, and B. Ran. Cellular-based data-extracting method for trip distribution. In Transportation Research Record: Journal of the Transportation Research Board, volume 1945, pages 33–39, 2006.
[18] T. Sohn, A. Varshavsky, A. LaMarca, M. Chen, T. Choudhury, I. Smith, S. Consolvo, J. Hightower, W. Griswold, and E. De Lara. Mobility detection using everyday GSM traces. In Proceedings of the 8th International Conference on Ubiquitous Computing (Ubicomp 2006), pages 212–224, Orange County, CA,
USA, 2006. Springer.
[19] L. Stenneth, O. Wolfson, P. Yu, and B. Xu. Transportation mode detection using mobile phones and GIS information. In Proceedings of the 19th ACM SIGSPATIAL International Conference on Advances in Geographic Information Systems (GIS 2011), pages 54–63. ACM, 2011.
[20] J. White and I. Wells. Extracting origin destination information from mobile phone data. In Proceedings of the 11th International Conference on Road Transport Information and Control, pages 30–34, 2002.
[21] Y. Zheng, Y. Chen, Q. Li, X. Xie, and W. Ma. Understanding transportation modes based on GPS data for web applications. ACM Transactions on the Web (TWEB), 4(1):1–36, 2010.