Publisher’s version / Version de l'éditeur:
Vous avez des questions? Nous pouvons vous aider. Pour communiquer directement avec un auteur, consultez la première page de la revue dans laquelle son article a été publié afin de trouver ses coordonnées. Si vous n’arrivez pas à les repérer, communiquez avec nous à PublicationsArchive-ArchivesPublications@nrc-cnrc.gc.ca.
Questions? Contact the NRC Publications Archive team at
PublicationsArchive-ArchivesPublications@nrc-cnrc.gc.ca. If you wish to email the authors directly, please see the first page of the publication for their contact information.
https://publications-cnrc.canada.ca/fra/droits
L’accès à ce site Web et l’utilisation de son contenu sont assujettis aux conditions présentées dans le site LISEZ CES CONDITIONS ATTENTIVEMENT AVANT D’UTILISER CE SITE WEB.
Analytical Chemistry, 90, 17, pp. 10510-10517, 2018-07-30
READ THESE TERMS AND CONDITIONS CAREFULLY BEFORE USING THIS WEBSITE. https://nrc-publications.canada.ca/eng/copyright
NRC Publications Archive Record / Notice des Archives des publications du CNRC : https://nrc-publications.canada.ca/eng/view/object/?id=0102fc79-bfd4-42f0-a2e4-9c4c32588415 https://publications-cnrc.canada.ca/fra/voir/objet/?id=0102fc79-bfd4-42f0-a2e4-9c4c32588415
NRC Publications Archive
Archives des publications du CNRC
This publication could be one of several versions: author’s original, accepted manuscript or the publisher’s version. / La version de cette publication peut être l’une des suivantes : la version prépublication de l’auteur, la version acceptée du manuscrit ou la version de l’éditeur.
For the publisher’s version, please access the DOI link below./ Pour consulter la version de l’éditeur, utilisez le lien DOI ci-dessous.
https://doi.org/10.1021/acs.analchem.8b02575
Access and use of this website and the material on it are subject to the Terms and Conditions set forth at
A new realization of SI for organic chemical measurement: NIST PS1
primary standard for quantitative NMR (Benzoic Acid)
Nelson, M. A.; Waters, J. F.; Toman, B.; Lang, B. E.; Rück, A.; Breitruck, K.;
Obkircher, M.; Windust, A.; Lippa, K. A.
A New Realization of SI for Organic Chemical Measurement:
NIST PS1 Primary Standard for Quantitative NMR (Benzoic Acid)
M. A. Nelson,
*
,†J. F. Waters,
†B. Toman,
†B. E. Lang,
†A. Rück,
‡K. Breitruck,
‡M. Obkircher,
‡A. Windust,
§and K. A. Lippa
††
National Institute of Standards and Technology, US Department of Commerce, Gaithersburg, Maryland 20899, United States
‡
Sigma-Aldrich Production GmbH, 9471 Buchs, Switzerland
§
Measurement Science and Standards, National Research Council Canada, Ottawa, ON K1A DR6, Canada
ABSTRACT: Metrological traceability to common references supports the comparability of chemical measurement results produced by different analysts, at various times, and at separate places. Ideally, these references are realizations of base units of the International System of Units (SI). ISO/IEC 17025 (Clause 6.5) states that traceability of measurement results is a necessary attribute of analytical laboratory competence, and as such, has become compulsory in many industries, especially clinical diagnostics and healthcare. Historically, claims of traceability for organic chemical measurements have relied on calibration chains anchored on unique reference materials with linkage to the SI that is
tenuous at best. A first-of-its-kind National Institute of Standards and Technology (NIST) reference material, ultrapure and extensively characterized PS1 Benzoic Acid Primary Standard for quantitative NMR (qNMR), serves as a definitive, primary reference (calibrant) that assuredly links the qNMR spectroscopy technique to SI units. As qNMR itself is a favorable method for accurate, direct characterization of chemical reference materials, PS1 is a standard for developing other traceable standards and is intended to establish traceability for the measurement of thousands of organic chemical species. NIST PS1 will play a critical role in directly promoting accuracy and worldwide comparability of measurement results produced by the chemical measurement community, supporting the soundness of clinical diagnostics, food safety and labeling, forensic investigation, drug development, biomedical research, and chemical manufacturing. Confidence in this link to the SI was established through (i) unambiguous identification of chemical structure; (ii) determinations of isotopic composition and molecular weight; (iii) evaluation of the respective molecular amount by multiple primary measurement procedures, including qNMR and coulometry; and (iv) rigorous evaluation of measurement uncertainty using state-of-the-art statistical methods and measurement models.
T
he comparability of chemical measurements made over time and under different circumstances is an absolute necessity for making well-informed decisions in many vital industries. For example, while a single measurement of creatinine in blood is part of assessing a healthcare patient’s kidney function, proper diagnosis and course of treatment can only be informed if that measurement is an equivalent indication of the urea levels determined in the past or to be determined in the future as well as those used to set treatment guidelines. Lacking comparability, critical information loses much of its value, and the likelihood of erroneous decisions increases.Ensuring comparability requires diligence, because quanti-tative organic chemical measurement techniques require comparison with appropriate reference standards, i.e., calibra-tion, to translate analytical instrument response into mean-ingful inference of chemical quantity. A suitable reference standard is a practical embodiment of the measurement units that define this quantity1namely through a property of the material that is based on the amount, or “count”, of the
molecular entities of interest relative to a specified mass of the material. This embodiment is realized through characterization of chemical purity. Since reference standards are composed of unique artifacts with variable properties, metrological trace-ability of the results of purity measurements is key to ensuring that calibrations using different standards are consistent indicators of the same kind of chemical quantity. This quality has become a base requirement for clinical and ISO/IEC 17025 accredited measurement laboratories, and increasingly, for forensic investigations.
In theory, metrological traceability of chemical purity values to the International System of Units (SI) requires complete definitive knowledge of material composition. Since this degree of absolute insight is unachievable for a real material, traceability is practically established through sound methods for characterizing chemical structure and amount.1−4To meet
Received: June 7, 2018 Accepted: July 30, 2018 Published: July 30, 2018
pubs.acs.org/ac
Cite This:Anal. Chem. 2018, 90, 10510−10517
Downloaded via NATL RESEARCH COUNCIL CANADA on April 5, 2019 at 18:10:54 (UTC).
these two requirements for establishing traceability, the methods must (1) affirm chemical identity without ambiguity and (2) provide adequate confidence for the corresponding quantitative evaluation. These metrologically sound ap-proaches, known as primary chemical measurement procedures for purity, are well-understood methods that confidently realize SI units for a specific amount (mol/kg) and mass fraction (g/ g) of a chemical substance in a material.5Reference standards characterized by these procedures are referred to as primary measurement standards and serve as the first artifacts implemented in metrologically traceable chains of calibration.6 In this fashion, it is confidence in the characterization of purity that substantiates the highest-order link between a chemical measurement result and the SI.
Quantitative nuclear magnetic resonance (qNMR) is a powerful spectroscopic technique for organic chemical measurement that provides information of chemical structure and is inherently quantitative.7−12 With the ability to inform both qualitative and selective quantitative assessments of a specific compound, qNMR satisfies both requirements for establishing traceability of purity characterizations. When qNMR is appropriately performed, the amplitude of the measured response for each chemically distinct moiety is directly and uniformly proportional to the number of corresponding resonant nuclei within the sample. Thus, it provides direct and selective inferences of the relative amounts (counts) of each1H structural entity, allowing mole ratios of
different compounds to be determined without chemical calibration. For this reason, qNMR exemplifies the definitive properties of a primary ratio quantitative chemical measure-ment method.12 This intrinsic metrological advantage promotes qNMR, particularly 1H-qNMR, as a commonly
preferred technique for evaluating the purity of the neat chemical reference standards that support traceable calibration schemes of a wide variety of organic chemical measure-ments.13−21 The qNMR technique provides traceability and comparability not just for measurements related to clinical healthcare diagnostics and forensic investigation but also for those supporting pharmaceutical development, food safety and toxicology, biomedical research, and chemical manufacturing.
Because qNMR evaluates the amount (count) ratios of distinct resonant nuclei, it is not able to independently determine the absolute amount of one measurable entity in a specified mass of material without such knowledge of another. Therefore, it is a comparator technique that requires a primary reference standard of higher orderone characterized in a traceable manner using an absolute, direct primary measure-ment procedureto realize this quantity for a specific amount of substance, i.e., realization of mol/kg.1,5 Organic acid acidimetric standards such as the National Institute of Standards and Technology (NIST) Standard Reference Material (SRM) 350b Benzoic Acid (Acidimetric) have historically been used as1H-qNMR primary standards, because
they have measurable1H content, are available in highly pure
(>99.99%) and stable forms, and importantly, have stated purity characterizations that are directly traceable to the SI via coulometric acidimetry (coulometry).13,16,20−23 This is an absolute technique for an H+assay based on Faraday’s Laws of
Electrolysis that does not require chemical calibration and thus is a primary direct measurement procedure for realization of a specific amount of substance (mol/kg) of H+that is traceable
to SI units for mass (kg), amount of substance (mol), electrical
current (A), and time (s).24−28However, the amount of H+is
not the same measurand as the amount of benzoic acid. Distinct from the other SI base quantities such as mass, length, and time, amount of (chemical) substance is a quantity concerning entities of a precisely specified identity. Since there are practically limitless organic chemical structures, unambig-uous identification is a critical and often challenging task. Though practical for use with1H-qNMR, standards with purity
characterized only through evaluation of H+present a gap in SI
traceability for organic chemical measurement, because this purity was not directly inferred for the entire organic acid structure. Although results are carefully controlled and adjusted, coulometry is not a highly selective chemical measurement method, because any H+, regardless of
provenance, elicits a measurable response. In other words, there is lack of evidence supporting confidence in the assumption that the specific amount of H+is stoichiometrically
consistent with the specific amount of benzoic acid in the reference material, as inferable through aromatic hydrogen content via1H-qNMR.
This ambiguity of identity is even more prominent for mass purity determinations because of additional uncertainty in the molecular weight used to convert values of a specific amount of H+ to a chemical mass fraction. This uncertainty can be
evaluated using the standard atomic weights and guidelines provided by the International Union of Pure and Applied Chemistry (IUPAC) Commission on Isotopic Abundances and Atomic Weights (CIAAW).29 However, stable isotope ratios, and thus elemental mass composition of a compound, may vary significantly from one real material to the next.30−32 Considering this uncertainty is imperative for mass purity determinations, which can be more selectively and precisely evaluated through standardized stable isotope ratio determi-nations for the real material.33 This empirical knowledge of isotope composition can ensure that the stated purity and appropriate uncertainty of a primary reference material are fit for the purpose as a higher-order calibrant. Experimentally measuring these values for a primary standard is also philosophically pertinent given that (1) these weights are inherent to the complete identity of the compound within the artifact, (2) an appropriate uncertainty is required for the stated purity to be SI-traceable, and (3) NMR measures only viable isotopes of a given elementsuch as1H but not2H.
To close this long-standing gap in metrological traceability to the SI for organic chemical purity characterizations and the many calibration hierarchies they establish, the first in a new category of reference materials for the highly viable1H-qNMR
technique, National Institute of Standards and Technology (NIST) PS1 Primary Standard for Quantitative NMR (benzoic acid), was produced and extensively characterized to attain confident realization of SI-traceable units of a specific amount (mol/kg) and mass fraction (g/g) for organic chemical measurements. The approach described herein evaluated and established unequivocal confidence that the SI-traceable characterization of purity through coulometric titration of H+
is consistent with the chemical purity of benzoic acid. Metrologically sound and traceable full-structure inferences of these values were achieved through extensive coulometric acidimetry, 1H-qNMR analyses, and determination of stable
isotope composition and molecular weight. This evaluation was further confirmed by an investigation of impurity components.
Analytical Chemistry Article
DOI:10.1021/acs.analchem.8b02575 Anal. Chem. 2018, 90, 10510−10517 10511
■
EXPERIMENTAL SECTIONThe benzoic acid neat chemical source material of NIST PS1 was manufactured and packaged by Sigma-Aldrich Production GmbH (Buchs, CH). The high-purity benzoic acid (>99%) was further purified via jet milling by Jetpharma SA (Balerna, CH) to remove occluded water. A packaged unit consists of two screw-cap vials, each containing 500 mg of benzoic acid under argon gas, hermetically sealed in polyester film pouches for long-term storage and stability. Purity measurements for NIST PS1 were performed using packaged units selected at regular intervals across the entire lot.
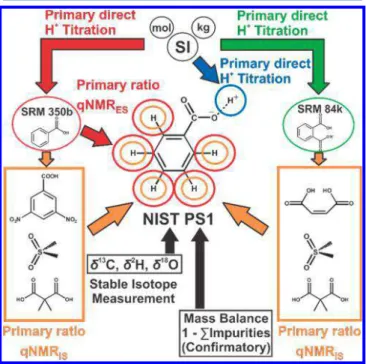
Measurement Scheme. A full-structure inference of the chemical mass fraction purity and specific amount of PS1 was evaluated using four independent primary measurement methods: acidimetry, 1H-qNMR using an internal standard
(1H-qNMR
IS), 1H-qNMR using an external standard (1
H-qNMRES), and a mass balance approach for purity
determi-nations (1− ∑wimpurites). Direct linkage of NIST PS1 to the SI was established through three independent lineages and orthogonal measurement of all H atoms of the unambiguously identified benzoic acid structure (Figure 1). These are
supported by direct coulometric assay and 1H-qNMR with
NIST SRM 350b and NIST SRM 84k calibrants. Additionally, the relative abundance of stable isotopes of H, C, and O in PS1 were measured and used to calculate the molecular weight of the benzoic acid species.
Coulometry. High-precision coulometric acidimetry assay of H+ in PS1 was conducted using constant-current
coulometric generation of hydroxide.34The resulting reaction for acidimetric titration of benzoic acid is
OH−+C H COOH6 5 →H O2 + C H COO6 5 −
The benzoic acid mass fraction (wP) was evaluated usingeq 1
w MIt m nF P p = (1)
where M is the empirically determined molecular weight of benzoic acid in PS1; I is titration current; t is titration time; mp is the mass of the titrated sample; n is the charge number (moles of electrons per mole of analyte oxidized); and F is the Faraday constant, 96485.33289 C mol−1 (u = 0.00059 C
mol−1).35
It should be noted that adoption of a revised SI by the International Committee for Weights and Measures (CIPM) redefines several fundamental constants, including elementary charge (e) and Avogadro constant (NA), as exact values.36 Under this revision, the Faraday constant is effectively 96485.33212 C mol−1. This value is not significantly different from that above, and its implementation ineq 1has no impact on the coulometry result at the precision expressed herein. Thus, the certified values of NIST PS1 and the corresponding metrological traceability to SI is conserved with either definition.
Values for the constant current, traceable to NIST primary standards, were obtained from calibration of a standard wire resistor37 and calibration of a standard voltage cell.38 The internal time-base of the counter-timer is traceable to the SI unit of time, s, through synchronization with Coordinated Universal Time, UTC (NIST) time and frequency standard. A total of 34 units of NIST PS1 were assayed, along with NIST SRM 350b Benzoic Acid (Acidimetric) as control samples.
1
H-qNMR Using an Internal Standard. A series of four distinct high-purity neat materialsdimethyl sulfone, 2,2-dimethylpropanedioic acid (Me2PDA), 3,5-dinitrobenzoic
acid, and maleic acidwere calibrated for use as internal standards via1H-qNMR
IScomparison with NIST SRM 350b
Benzoic Acid and SRM 84k Potassium Hydrogen Phthalate (Table 1).
Samples from 10 units of NIST PS1 Benzoic Acid were independently measured with each of these four internal standards. The masses of PS1 and internal standard within each sample were precisely determined using an ultra-microbalance (Mettler Toledo UMX5, Columbus, OH, USA). The mass of PS1 for each measurement was <5 mg, diluted in∼0.7 mL of solvent. Samples were prepared using fully deuterated dimethyl sulfoxide (DMSO-d6) as solvent,
except for those containing dimethyl sulfone, for which fully deuterated methylene chloride (CD2Cl2) was used.
1H-NMR measurements were performed using a Bruker
AVANCE II spectrometer operating at 600.14 MHz with a room temperature broadband inverse (BBI)1H-observe probe.
The general1H-qNMR experimental parameters for
measure-ment of PS1, using a 90° single pulse excitation sequence without13C decoupling, are as follows: 12020 Hz (20.02 ppm)
spectral window; 3706 Hz (6.18 ppm) transmitter frequency
Figure 1. NIST PS1 benzoic acid measurement scheme and SI lineage. The subscripts IS and ES associated with qNMR measure-ments respectively denote internal standard and external standard approaches.
Table 1. Internal Standard1H-qNMR
ISCalibration
reference material internal standard solvent
dimethyl sulfone SRM 350b CD2Cl2
SRM 84k D2O
Me2PDA SRM 350b DMSO-d6
SRM 84k D2O
3,5-dinitrobenzoic acid SRM 350b DMSO-d6
offset; 5.49 s acquisition time; 60 s recycle delay; 2 dummy scans, and signal averaging of 80 transients.
1H-NMR data were processed using Bruker TopSpin
(version 3.2) software. Time domain data were multiplied by an exponentially decaying window function with 0.3 Hz line broadening. After Fourier transformation, the spectra were manually phase corrected to achieve pure absorption mode. Baseline correction was performed manually across the specific integral regions of interest using a five degree polynomial function. Peak integral regions were manually selected for each measured spectrum and evaluated within TopSpin. Signal-to-noise ratios of integrated resonances were >15000, with most being considerably higher than this ratio.47
The spin−lattice relaxation times (T1) of benzoic acid and internal standard resonances in the1H-qNMR
ISsamples were
evaluated using magnetization inversion−recovery NMR experiments. Typical measured T1 values for these samples are shown inTable 2. The longest measured T1was 5.0 s. The
relaxation delay of the1H-qNMR
ISmeasurements (60 s) is at
least 12 × T1. For the 90° pulse, this relaxation period allowed the z-magnetization of each resonance to return to >99.999% of the equilibrium value prior to the subsequent pulse. The purity of PS1 Benzoic Acid, PP, was assessed through the qNMRISmeasurement function,eq 2 P N N M M A A m m P P I B B I B I I P I i k jjjjj y{zzzzz ikjjjjj y{zzzzz jjjjjki y{zzzzz ikjjjjj y{zzzzz = × × × × (2)
where NB= benzoic acid integral1H multiplicity (#1H/∫ ); NI = internal standard species integral1H multiplicity (#1H/∫ );
MB= molecular weight (g/mol) of benzoic acid; MI= average molecular weight (g/mol) of the internal standard species; AB = integral of respective benzoic acid spectral peak; AI= integral of respective internal standard species spectral peak; mP= mass (g) of PS1 benzoic acid; mI= mass (g) of the internal standard reference material; and PI= purity (g/g) of internal standard material.
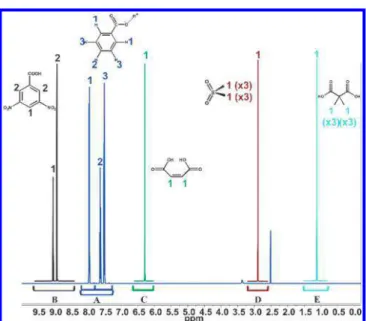
Approximate limits of spectral regions integrated for 1
H-qNMRIS measurements (δ∫) and the corresponding chemical
structure assignments (H) are summarized in Table 2 and shown in Figure 2. These integral regions included and extended beyond the respective satellite signals resulting from
13C−1H scalar coupling. Peak areas of benzoic acid H(2) and
H(3) were integrated in aggregate due to overlap of the13C
satellites, and one of the three benzoic acid integrals included the collective peak area for H(1), H(2), and H(3).
1H-qNMR Using an External Standard. Direct
quanti-tative comparisons were made between PS1 Benzoic Acid and SRM 350b Benzoic Acid using a validated1H-qNMR by an
external standard approach at the National Research Council (NRC) Canada, Ottawa, ON.39This comparison was made to retroactively establish SI traceability for historical implementa-tion of SRM 350b Benzoic Acid as a primary standard for1
H-qNMR and to provide additional confirmation of the certified values of PS1. The result from this analysis was not used to calculate the certified purity of NIST PS1 Benzoic Acid.
Duplicate samples of five units of PS1 and five calibrants containing SRM 350b were independently prepared in methanol-d4at mass fractions of 4−7 mg/g. These solutions
were transferred to separate identical precision glass NMR tubes specified for at least 600 MHz and 0.1% volume variability. A micrometer was used to measure the outer diameter (D) of each tube at six points along the active region and approximate integral corrections for active volume that are inversely proportional D2.
Duplicate measurements of each sample via a 90° single pulse excitation sequence without 13C decoupling was
performed using a Bruker AVANCE III spectrometer operating at 400.13 MHz with a room temperature broadband observe (BBO) probe. Each sample was identically positioned within the probe, manually tuned, and precisely matched. The 90° pulse width was adjusted for each PS1 sample and calibrant according to the respectively determined 360° pulse. Experi-ments were performed using the following conditions: 12019 Hz (30.04 ppm) spectral window; 2001 Hz (5.00 ppm) transmitter frequency offset; 5.45 s acquisition time; 45 s recycle delay; 2 dummy scans and 8 transients; 298 K probe temperature. The receiver gain was held constant for all measurements, and the relaxation delay was greater than 7 ×
T1.
Time domain data apodization, phase adjustment, baseline correction, and integration were performed in a consistent manner as for 1H-qNMR
IS using Bruker TopSpin software
Table 2. Summary of Integral Regions Evaluated for1
H-qNMRIS Measurements
chemical species δ∫, ppma N Hb T
1, s
potassium hydrogen phthalate 7.1−7.9 4 <4.8
dimethyl sulfone 2.7−3.3 6 1 4.8 Me2PDA 0.8−1.7 6 1 0.8 3,5-dinitrobenzene 8.6−9.3 3 1 4.8 2 4.5 maleic acid 6.0−6.6 2 1 2.6 benzoic acidc 7.9−8.4 2 1 2.6−3.6 7.3−8.4 3 2 2.7−5.0 3 2.2−4.0 7.3−7.9 5 1,2,3 2.6−5.0 a
Regions varied among individual samples in different solvents.b1H chemical structure assignments consistent with those shown inFigure 2.cMeasured T1value ranges for samples in different solvents.
Figure 2. 1H-NMR integral regions of (A) benzoic acid, (B) 3,5-dinitrobenzoic acid, (C) maleic acid, (D) dimethyl sulfone, and (E) Me2PDA evaluated for1H-qNMRIS.
Analytical Chemistry Article
DOI:10.1021/acs.analchem.8b02575 Anal. Chem. 2018, 90, 10510−10517 10513
routines. Three benzoic acid spectral peak regions of PS1 samples and SRM 350b calibrants were compared. These were manually selected to include peaks of the following resonances and the respective 13C satellites, as assigned in Figure 2
Integral 1: H(1), H(2), and H(3); Integral 2: H(1); Integral 3:
H(1) and the nearest13C satellite of H(2). Purity values (P
i) were determined for each sample using each integral region of the respective spectrum according to the following measure-ment functions P A w K i, 1, ..., 3 K K 1 5 i P P i i j i j 1 5 , i
∑
= ̅ × = = = (3a) K w A P i j, C C C j i j, = ̅ × (3b)Where A̅Pi = mean value of benzoic acid integral i from duplicate measurement of PS1 sample; wP= PS1:CD3OD mass
ratio (mg/g) of PS1 sample; A̅Ci,j= mean value of benzoic acid integral i from duplicate measurement of calibrant j; wCj = SRM 350b:CD3OD mass ratio (mg/g) of calibrant j; PC = purity of SRM 350b Benzoic Acid, 0.999978 ± 0.000044 g/g. Determination of Molecular Weight. Stable isotope relative abundance measurements of carbon (C), hydrogen (H), and oxygen (O), δ13C, δ2H, and δ18O, were made by the
United States Geological Survey (USGS) Reston Stable Isotope Laboratory (RSIL) in Reston, VA, via high-temper-ature conversion/elemental analyzer continuous-flow isotope ratio spectrometry (TC/EA-IRMS). Independent confirmatory measurements of δ13C were performed by NRC. Ratios for H and O are relative to the VMSOW-SLAP scale (δ2HVSMOW‑SLAP, δ18OVSMOW‑SLAP) and that for C is relative to
VPDB (δ13C
VPDB).40,41These ratios were used to calculate the
respective atomic weights, Aw, and associated uncertainties for determination of the molecular weight, Mw, of NIST PS1 benzoic acid according toeq 4.
Mw(NIST PS1)=7Aw(C)+ 6Aw(H) +2Aw(O) (4)
Mass Balance.A mass balance approach to chemical purity determination was conducted to provide confirmatory evidence for the certified values of PS1. This approach infers purity as the difference between mass fraction 1 (g/g) and the sum of all quantified impurity components, as expressed ineq 5
wP 1 (wR wW wV wA)
M= − + + + (5)
where wPM is the purity of PS1 and wR, wW, wV, and wAare, respectively, the mass fractions of the structurally related organic chemical impurity, water, volatile, and nonvolatile impurity components. The primary impurity, wW, was measured via volumetric Karl Fischer titration of 12 units calibrated with water saturated 1-octanol. This method was also used to assess the water content of PS1 after storage under indoor ambient conditions for 18 months and at 86% relative humidity for 6 months.
Structurally related impurity content was assessed via liquid chromatography/high-resolution mass spectrometry (LC/ HRMS) using a Q-Exactive Orbitrap Mass Spectrometer (Thermo Fisher Scientific, Inc., Waltham, MA) as well as two-dimensional1H−13C heteronuclear single quantum coherence
(HSQC) and1H and13C one-dimensional NMR spectroscopy.
Assessments of wV and wA were conducted via
thermogravi-metric analysis, ion chromatography with a conductivity detector, and ash analyses up to 800 °C.
■
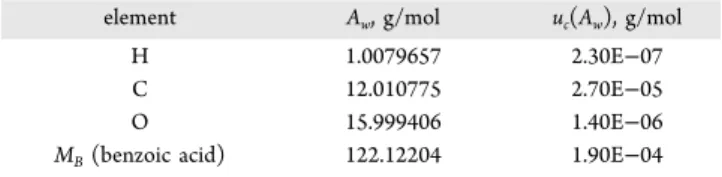
RESULTS AND DISCUSSIONMolecular Weight.The atomic and molecular weights and associated uncertainties for PS1 benzoic acid derived from measured δ13C, δ2H, and δ18O relative to VPDB and
VMSOW-SLAP are in Table 3. This molecular weight is used for
calculation of chemical purity according toeqs 1and2. Isotope atom fractions (x) and the associated uncertainties (u(x)) of
1H and13C nuclei are derived from the isotope delta values as
x(1H) = 0.999 860, u(x(1H)) = 0.000 003 and x(13C) = 0.010 74, and u(x(13C)) = 0.000 09, respectively. The independent
confirmatory determinations of δ13C by the NRC were consistent those made by the USGS RSIL.
Coulometry.A summary of the acidimetric assay results is presented in Table 4. The standard uncertainty (uc) was
evaluated with consideration of components evaluated through Type A methods for measurement replication and for components evaluated through Type B methods including mass determination, chemical bias, electrical calibration, and the Faraday Constant. The expanded uncertainty was evaluated by multiplying uc by a coverage factor, k, that corresponds to approximately 95% confidence, on the basis of the effective degrees of freedom.
1H-qNMR
IS. The chemical purity of PS1 Benzoic Acid
evaluated using each internal standard is in Table 5. These results were calculated through an observation equation approach for eq 2 under the Bayesian paradigm,42,43 using Markov Chain Monte Carlo (MCMC) methods implemented within the OpenBUGS software application.44 This model inherently accounts for uncertainty associated with the Table 3. Atomic (Aw) and Molecular (MB) Weights for NIST
PS1 Benzoic Acid
element Aw, g/mol uc(Aw), g/mol
H 1.0079657 2.30E−07
C 12.010775 2.70E−05
O 15.999406 1.40E−06
MB(benzoic acid) 122.12204 1.90E−04
Table 4. Acidimetric Assay of NIST PS1 Benzoic Acid Result Summary
benzoic acid mass fraction, g/g 0.999923
combined standard uncertainty, uc, g/g 0.00002
coverage factor, k 1.97
expanded uncertainty, U, g/g 0.00004
Table 5.1H-qNMR
IS Analysis of NIST PS1 Benzoic Acid
Result Summary
purity
internal standard value, g/g U95%, g/g
dimethyl sulfone 0.99989 [0.99868, 0.99999] Me2PDA 0.99994 [0.99903, 0.99999] 3,5-dinitrobenzoic acid 0.99999 [0.99764, 1.00000] maleic acid 0.99997 [0.99981, 0.99997] 1H-qNMR ISconsensus 0.99992 [0.99981, 0.99997]
variables of the measurement function (bottom−up), random effects associated with repeatability and experimental design (top−down), and data correlations arising from the use of different internal standards.
The following standard uncertainties were used to define the observation data for each sample measurement, treated as Gaussian distributions: uABis defined as the standard deviation of the three benzoic acid integrals normalized to the respective value of NB; uAIis defined as a relative uncertainty of 0.00025
the area of AI; umIand umPare both defined as 0.5 μg; uPIranged
between 0.05 and 0.10%, determined from hierarchical Bayesian evaluation for the respective1H-qNMR
IScalibration
of each internal standard; uMP= 0.00019 g/mol, as determined
for the molecular weight of PS1 benzoic acid.
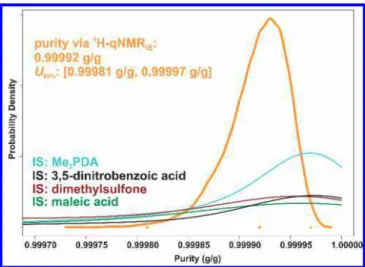
The results from the four internal standards were con-strained to lie below the natural limit of mass fraction 1 (g/g). Because the data indicated very high purity near this constraint, the results from the different internal standards were pooled using a hierarchical model on the logit transform of the corresponding values to determine a consensus purity for the1H-qNMRIS method. No trend in benzoic acid purity
was observed for 5 mg samples within individual units or across the production lot. The purity values (g/g) and associated 95% confidence interval (U95%) listed in Table 5
and plotted in Figure 3 are respectively expressed as the
median and the value range covering 95% of the probability density of the MCMC result. The uncertainty of the consensus value is less than that typical of a single1H-qNMR assay. This
confidence was achieved with more variable observations, because the consensus model (1) estimates the likelihood of purity values at or below 1 g/g using data that infers purity very near this natural limit and (2) treats each of the four measurement sets as independent observations of the same measurand.
Although the internal standards were calibrated using acidimetric primary standards, the consistency of the four respective1H-qNMR
ISresults substantiates confidence in the
following assertions about the benzoic acid and potassium hydrogen phthalate calibrators: (1) the complete organic chemical structures are unambiguously confirmed; (2) the certified chemical mass fractions evaluated through completely independent H+ assay procedures are accurate
character-izations, as verified through concordant comparison of organic chemical amount via 1H-qNMR
IS; and (3) deviations in
relative abundance of 1H and 2H are not significant with
respect to the measurement uncertainty. Additionally, trace-ability for the derived unit g/g is conserved by observation of the natural limit of 1 g/g. This thorough, empirically supported confidence therefore supports metrological traceability of these
1H-qNMR
IS measurement results through the directly
SI-traceable acidimetric standards.
Certified Values.Table 6lists the two certified values for NIST PS1: specific amount (mol/kg) and mass fraction (g/g)
of benzoic acid, for which the measured molecular weight (g/ mol) of benzoic acid in the material was used to convert the specific amount to the corresponding mass fraction. The associated uncertainties are expressed as 95% confidence intervals (U95%). As shown inFigure 4, the certified values are
consensus values that blend the coulometry and1H-qNMR IS
estimates, calculated with a linear opinion pooling procedure. Essentially a mixture of these two probability distributions, this approach treats both primary measurement methods as equally reliable and provides a quantitative inference of chemical content that is informed by the entire benzoic acid structure. Furthermore, this inference is calibrated with multiple independent SI-traceable lineages and supports confidence in the direct SI traceability of the characterized benzoic acid content.
1H-qNMR
ES. The mean of all (i × 10 = 30) PS1 purity
values determined via this method was 99.8% with an associated standard uncertainty interval between 99.4 and 100%. The adjustments for active volume had no significant influence on the results. While the precision of this result is much lower than that of the 1H-qNMR
IS method, it is
congruous with the certified value of NIST PS1. This direct
Figure 3.Consensus purity of PS1 via1H-qNMR
ISwith four internal standards (IS) using hierarchical Bayesian procedure.
Table 6. Certified Values of NIST PS1
mass fractiona, g/g specific amounta, mol/kg
benzoic acid 0.99992− 0.00006 + 0.00004 8.1880− 0.0005 + 0.0004 a
Expressed as x− UL95%+ UH95%, where x denotes the certified value,
and UL95%and UH95%indicate the low and high boundaries of a 95%
coverage interval.
Figure 4.Mass fraction of benzoic acid via linear pool consensus of 1H-qNMR and coulometry results.
Analytical Chemistry Article
DOI:10.1021/acs.analchem.8b02575 Anal. Chem. 2018, 90, 10510−10517 10515
qNMR comparison of benzoic acid content provides metrological traceability of the certified value of SRM 350b Benzoic Acid (acidimetric) for historical use as a qNMR primary standard.
Mass Balance Confirmation. The only detected impur-ities in NIST PS1 were water and nonvolatile ash content. No additional volatile or solvent content was observed via TGA. The calculation of purity by eq 5 was performed using the NIST Uncertainty Machine.45 The water content value and associated uncertainty via Karl Fischer titration was treated as a Gaussian distribution with a mean of 0.000041 g/g and standard deviation of 0.000015 g/g, and the nonvolatile content was treated as a uniform distribution along the interval between 0 and 0.00012 g/g.46 No structurally related impurities were identified via LC/HRMS, nor via 1H-, 13C-,
or1H−13C-HSQC NMR. The purity of PS1 determined by a
mass balance approach is 0.9999 g/g with a 95% confidence interval between the values of 0.99983 and 0.99997 g/g. The consistency of this purity result with those determined via1
H-qNMRIS and coulometry provides additional assurance that
there is no significant bias associated with the results used to calculate the consensus values. This supplementary evidence supports the confidence of the certified values and SI traceability of NIST PS1 Benzoic Acid.
■
CONCLUSIONA complete, first-of-its-kind chemical characterization of NIST PS1 Primary Standard for quantitative NMR (benzoic acid) has confidently established a direct realization of SI units for quantitative organic chemical measurement and established metrological traceability for historical use of SRM 350b Benzoic Acid (acidimetric) as a primary standard for qNMR. Chemical selectivity for qNMR requires that internal reference standards be structurally dissimilar from the analyte so that respective moieties have clearly distinct nuclear resonances. This and other chemical requirements for viability are met by an immense variety of stable organic compounds that can be characterized by this material using qNMR and implemented as more technically advantageous secondary standards to establish SI traceability for subsequent calibrations. As a pinnacle chemical reference material that may serve as the first, primary reference standard in a chain of metrologically traceable organic chemical calibrations, NIST PS1 is intended to establish the highest order of comparability and promote the accuracy of quantitative measurements within the greater organic chemical sector. This has a direct impact on the value of critical results that support many industries and applications including healthcare, manufacturing, forensic investigation, food safety and labeling, drug development, biomedical research, and chemical manufacturing. Through SI traceability, these communities have more reliable measurements that are meaningful across time and place.
■
AUTHOR INFORMATION Corresponding Author *E-mail:michael.nelson@nist.gov ORCID M. A. Nelson:0000-0003-0503-4501 NotesThe authors declare no competing financial interest.
■
ACKNOWLEDGMENTSThe authors thank Qi Haiping and Tyler Coplen of the U.S. Geological Survey for stable isotope ratio determinations supporting this work. They also thank Juris Meija and Jeremy Melanson of the NRC Canada and Robert Vocke Jr., Michael Winchester, David Duewer, and Antonio Possolo of NIST for contributing expertise, resources, and many suggestions that greatly improved development of this standard and content of this article. Additional thanks are given to Juris Meija of NRC Canada for providing supplemental carbon stable isotope data. Certain commercial equipment, instruments, or materials are identified in this paper to specify adequately the experimental procedure. Such identification does not imply recommenda-tion or endorsement by the NIST or the NRC nor does it imply that the materials or equipment identified are necessarily the best available for the purpose.
■
REFERENCES(1) DeBièvre, P.; Dybkaer, R.; Fajgelj, A.; Hibbert, B. Pure Appl.
Chem. 2011, 83, 1873−935.
(2) Bureau International des Poids ets Mesures. The International
System of Units (SI), 8th ed; Stedi Media: Paris, 2006; updated 2014.
(3) Stoeppler, M.; Wolf, W. R.; Jenks, P. J., Eds. Reference Materials
for Chemical Anlaysis: Certification, Availability and Proper Usage;
Wiley-VCH: Weinheim, Germany, 2007.
(4) Duewer, D. L.; Parris, R. M.; White, E. V.; May, W. E.; Elbaum, H. NIST Special Publication 2004, NIST SP 1012.
(5) Milton, M. J. T.; Quinn, T. J. Metrologia 2001, 38, 289−296. (6) Joint Committee for Guides in Metrology. International
Vocabulary of MetrologyBasic and General Concepts and Associated Terms, 3rd ed.; JCGM 200:2012; 2008.
(7) Malz, F.; Jancke, H. J. Pharm. Biomed. Anal. 2005, 38 (5), 813− 823.
(8) Bharti, S. K.; Roy, R. TrAC, Trends Anal. Chem. 2012, 35, 5−26. (9) Jancke, H.; Malz, F.; Haesselbarth, W. Accredit. Qual. Assur. 2005, 10, 421−429.
(10) Holzgrabe, U.; Deubner, R.; Schollmayer, C.; Waibel, B. J.
Pharm. Biomed. Anal. 2005, 38 (5), 806−812.
(11) Pauli, G. F.; Jaki, B. U.; Lankin, D. C. J. Nat. Prod. 2005, 68, 133−149.
(12) Jancke, H. Nachr. Chem., Tech. Lab. 1998, 46 (7−8), 720−722. (13) Schoenberger, T. Anal. Bioanal. Chem. 2012, 403 (1), 247− 254.
(14) Pauli, G. F.; Goedecke, T.; Jaki, B. U.; Lankin, D. C. J. Nat.
Prod. 2012, 75 (4), 834−851.
(15) Saed Al Deen, T. S.; Hibbert, D. B.; Hook, J. M.; Wells, R. J.
Anal. Chim. Acta 2002, 474 (1−2), 125−135.
(16) Wells, R. J.; Cheung, J.; Hook, J. M. Accredit. Qual. Assur. 2004,
9, 450−456.
(17) Davies, S. R.; Jones, K.; Goldys, A.; Alamgir, M.; Chan, B. K. H.; Elgindy, C.; Mitchell, P. S. R.; Tarrant, J. G.; Krishnaswami, M. R.; Luo, Y.; Moawad, M.; Lawes, D.; Hook, J. M. Anal. Bioanal. Chem. 2015, 407 (11), 3103−3113.
(18) Saito, T.; Ihara, T.; Miura, T.; Yamada, Y.; Chiba, K. Accredit.
Qual. Assur. 2011, 16, 421−428.
(19) Nelson, M.; Bedner, M.; Lang, B.; Toman, B.; Lippa, K. Anal.
Bioanal. Chem. 2015, 407, 8557−69.
(20) Saito, T.; Ihara, T.; Koike, M.; Kinugasa, S.; Fujimine, Y.; Nose, K.; Hirai, T. Accredit. Qual. Assur. 2009, 14, 79−86.
(21) Weber, M.; Hellriegel, C.; Rueck, A.; Sauermoser, R.; Wuethrich, J. Accredit. Qual. Assur. 2013, 18, 91−8.
(22) Maniara, G.; Rajamoorthi, K.; Rajan, S.; Stockton, G. W. Anal.
Chem. 1998, 70, 4921−4928.
(23) SRM 350b Benzoic Acid (Acidimetric), Certificate of Analysis; National Institute of Standards and Technology, Gaithersburg, MD, Original Issue Date: 16 December 2005. https://www-s.nist.gov/
(24) Pan, X. R. Metrologia 1997, 34, 35−39.
(25) Richter, W. Accredit. Qual. Assur. 1997, 2, 354−359.
(26) Marinenko, G.; Taylor, J. K. Anal. Chem. 1968, 40 (11), 1645. (27) Pratt, K. W. Anal. Chim. Acta 1994, 289 (2).135−142 (28) Quinn, T. J. Metrologia 1997, 34 (4), 61−65.
(29) Possolo, A.; van der Veen, A. M. H.; Meija, J.; Hibbert, D. B.
Pure Appl. Chem. 2018, 90 (2), 395−424.
(30) Meija, J.; Coplen, T. B.; Berglund, M.; Brand, W. A.; DeBièvre, P.; Gröning, M.; Holden, N. E.; Irrgeher, J.; Loss, R. D.; Walczyk, T.; Prohaska, T. Pure Appl. Chem. 2016, 88 (3), 265−291.
(31) IUPAC Commission on Atomic Weights. Pure Appl. Chem. 1969, 18 (4), 569−580.
(32) de Bièvre, P. Z. Fresenius' Z. Anal. Chem. 1973, 264, 365−371. (33) De Bièvre, P.; Peiser, H. S. Metrologia 1997, 34, 49.
(34) Taylor, J. K.; Smith, S. W. J. Res. Natl. Bur. Stand., Sect. A 1959,
63A (2), 153.
(35) Mohr, P. J.; Newell, D. B.; Taylor, B. N. Rev. Mod. Phys. 2016,
88 (3).035009
(36) Newell, D. B.; Cabiati, F.; Fischer, J.; Fujii, K.; Karshenboim, S. G.; Margolis, H. S.; de Mirandés, E.; Mohr, P. J.; Nez, F.; Pachucki, K.; et al. Metrologia 2018, 55 (1), L13−L16.
(37) Elmquist, R. E.; Jarrett, D. G.; Jones, G. R.; Kraft, M. E.; Shields, S. H.; Dziuba, R. F. NIST Technical Note 2003, NBS TN1458. (38) Field, B. F. Standard Cell Calibrations; NIST Special Publication 250−24; 1987.
(39) Burton, I.; Quilliam, M. A.; Walter, J. A. Anal. Chem. 2005, 77, 3123−3131.
(40) Coplen, T. Pure Appl. Chem. 1994, 66 (2), 273−276. (41) Brand, W. A.; Coplen, T. B.; Vogl, J.; Rosner, M.; Prohaska, T.
Pure Appl. Chem. 2014, 86 (3), 425.
(42) Possolo, A.; Toman, B. Metrologia 2007, 44 (6), 464. (43) Toman, B.; Nelson, M. A.; Lippa, K. A. Metrologia 2016, 53, 1193−1203.
(44) Lunn, D. J.; Spiegelhalter, D.; Thomas, A.; Best, N. Stat. Med. 2009, 28, 3049−3082.
(45) Lafarge, T.; Possolo, A. NIST Uncertainty Machine. http://
uncertainty.nist.gov/(Accessed: April 2018).
(46) Margolis, S. A. Anal. Chem. 1997, 69, 4864−4871.
(47) Standard Practice for Measuring and Reporting Performance of
Fourier-Transform Nuclear Magnetic Resonance (FT-NMR) Spec-tromters for Liquid Samples; ASTM Standard E2977−15; ASTM International: West Conshohocken, PA, USA, 2015.
Analytical Chemistry Article
DOI:10.1021/acs.analchem.8b02575 Anal. Chem. 2018, 90, 10510−10517 10517