HAL Id: hal-01848461
https://hal.archives-ouvertes.fr/hal-01848461
Submitted on 25 Feb 2019
HAL is a multi-disciplinary open access
archive for the deposit and dissemination of
sci-entific research documents, whether they are
pub-lished or not. The documents may come from
teaching and research institutions in France or
abroad, or from public or private research centers.
L’archive ouverte pluridisciplinaire HAL, est
destinée au dépôt et à la diffusion de documents
scientifiques de niveau recherche, publiés ou non,
émanant des établissements d’enseignement et de
recherche français ou étrangers, des laboratoires
publics ou privés.
Ion Sieving Effects in Chemically Tuned Pillared
Graphene Materials for Electrochemical Capacitors
Harish Banda, Barbara Daffos, Sandy Périé, Yves Chenavier, Lionel Dubois,
David Aradilla, Stephanie Pouget, Patrice Simon, Olivier Crosnier,
Pierre-Louis Taberna, et al.
To cite this version:
Harish Banda, Barbara Daffos, Sandy Périé, Yves Chenavier, Lionel Dubois, et al.. Ion Sieving
Effects in Chemically Tuned Pillared Graphene Materials for Electrochemical Capacitors. Chemistry of
Materials, American Chemical Society, 2018, 30 (9), pp.3040-3047. �10.1021/acs.chemmater.8b00759�.
�hal-01848461�
OATAO is an open access repository that collects the work of Toulouse
researchers and makes it freely available over the web where possible
Any correspondence concerning this service should be sent
to the repository administrator:
tech-oatao@listes-diff.inp-toulouse.fr
This is an author’s version published in:
http://oatao.univ-toulouse.fr/21788
To cite this version:
Banda, Harish and Daffos, Barbara
and Périé, Sandy and Chenavier, Yves and
Dubois, Lionel and Aradilla, David and Pouget, Stéphanie and Simon, Patrice
and Crosnier, Olivier and Taberna, Pierre-Louis
and Duclairoir, Florence Ion
Sieving Effects in Chemically Tuned Pillared Graphene Materials for
Electrochemical Capacitors. (2018) Chemistry of Materials, 30 (9). 3040-3047.
ISSN 0897-4756
Ion Sieving E
ffects in Chemically Tuned Pillared Graphene Materials
for Electrochemical Capacitors
Harish Banda,
*
,†Barbara Daffos,
§,⊥Sandy Pe
́rié,
†Yves Chenavier,
†Lionel Dubois,
†David Aradilla,
†Stéphanie Pouget,
‡Patrice Simon,
§,⊥Olivier Crosnier,
∥Pierre-Louis Taberna,
§,⊥and Florence Duclairoir
*
,††
Univ. Grenoble Alpes, CEA, CNRS, INAC, SyMMES, Grenoble 38000, France
‡Univ. Grenoble Alpes, CEA, CNRS, INAC, MEM, Grenoble 38000, France
§CIRIMAT, Universite
́ de Toulouse, CNRS, INPT, UPS, 31062 Toulouse, France
∥
Institut des mate
́riaux Jean Rouxel (IMN), Univ. de Nantes, CNRS, Nantes 44300, France
⊥
Re
́seau sur le Stockage Electrochimique de l’Energie (RS2E), FR CNRS 3459, Amiens 80039, France
*
S Supporting InformationABSTRACT:
Supercapacitors o
ffer high power densities but
require further improvements in energy densities for widespread
commercial applications. In addition to the conventional strategy
of using large surface area materials to enhance energy storage,
recently, matching electrolyte ion sizes to material pore sizes has
been shown to be particularly e
ffective. However, synthesis and
characterization of materials with precise pore sizes remain
challenging. Herein, we propose to evaluate the layered structures
in graphene derivatives as being analogous to pores and study the
possibility of ion sieving. A class of pillared graphene based
materials with suitable interlayer separation were synthesized, readily characterized by X-ray di
ffraction, and tested in various
electrolytes. Electrochemical results show that the interlayer galleries could indeed sieve electrolyte ions based on size
constrictions: ions with naked sizes that are smaller than the interlayer separation access the galleries, whereas the larger ions are
restricted. These
first observations of ion sieving in pillared graphene-based materials enable efficient charge storage through
optimization of the d-spacing/ion size couple.
■
INTRODUCTION
Electrical double-layer capacitors, commonly known as
super-capacitors (SCs), store energy through reversible adsorption of
electrolytic ions on the charged electrode surfaces.
1The
non-faradaic nature of this charge storage enables supercapacitors to
have high power densities and long cycle lives.
2As an undesired
consequence, non-faradaic charge storage also results in
typically low energy densities in SCs.
3Hence, porous carbon
materials [e.g., activated carbons (ACs) and templated carbons]
with large speci
fic surface areas (SSAs) and good electrical
conductivities are typically studied as electrode materials for
improved energy densities.
4,5However, the traditional beliefs
about the large surface area of the material being a unique
strategy for maximized charge storage needed to be
reconsidered when complementary storage mechanisms were
discovered in nanopores (<1 nm).
6Following the work by
Aurbach et al. on selective electrosorption of ions based on size
(ion sieving),
7researchers have reported the capacitance
contribution from these nanopores in SCs.
8,9Extensive work
on carbide-derived carbons (CDCs)
10and ACs has since
revealed that the nanopores o
ffer more efficient charge storage
by con
fining the electrolytic ions and thereby restricting
excessive charge screening by solvent molecules.
4,11These
studies also revealed that the ions access such narrow pores by
shedding a part of their solvation spheres.
12,13Recent studies
using Electrochemical Quartz Crystal Microbalance (EQCM)
14and Nuclear Magnetic Resonance (NMR) techniques have
quantitatively con
firmed such desolvation.
15,16Several reports have since studied charge storage in
nanopores and proposed that the maximum speci
fic
capaci-tances are obtained when ion sizes and pore sizes match.
17,18In
particular, it was also shown that a narrow pore size distribution
(PSD) of a carbon material is essential for such observations.
19However, only a few carbons, such as CDCs and some ACs,
display narrow PSDs.
4Furthermore, reliable determination of
PSDs from gas adsorption studies remains difficult as the
density functional theory-based approaches require prior
knowledge of the pore geometry and heat of adsorption of
the material.
4To that end, combinations of characterization
and modeling techniques using NMR and small-angle X-ray
scattering are being used to allow unambiguous pore size and
geometry determination.
20−22In parallel, research on graphene
derivatives for SCs has shown potential in their large surface
areas, electrical conductivities, and mechanical
flexibilities.
23,24However, in the context of material porosity for charge storage,
much of the current research in graphene derivatives is devoted
to improving the morphology with a focus on interparticle
porosity,
25similar to the research on ACs. Surprisingly, little
attention has been devoted to exploring the unique layered
structures of graphene derivatives in SCs. Although the natural
graphitic spacing of 0.33 nm, de
fined as the intrinsic
intraparticular pore, could be narrow for some ions in SCs,
graphene derivatives are known to exhibit expanded layered
structures (extrinsic intraparticular pores).
26These expanded
layered structures could be precisely tuned, and the d-spacing
values describing interlayer distances could readily be evaluated
using X-ray di
ffraction (XRD). Recent study of
electrochemi-cally exfoliated graphene oxide (GO)
films showed enhanced
capacitances when the d-spacing matched the ion sizes. This in
situ study o
ffers a proof of concept for the impact of d-spacing
in SCs, but the low capacitance values of
∼1 F g
−1mandate
further improvements.
27Few other reports have studied
pillared graphene based materials in SCs, but the enhanced
performances could be related to only the improved
hierarchical porosity.
28,29In this context, herein, we study the electrosorption of ions in
pillared graphene materials with varied interlayer distances. An
analysis of such materials would test the possibility of ion
sieving and, thereby, ion con
finement in the interlayer galleries
for e
fficient charge storage. A class of materials using GO as a
precursor and alkyl diamines as covalent pillars were
synthesized and then chemically reduced to yield suitable
electrical and morphological characteristics for SCs. XRD
patterns of the synthesized materials gave evidence of the
expanded structures with determination of the respective
d-spacing values. Extensive electrochemical characterization was
performed in SCs using electrolytes containing constant anion
but varied cation sizes. The observed electrochemical responses
clearly show limitations in ion adsorption based on size
constrictions, and a direct correlation between d-spacing values
and ion sizes was noted. These
first results for ion sieving in
pillared graphene materials could help us readily design and
develop materials for optimized charge storage in SCs.
Scheme 1. Representation for the Synthesis of RPs
aaFor the sake of simplicity, the materials are depicted with single graphene sheets.
Figure 1.(a) Thermogravimetric analyses (50°C/min) under a N2atmosphere and (b) X-ray diffraction patterns of the synthesized materials. The two different regions in XRD are attributed to graphitic (G) and cross-linked (CL) domains. (c) RGO is schematically represented with the G domain, and (f) 6 RP is shown with both G and CL domains. (d) N2sorption isotherms recorded at 77 K and (e) pore size distributions calculated using nonlocal density functional theory for RGO and RPs.
■
MATERIALS AND CHARACTERIZATION
Material Design. GO has long been studied as a perfect precursor for various graphene-like materials, because of its surface function-alities that offer abundant chemical tenability.30 GO is characterized with randomly distributed oxygen-containing functional groups, and it is believed that the epoxy and hydroxyl groups lie above and below each layer whereas the carboxylic groups are on the edges.31This rich surface chemistry allows covalent bonding of GO sheets with an organic linker. In particular, a bifunctional linker bearing its reactive functions at both ends is used to cross-link two sheets together.32For example, alkyl diamines, very reactive toward epoxide groups, have been shown to be effective in forming pillared materials with tunable interlayer distances.32,33 Hence, we use diamines with varied alkyl chain lengths (5, 6, and 8) to obtain the necessary d-spacing values for this study. GO is electrically insulating, and reaction with the alkyl diamines could not ensure sufficiently high electrical conductivities of these pillared materials.34The obtained materials are thus chemically reduced using hydrazine to synthesize reduced pillared materials (RPs). Depending on the diamine used in the first step, RPs are named 5 RP (1,5-diaminopentane), 6 RP (1,6-diaminohexane), and 8 RP (1,8-diaminooctane) (Scheme 1). As a control, reduced graphene oxide (RGO) is also made by reduction of GO. Notably, as the GO precursor is not specifically treated to obtain single GO sheets, it is likely that each graphene layer in the synthesized materials consists of a few sheets rather than a single graphene sheet.
Experimental Section. GO synthesis was achieved through a modified Hummers and Offeman’s method.42,43An aqueous solution of well-dispersed 5 mg/mL GO was prepared and used as a precursor for further syntheses. The initial synthesis of pillared materials, named Ps, involves a straightforward reaction between various diamines and GO solution (Scheme 1). 5 P, 6 P, and 8 P were synthesized using 1,5-diaminopentane, 1,6-diaminohexane, and 1,8-diaminooctane, respec-tively. Atfirst, 150 mL of a GO solution and 57 mmol of each diamine were mixed and sonicated for 10 min. The mixtures were then heated at 80 °C for 24 h while being continuously stirred. The reaction mixtures were then filtered, cleaned with an excess of water and ethanol, and dried overnight under a vacuum at 100°C. The obtained pillared materials were further reduced by being treated with an excess of hydrazine hydrate at 90 °C for 24 h while being continuously stirred. The obtained reduced pillared materials were cleaned with an excess of water, dried under a vacuum at 100°C, and labeled as the respective RPs (5 RP, 6 RP, and 8 RP). As a control to the RPs, RGO was also synthesized by treating GO with hydrazine hydrate. For reliable comparisons, the two-step protocol described above was followed for RGO, as well.
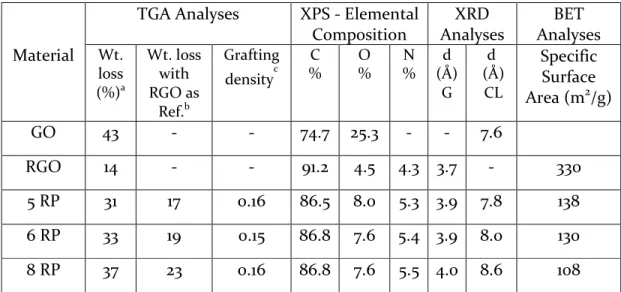
Characterization. The physicochemical properties of the synthe-sized materials were characterized using various techniques, and the porosity characteristics were analyzed using scanning electron microscopy (SEM) and gas sorption studies. The thermal degradation responses of the materials were obtained using thermogravimetric analysis (TGA) and are shown inFigure 1a. Consistent with previous reports,30,35GO displays a two-step weight loss profile with the first removal of the adsorbed water occurring below 100°C and an abrupt weight loss around 200°C corresponding to decomposition of surface oxygen functional groups. Additionally, a steady loss beyond 200°C is also seen because of the gradual removal of stable functionalities. Upon reaction of GO with hydrazine, the abrupt weight loss and moisture removal are no longer seen, suggesting an efficient chemical reduction. Synthesized via a two-step process, RPs also show no removal of moisture or oxygen functionalities but exhibit a gradual weight loss between 300 and 500°C. Such gradual weight losses at temperatures above the boiling points of the respective diamines are attributed to the removal of nonlabile diamine species.35Hence, TGA shows the presence of diamine linkers and an absence of labile oxygen functional groups in RPs. Furthermore, a careful analysis of the weight losses identifies similar diamine grafting densities in all three RPs (Table S1).
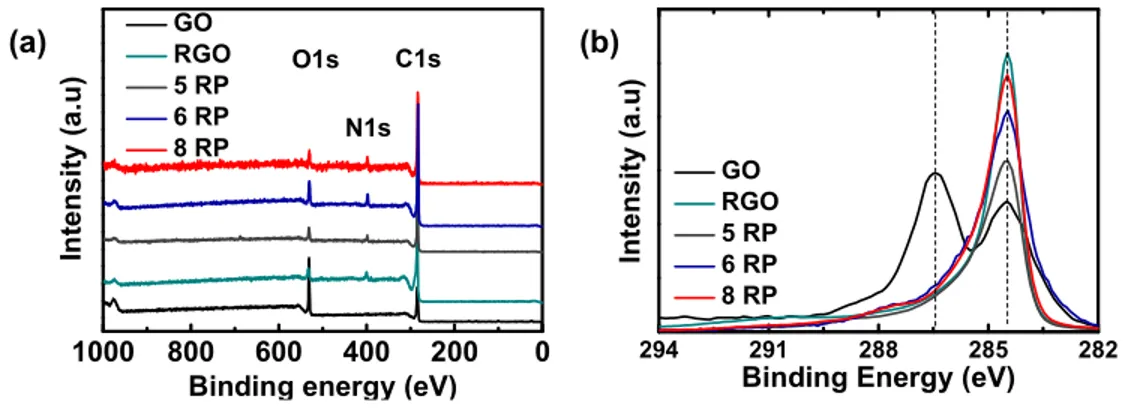
X-ray photoelectron spectroscopy (XPS) was performed to analyze the surface elemental composition of the synthesized materials. The
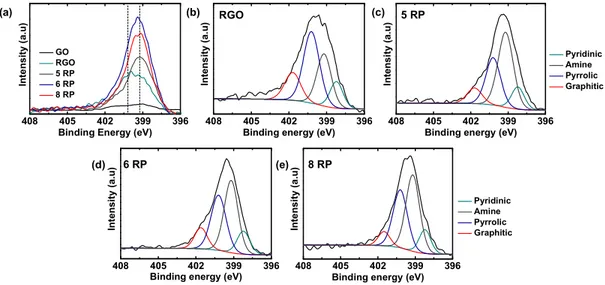
survey spectra of the materials indicate the presence of C, N, and O elements, with GO showing O intensities significantly higher than and N intensities significantly lower than others (Figure S1a). High-resolution C 1s spectra of the materials show two main peaks at 284.5 and 286.5 eV for GO, whereas RGO and RPs have a single main peak at 284.5 eV (Figure S1b). The observed C 1s signals were deconvoluted and assigned as CC/C−C (284.5 eV), C−OH (285.9 eV), alkoxy/epoxy (286.5 eV), and carbonyl components (288.3 eV) based on earlier reports (Figure S2).30GO exhibits a highly oxidized nature in the presence of various oxygen-containing functional groups and the predominant peak corresponding to alkoxy/epoxy groups; on the other hand, RGO and RPs show a significant decrease in oxygen functionalities, and the predominant peak is assigned to CC/C−C. In addition, a new peak at 285.6 eV corresponding to C−N was observed. The surface elemental compositions obtained from survey spectra show a decrease in O content from 26% in GO to 4−8% in RGO and RPs with an additional incorporation of 4−6% N. These observations indicate efficient reduction of oxygen functionalities and incorporation of N groups into RGO and RPs. High-resolution N 1s spectra reveal a very weak signal for GO and clear peaks, with varied positions, for RGO and RPs (Figure S3). Deconvolution of N signal could explain this shift in peak positions and the differences in N content between RGO and RPs. As evoked in the literature, the diamines could react and form covalent linkages with GO, resulting in amine N (399.2 eV), and instigate further internal rearrangements forming pyridinic (398.2 eV), pyrrolic (400.2 eV), and graphitic N (401.5 eV) components.35RGO shows a typical abundance of N in pyrrolic and graphitic rings because of the strong reducing nature of hydrazine, whereas RPs have a major contribution from amine N, owing to the incorporation of diamines, and thus show a shift in the peak position compared to that of RGO. These results reaffirm the presence of covalently linked diamines in RPs as also seen via TGA.
XRD patterns were obtained to directly analyze the layered structures of the synthesized materials (Figure 1b). Freeze-dried GO shows a sharp peak at 13.5° related to a d-spacing of 7.6 Å, indicating a high degree of oxidation in the starting material. RGO displays a broad peak at 28° corresponding to a graphite-like pattern (002), suggesting partial restacking of graphene sheets due to the removal of oxygen functionalities during chemical reduction. Synthesized in a two-step process, RPs exhibit diffraction patterns with two distinct peaks around 25−27° and 11−13° each. The broad peaks at larger angles correspond to graphite-like partial restacking and indicate a degree of reduction close to that of RGO. The relatively sharper peaks at smaller angles show a gradual increase in d-spacing from 7.8 Å (5 RP), 8.0 Å (6 RP), to 8.6 Å (8 RP) with increasing lengths of diamines used. Earlier studies have attributed these peaks to the expanded layered structures caused by intercalation of diamines between the graphene layers.32Although the d-spacing values relate to the diamines used, an exact prediction of d-spacing based on alkyl chain lengths is difficult to obtain as it requires knowledge of the local orientation and conformation of diamines.32 Additionally, the increased d-spacing values demonstrate intercalation of the linker between the graphene layers but do not confirm their covalent cross-linking. Swelling experiments were proposed in the literature as an indirect way to analyze the cross-linking of the graphene layers.32,33If the RPs were covalently linked by the diamine, they should resist swelling by solvents. XRD patterns of 8 RP after it had been soaked overnight in an ethanol/water solution remain unchanged and confirm that the intercalated diamine indeed covalently cross-links the layers (FigureS4a) as already suggested by TGA and XPS. In a parallel test with GO (Figure S4b), visible swelling and a shift in XRD peak positions are seen just after a few minutes in the solvent, thus highlighting the lack of cross-linking.
In summary, the synthesized materials could possess two different domains corresponding to graphitic-like (G) and cross-linked (CL) arrangements. The G domains are attributed to partially stacked graphene sheets with a d-spacing of∼3.5−4.0 Å, whereas CL domains relate to cross-linked graphene layers and are characterized by d-spacing values of 7.8−8.6 Å. RGO, synthesized as a control material,
has only the G stacking of the sheets (Figure 1c), whereas RPs have both G and CL domains coexisting in a random manner (Figure 1f). Additionally, the CL peaks in RPs could be seen to become narrow from 5 RP to 8 RP when larger diamines are used (Figure 1b). These sharper peaks with increased alkyl chain lengths probably arise from improved flexibilities of diamines that enable formation of larger particles. Hence, the CL peaks in XRD patterns evidence formation of expanded layered structures and also suggest varied particle sizes between RPs.
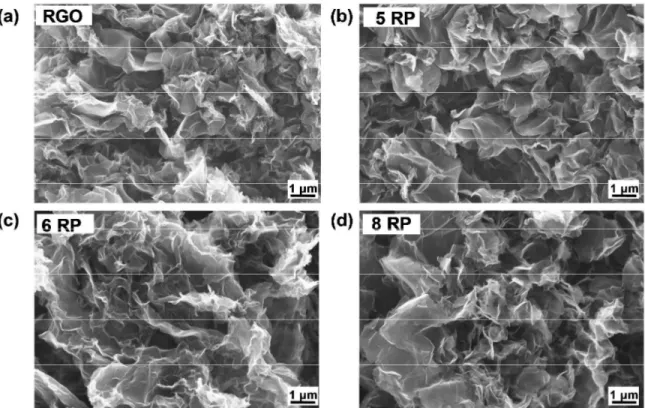
SEM images show a porous morphology for RGO and RPs without any obvious differences (Figure S5). The observed morphologies were then analyzed by N2sorption isotherms recorded at 77 K, and the SSA and PSDs were obtained using two-dimensional nonlocal density functional theory (NLDFT)36,37(details in the Supporting Informa-tion). The synthesized materials exhibit type II adsorption−desorption behavior with a hysteresis loop indicating the presence of micro- and mesopores (Figure 1d).29 RGO has the largest SSA of 330 m2 g−1, whereas RPs display lower SSA values, with values decreasing from 138 m2g−1in 5 RP to 130 m2g−1in 6 RP and 108 m2g−1in 8 RP (Table S1). There are two plausible reasons that the observed surface areas of RPs are smaller than those of RGO: (i) diamines increase the overall inactive weight of RPs, and (ii) the diamine pillars may sterically hinder the gas sorption and the interlayer gallery pores are rendered as closed pores.38 If the interlayer galleries indeed act as closed pores, surfaces of the graphene layers in the CL arrangement would be inaccessible and result in such lower SSA values. The calculated PSDs show significant contributions from micropores and the presence of mesopores in RGO, whereas the PSDs for RPs vary with the diamine used (Figure 1e andFigure S6). All RPs possess both types of pores, but with increasing chain lengths, the micropore content decreases and the mesopore content increases. This could be explained by the XRD patterns that suggested larger particle sizes in RPs with larger diamines resulting in such mesoporosity.
The characterization techniques mentioned above describe RPs as being reduced, covalently linked, and morphologically suitable for application in SCs. TGA, XRD, and XPS showed the presence of diamines, while the swelling experiments provide evidence of cross-linking. SEM and gas sorption analyses attribute a porous morphology to RPs, and the PSD curves indicate the predominant presence of >1 nm pores with little or no contribution from smaller pores. The dearth
of such nanopores highlights RPs as ideal materials for studying the distinct impact of interlayer galleries on SC performance. Furthermore, the cross-linked galleries have d-spacing values in the range of sizes for the commonly used electrolyte ions and thus offer a good template for studies in SCs.
■
ELECTROCHEMICAL STUDIES
The ion sieving behavior of these reduced pillared graphene
materials was studied in SCs by using a range of electrolytes
with varying ion sizes. Tetraalkylammonium tetra
fluoroborate
(TAABF
4) salt solutions (1 M) in acetonitrile with a constant
anion size and varying cation sizes [ethyl (TEA
+, 0.68 nm),
propyl (TPA
+, 0.76 nm), butyl (TBA
+, 0.82 nm), and hexyl
(THA
+, 0.95 nm)]
39were used as electrolytes. A
three-electrode con
figuration in SCs was adapted to study the
individual electrode responses. Cyclic voltammograms (CVs)
were acquired by scanning the cells from open-circuit potential
(OCV
∼ 0.1 V) to positive and negative terminal potentials
separately to record the distinct anion and cation sorption
responses. For ease of comparison, all CVs are normalized with
the respective currents at 0.1 V versus Ag and the curves are
denoted with their respective d-spacing values: 0.78 nm for 5
RP, 0.80 nm for 6 RP, and 0.86 nm for 8 RP.
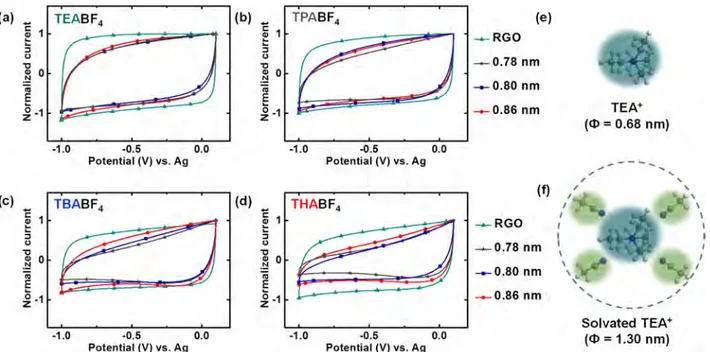
Figure 2
shows the CVs obtained for RGO and RPs in
various TAABF
4electrolytes at a scan rate of 20 mV s
−1in the
potential range from
−1.0 to 0.1 V versus Ag. These scans from
OCV to negative potentials mainly relate to the adsorption/
desorption responses of TAA
+cations. When tested with the
TEABF
4electrolyte (
Figure 2
a), all the materials showed nearly
rectangular curves with no speci
fic features suggesting an ideal
double-layer charge storage mechanism. Upon using a slightly
larger cation with the TPABF
4electrolyte (
Figure 2
b), the CV
curves of the materials remain comparable except for that of 5
RP, which indicates a slight reduction in current at the negative
terminal potential. When we move to an even larger cation in
TBABF
4, both 5 RP and 6 RP show a steep reduction in current
Figure 2.Normalized CVs of RGO and RPs obtained at a scan rate of 20 mV s−1in the voltage range of 0.1 to−1.0 V vs Ag using 1 M solutions of (a) TEABF4 (Φ = 0.68 nm), (b) TPABF4(Φ = 0.76 nm), (c) TBABF4(Φ = 0.82 nm), and (d) THABF4(Φ = 0.95 nm) in acetonitrile as electrolytes. (e and f) Naked and solvated TEA+ species and their diameters, respectively. The chosen voltage window maintains negative polarization in the materials and ensures adsorption and desorption of mainly the cation.
at lower potentials whereas 8 RP remains mostly unchanged
(
Figure 2
c). Finally, when the largest cation is tested using
THABF
4, all the RPs display signi
ficantly decreased currents
(
Figure 2
d). Moreover, the asymmetric shapes of CVs indicate
that these limitations in currents at negative terminal potentials
are not consequences of poor electrical or ionic conductivities.
In turn, the behavior of RGO remains nearly unchanged
regardless of the electrolyte used. These behaviors for RGO
and RPs were also observed when CVs were recorded at scan
rates of 10 and 50 mV s
−1. The data given above clearly suggest
an explicit dependence of electrochemical responses from RPs
based on the size of cations used. This tunable ion accessibility
in RPs highlights them as sufficiently rigid layered structures
that can restrict ions that are larger than the d-spacing. As
already evidenced by TGA, XPS, and XRD, covalent interaction
between graphene and diamines is likely to be responsible for
this electrochemical behavior.
Studies of CDCs have noted such reductions in currents, i.e.,
the limitations in ion adsorption, when the naked electrolyte
ions are larger than the average pore sizes.
11In the study
presented here, though we observe a similar ion limitation, gas
sorption results have indicated a dearth of pores that are smaller
than the cations tested. However, as evoked earlier, the gas
sorption studies may deem the interlayer gallery pores in RPs as
closed pores that, nevertheless, could be accessible to ion
adsorption under polarization. Hence, the d-spacing values of
RPs were directly compared with the naked ion sizes by
plotting the electrochemical data as responses for each material
(
Figure S7
). 5 RP, with a d-spacing of 0.78 nm, shows a regular
CV in TEA
+(0.68 nm), but an increasing limitation in ion
adsorption is seen from TPA
+(0.76 nm) to THA
+(0.95 nm). 6
RP is characterized by a d-spacing of 0.80 nm, and it allows
TEA
+or TPA
+but limits TBA
+and THA
+cations. 8 RP
behaves similarly by limiting THA
+that is larger than its
d-spacing of 0.86 nm. These observations clearly show that the
cations are limited in RPs when the naked ion sizes are larger
than the interlayer distances. Conversely, the cations enter the
gallery pores of RPs when their naked ion sizes are smaller
(
Figure 2
e). Meanwhile, RGO shows no limitations indicating
that ion adsorption occurs only in the interparticle porosity.
Additionally, RGO shows perfect rectangular curves compared
to those of RPs probably because of its superior electrical and
ionic conductivities owing to a lack of diamine residues.
35The electrosorption behavior of BF
4−anions was analyzed by
performing CVs in the positive voltage window from 0.1 to 1.0
V versus Ag (
Figure 3
). Unlike the behavior under negative
polarization, RGO and RPs both show nearly rectangular curves
in all the electrolytes indicating no limitation for the BF
4−anion. Similar results were recorded when CVs were acquired at
scan rates of 10 and 50 mV s
−1. CVs were then recorded in the
full potential window of
−1.0 to 1.0 V versus Ag and were
shown to correspond to the behavior of each material in
di
fferent electrolytes (
Figures S8 and S9
). RGO shows identical
half-curves on both sides of the OCV, suggesting no speci
fic
di
fference for TAA
+or BF
4−
adsorption (
Figure S8a
). RPs also
display identical half-curves when both naked ion sizes are
smaller than the d-spacing values, but if the cation size is larger,
a clear distinction could be seen between the two halves of a
CV. For instance, 6 RP shows an ideal CV curve with TEABF
4,
but distinct anion and cation adsorptions are seen in TBABF
4and THABF
4electrolytes (
Figure S8c
). The naked BF
4−anion
is smaller than the cross-linked galleries in RPs (
Figure 3
e) and
is not limited; on the other hand, the TAA
+cations vary in size
from 0.68 to 0.95 nm, and their adsorptions are limited by size
constrictions. Hence, these observations confirm that the
interlayer galleries in pillared graphene materials indeed sieve
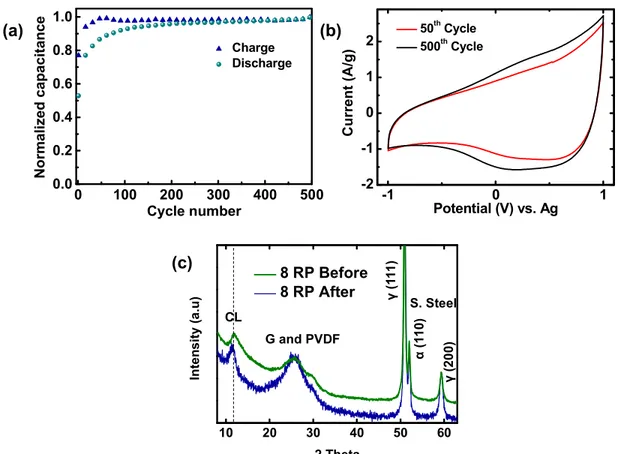
ions on the basis of sizes. Furthermore, the durability of the
diamine pillars was tested by cycling 8 RP in THABF
4electrolyte (
Figure S10
). CVs at the 50th and 500th cycles
show identical limitation for THA
+cations, and the XRD
patterns for the electrode before and after cycling remain
similar (
Figure S10b,c
). In particular, the presence of the CL
peak around 12
° before and after cycling confirms the retention
of the pillars. Besides the characterization conducted on the
Figure 3.Normalized CVs of RGO and RPs obtained at a scan rate of 20 mV s−1in the voltage range of 0.1−1.0 V vs Ag using 1 M solutions of (a) TEABF4, (b) TPABF4, (c) TBABF4, and (d) THABF4in acetonitrile as electrolytes. (e and f) Naked and solvated BF4−species and their diameters, respectively. The chosen voltage window maintains positive polarization in the materials and ensures adsorption and desorption of mainly the anion.
material, these electrochemical analyses performed under the
in
fluence of polarization provide additional proof of the
successful covalent anchoring of the diamine on graphene.
Otherwise, if the diamines were rather held by noncovalent
interactions, polarization of the electrodes during cycling would
lead to their release and to a structural change.
The direct relation between the naked ions and the d-spacing
values of RPs raises interesting questions about the ion
adsorption in gallery pores. Typically, an ion exists as a solvated
species in a solution, and the solvation number, thus the
solvated radii, depends on its interactions with the solvent.
11In
the study presented here, all the solvated TAA
+(TEA
+, 1.30
nm) and BF
4−(BF
4−, 1.16 nm) ions are larger than the
interlayer distances in RPs, and thus, they could access the
gallery pores only by partially shedding their solvation shells
(
Figures 2
f and
3
f). In fact, earlier work on porous carbons has
shown that the solvated electrolyte ions indeed enter smaller
pores as partially desolvated ions.
15Herein, we suggest a similar
partial desolvation for ions in the gallery pores of RPs.
However, advanced characterization using EQCM and NMR
techniques is required to quantitatively con
firm this partial
desolvation.
Speci
fic capacitances of RPs were calculated for both the
anion and cation adsorption from CVs at a scan rate of 20 mV
s
−1(
Figure 4
). For the cation adsorption, RGO exhibits close
capacitance values around 100 F g
−1in all four electrolytes,
underlining similar accessible electrochemical surface areas
(
Figure 4
a). In turn, RPs show comparable capacitances around
120 F g
−1in TEABF
4and exhibit lower capacitances when the
cations could no longer be adsorbed in the gallery pores. For
Figure 4.Schematic representation showing the limitation of TAA+cations moving into RPs based on size constrictions. For the sake of simplicity, RPs are shown as individual graphene sheets cross-linked together instead of layers of graphene sheets bridged together. Specific capacitances are calculated from CVs at a scan rate of 20 mV s−1for the cells tested in voltage ranges of (a)−1.0 to 0.1 V vs Ag and (b) 0.1 to 1.0 V vs Ag. Dashed lines are added as guides to the eye.
instance, 5 RP performs like other RPs in TEABF
4, but the
capacitance of 5 RP in TPABF
4steeply declines to fractional
values in THABF
4. 6 RP and 8 RP possess larger d-spacing
values and thus show a decline starting with TBABF
4and
THABF
4, respectively. Notably, even with this ion limitation in
RPs, some charge will always be stored rather than none as the
interparticle pores and the bulk porosity in the materials are still
accessible for ion sorption. For anion adsorption, RGO shows
similar capacitance values of
∼100 F g
−1in the four electrolytes
(
Figure 4
b). Because the anions are not limited, RPs also
exhibit close values in each electrolyte with a general trend of
lower capacitances from TEABF
4to THABF
4electrolytes.
Furthermore, the speci
fic capacitances obtained in the full
voltage window of
−1.0 to 1.0 V versus Ag mirror the results
seen for cations (
Figure S11
). RPs, with one-third of SSAs
compared to RGO, exhibit capacitances of
∼130 F g
−1in
TEABF
4, close to that of RGO, and emphasize that the gas
sorption analyses do not probe interlayer gallery pores in RPs
and hence underestimate the overall electrochemically active
surface area available. In other electrolytes, RPs exhibit a
decline in capacitance from TPABF
4to THABF
4as the cation
limitation becomes increasingly substantial. The overall lower
capacitances of RPs compared to those of RGO could also arise
for a couple of reasons: the incorporated alkyl chains contribute
to the 20% increase in weight in RPs, and RPs exhibit an
interparticle micropore volume that is smaller than that of
RGO.
This study brings to light the possibility of using pillared
graphene materials as reference materials for ion sieving and
electrochemical adsorption in the interlayer gallery pores of
structured graphene materials. The combination of XRD, gas
sorption, and electrochemical analyses allowed us to identify
the electrochemically active porosity in these systems. Although
the observed capacitances already occur in the range of that of
RGO and the current literature
40,41(
Table S2
), pillared
materials o
ffer tremendous possibilities for improvements in
both power and energy densities. Strategies such as using RPs
that are synthesized with a low density of pillars could improve
ionic di
ffusion and simultaneously ensure both higher power
and energy densities. Additionally, the conventional strategy of
developing hierarchical porosity in addition to the interlayer
galleries could also enhance ion accessibility and charge storage.
■
CONCLUSIONS
A class of reduced pillared graphene materials with tunable
interlayer galleries were readily synthesized using alkyl diamines
as cross-links. A family of tetraalkylammonium tetra
fluorobo-rate salts with constant anion and varying cation sizes in
acetonitrile were used as electrolytes in SCs. The observed
electrochemical responses for RGO show no ion speci
fic
limitation suggesting that the ion sorption occurs only in the
interparticle porosity, whereas RPs show limitations based on
size constrictions indicating that the ions mainly adsorb in the
interlayer gallery pores. Ions are limited if their naked sizes are
larger than the d-spacing of RP and thus show that the
interlayer galleries sieve ions on the basis of size. This direct
correlation between naked ion size and gallery spacing suggests
partial desolvation of the electrolyte ions during adsorption.
Further experiments using di
fferent solvents and
character-ization techniques are being analyzed to understand this
desolvation. These
first results of ion sieving in pillared
graphene materials could help us readily design and develop
strategies for optimized charge storage in SCs.
■
ASSOCIATED CONTENT
*
S Supporting InformationThe Supporting Information is available free of charge on the
ACS Publications website
at DOI:
10.1021/acs.chemma-ter.8b00759
.
Details of instrumentation, characterization techniques,
and additional electrochemical studies (
)
■
AUTHOR INFORMATION
Corresponding Authors*E-mail:
harish.banda@cea.fr
.
*E-mail:
florence.duclairoir@cea.fr
.
ORCIDPatrice Simon:
0000-0002-0461-8268Florence Duclairoir:
0000-0003-0257-0501 FundingH.B. is funded by French CEA. INAC/SyMMES, IMN, and
CIRIMAT laboratories received funding from the French ANR
program (SUGGEST-ANR-15-CE05-0022).
Notes
The authors declare no competing
financial interest.
■
ACKNOWLEDGMENTS
The access to mutually held equipment on PFNC Nano
characterization Minatec platforms was appreciated by the
authors. A. Benayad is thanked for his help with the
interpretation of XPS spectra. The authors are also grateful to
G. Bidan for fruitful discussions.
■
REFERENCES
(1) Conway, B. E. Electrochemical Supercapacitors: Scientific Fundamentals and Technological Applications; Springer, 1999.
(2) Simon, P.; Gogotsi, Y. Materials for Electrochemical Capacitors. Nat. Mater. 2008, 7, 845−854.
(3) Burke, A. R&D Considerations for the Performance and Application of Electrochemical Capacitors. Electrochim. Acta 2007, 53, 1083−1091.
(4) Béguin, F.; Presser, V.; Balducci, A.; Frackowiak, E. Carbons and Electrolytes for Advanced Supercapacitors. Adv. Mater. 2014, 26, 2219−2251.
(5) Zhang, L. L.; Zhao, X. S. Carbon-Based Materials as Supercapacitor Electrodes. Chem. Soc. Rev. 2009, 38, 2520−2531.
(6) Chmiola, J.; Yushin, G.; Gogotsi, Y.; Portet, C.; Simon, P.; Taberna, P. L. Anomalous Increase in Carbon Capacitance at Pore Sizes Less Than 1 Nanometer. Science 2006, 313, 1760−1763.
(7) Eliad, L.; Salitra, G.; Soffer, A.; Aurbach, D. Ion Sieving Effects in the Electrical Double Layer of Porous Carbon Electrodes: Estimating Effective Ion Size in Electrolytic Solutions. J. Phys. Chem. B 2001, 105, 6880−6887.
(8) Vix-Guterl, C.; Frackowiak, E.; Jurewicz, K.; Friebe, M.; Parmentier, J.; Béguin, F. Electrochemical Energy Storage in Ordered Porous Carbon Materials. Carbon 2005, 43, 1293−1302.
(9) Largeot, C.; Portet, C.; Chmiola, J.; Taberna, P.-L.; Gogotsi, Y.; Simon, P. Relation between the Ion Size and Pore Size for an Electric Double-Layer Capacitor. J. Am. Chem. Soc. 2008, 130, 2730−2731.
(10) Presser, V.; Heon, M.; Gogotsi, Y. Carbide-Derived Carbons− From Porous Networks to Nanotubes and Graphene. Adv. Funct. Mater. 2011, 21, 810−833.
(11) Chmiola, J.; Largeot, C.; Taberna, P.-L.; Simon, P.; Gogotsi, Y. Desolvation of Ions in Subnanometer Pores and Its Effect on Capacitance and Double-Layer Theory. Angew. Chem., Int. Ed. 2008, 47, 3392−3395.
(12) Merlet, C.; Rotenberg, B.; Madden, P. A.; Taberna, P.-L.; Simon, P.; Gogotsi, Y.; Salanne, M. On the Molecular Origin of
Supercapacitance in Nanoporous Carbon Electrodes. Nat. Mater. 2012, 11, 306−310.
(13) Merlet, C.; Péan, C.; Rotenberg, B.; Madden, P. A.; Daffos, B.; Taberna, P.-L.; Simon, P.; Salanne, M. Highly Confined Ions Store Charge More Efficiently in Supercapacitors. Nat. Commun. 2013, 4, 3701−3707.
(14) Levi, M. D.; Salitra, G.; Levy, N.; Aurbach, D.; Maier, J. Application of a Quartz-Crystal Microbalance to Measure Ionic Fluxes in Microporous Carbons for Energy Storage. Nat. Mater. 2009, 8, 872−875.
(15) Tsai, W.-Y.; Taberna, P.-L.; Simon, P. Electrochemical Quartz Crystal Microbalance (EQCM) Study of Ion Dynamics in Nanoporous Carbons. J. Am. Chem. Soc. 2014, 136, 8722−8728.
(16) Griffin, J. M.; Forse, A. C.; Tsai, W.-Y.; Taberna, P.-L.; Simon, P.; Grey, C. P. In Situ NMR and Electrochemical Quartz Crystal Microbalance Techniques Reveal the Structure of the Electrical Double Layer in Supercapacitors. Nat. Mater. 2015, 14, 812−819.
(17) Zhou, J.; Li, Z.; Xing, W.; Shen, H.; Bi, X.; Zhu, T.; Qiu, Z.; Zhuo, S. A New Approach to Tuning Carbon Ultramicropore Size at Sub-Angstrom Level for Maximizing Specific Capacitance and CO2 Uptake. Adv. Funct. Mater. 2016, 26, 7955−7964.
(18) Salanne, M.; Rotenberg, B.; Naoi, K.; Kaneko, K.; Taberna, P.-L.; Grey, C. P.; Dunn, B.; Simon, P. Efficient Storage Mechanisms for Building Better Supercapacitors. Nat. Energy 2016, 1, 16070.
(19) Kondrat, S.; Pérez, C. R.; Presser, V.; Gogotsi, Y.; Kornyshev, A. A. Effect of Pore Size and Its Dispersity on the Energy Storage in Nanoporous Supercapacitors. Energy Environ. Sci. 2012, 5, 6474−6479. (20) Palmer, J. C.; Llobet, A.; Yeon, S.-H.; Fischer, J. E.; Shi, Y.; Gogotsi, Y.; Gubbins, K. E. Modeling the Structural Evolution of Carbide-Derived Carbons Using Quenched Molecular Dynamics. Carbon 2010, 48, 1116−1123.
(21) Boukhalfa, S.; Gordon, D.; He, L.; Melnichenko, Y. B.; Nitta, N.; Magasinski, A.; Yushin, G. In Situ Small Angle Neutron Scattering Revealing Ion Sorption in Microporous Carbon Electrical Double Layer Capacitors. ACS Nano 2014, 8, 2495−2503.
(22) Bañuelos, J. L.; Feng, G.; Fulvio, P. F.; Li, S.; Rother, G.; Dai, S.; Cummings, P. T.; Wesolowski, D. J. Densification of Ionic Liquid Molecules within a Hierarchical Nanoporous Carbon Structure Revealed by Small-Angle Scattering and Molecular Dynamics Simulation. Chem. Mater. 2014, 26, 1144−1153.
(23) Raccichini, R.; Varzi, A.; Passerini, S.; Scrosati, B. The Role of Graphene for Electrochemical Energy Storage. Nat. Mater. 2015, 14, 271−279.
(24) Stoller, M. D.; Park, S.; Zhu, Y.; An, J.; Ruoff, R. S. Graphene-Based Ultracapacitors. Nano Lett. 2008, 8, 3498−3502.
(25) Li, C.; Shi, G. Functional Gels Based on Chemically Modified Graphenes. Adv. Mater. 2014, 26, 3992−4012.
(26) Inagaki, M.; Kang, F. Materials Science and Engineering of Carbon, 1st ed.; Butterworth-Heinemann, 2016.
(27) Galhena, D. T. L.; Bayer, B. C.; Hofmann, S.; Amaratunga, G. A. J. Understanding Capacitance Variation in Sub-Nanometer Pores by in Situ Tuning of Interlayer Constrictions. ACS Nano 2016, 10, 747− 754.
(28) Lee, K.; Yoon, Y.; Cho, Y.; Lee, S. M.; Shin, Y.; Lee, H.; Lee, H. Tunable Sub-Nanopores of Graphene Flake Interlayers with Conductive Molecular Linkers for Supercapacitors. ACS Nano 2016, 10, 6799−6807.
(29) Yuan, K.; Xu, Y.; Uihlein, J.; Brunklaus, G.; Shi, L.; Heiderhoff, R.; Que, M.; Forster, M.; Chassé, T.; Pichler, T. T.; et al. Straightforward Generation of Pillared, Microporous Graphene Frameworks for Use in Supercapacitors. Adv. Mater. 2015, 27, 6714−6721.
(30) Stankovich, S.; Dikin, D. A.; Piner, R. D.; Kohlhaas, K. A.; Kleinhammes, A.; Jia, Y.; Wu, Y.; Nguyen, S. T.; Ruoff, R. S. Synthesis of Graphene-Based Nanosheets via Chemical Reduction of Exfoliated Graphite Oxide. Carbon 2007, 45, 1558−1565.
(31) Dreyer, D. R.; Park, S.; Bielawski, C. W.; Ruoff, R. S. The Chemistry of Graphene Oxide. Chem. Soc. Rev. 2010, 39, 228−240.
(32) Herrera-Alonso, M.; Abdala, A. A.; McAllister, M. J.; Aksay, I. A.; Prud’homme, R. K. Intercalation and Stitching of Graphite Oxide with Diaminoalkanes. Langmuir 2007, 23, 10644−10649.
(33) Hung, W.-S.; Tsou, C.-H.; De Guzman, M.; An, Q.-F.; Liu, Y.-L.; Zhang, Y.-M.; Hu, C.-C.; Lee, K.-R.; Lai, J.-Y. Cross-Linking with Diamine Monomers To Prepare Composite Graphene Oxide-Frame-work Membranes with Varying d-Spacing. Chem. Mater. 2014, 26, 2983−2990.
(34) Li, D.; Muller, M. B.; Gilje, S.; Kaner, R. B.; Wallace, G. G. Processable Aqueous Dispersions of Graphene Nanosheets. Nat. Nanotechnol. 2008, 3, 101−105.
(35) Banda, H.; Aradilla, D.; Benayad, A.; Chenavier, Y.; Daffos, B.; Dubois, L.; Duclairoir, F. One-Step Synthesis of Highly Reduced Graphene Hydrogels for High Power Supercapacitor Applications. J. Power Sources 2017, 360, 538−547.
(36) Brunauer, S.; Emmett, P. H.; Teller, E. Adsorption of Gases in Multimolecular Layers. J. Am. Chem. Soc. 1938, 60, 309−319.
(37) Jagiello, J.; Olivier, J. P. 2D-NLDFT Adsorption Models for Carbon Slit-Shaped Pores with Surface Energetical Heterogeneity and Geometrical Corrugation. Carbon 2013, 55, 70−80.
(38) Srinivas, G.; Burress, J. W.; Ford, J.; Yildirim, T. Porous Graphene Oxide Frameworks: Synthesis and Gas Sorption Properties. J. Mater. Chem. 2011, 21, 11323−11329.
(39) Ue, M. Mobility and Ionic Association of Lithium and Quaternary Ammonium Salts in Propylene Carbonate and Γ-Butyrolactone. J. Electrochem. Soc. 1994, 141, 3336−3342.
(40) Zhang, L.; Zhang, F.; Yang, X.; Long, G.; Wu, Y.; Zhang, T.; Leng, K.; Huang, Y.; Ma, Y.; Yu, A.; Chen, Y. Porous 3D Graphene-Based Bulk Materials with Exceptional High Surface Area and Excellent Conductivity for Supercapacitors. Sci. Rep. 2013, 3, 1408.
(41) Zhu, Y.; Murali, S.; Stoller, M. D.; Ganesh, K. J.; Cai, W.; Ferreira, P. J.; Pirkle, A.; Wallace, R. M.; Cychosz, K. A.; Thommes, M.; et al. Carbon-Based Supercapacitors Produced by Activation of Graphene. Science 2011, 332, 1537−1541.
(42) Hummers, W. S.; Offeman, R. E. Preparation of Graphitic Oxide. J. Am. Chem. Soc. 1958, 80, 1339−1339.
(43) Ashok Kumar, N.; Gambarelli, S.; Duclairoir, F.; Bidan, G.; Dubois, L. Synthesis of High Quality Reduced Graphene Oxide Nanosheets Free of Paramagnetic Metallic Impurities. J. Mater. Chem. A 2013, 1, 2789−2794.
1
Supporting Information
Ion Sieving Effects in Chemically Tuned Pillared Graphene Materials for
Electrochemical Capacitors
Harish Banda,
†* Barbara Daffos,
¶,‡Sandy Périé,
†Yves Chenavier,
†Lionel Dubois,
†David Aradilla,
†Stéphanie Pouget,
±Patrice Simon,
¶,‡Olivier Crosnier,
§Pierre-Louis
Taberna
¶,‡and Florence Duclairoir
†*
Characterization techniques
The thermogravimetric analysis (TGA) of all samples were performed with Setaram
TGA 92 at a heating ramp rate of 5
oC/min from 30
oC to 800
oC under N
2atmosphere.
The crystallographic structures of the materials were determined by a wide-angle X-ray
diffraction (XRD) system on a Panalytical X'pert PRO X-ray diffractometer using a Co
Kα radiation source (λ=1.79 Å). X-ray photoelectron spectroscopy (XPS) analyses were
performed using a PHI Versa Probe II spectrometer with a monochromatized Al Kα
X-ray source (1486.6 eV) focalized to a spot of 100 µm and with an electron take-off angle
of θ = 45°. Survey spectra of the photo-emitted electrons were recorded with a pass
energy of 117 eV and the high-resolution spectra with a pass energy of 23.5 eV. The
deconvolution of C 1s and N 1s core-level spectra was performed by fitting the
individual components at values obtained from earlier reports by using Casa XPS
software
1. Spectra were fitted into Gaussian-Lorentzian (30) shaped curves with full
width at half maximum values kept under 1.5 in all cases. The morphology of the
materials was characterized using a Zeiss Ultra 55 electron microscope at an
accelerating voltage of 5 kV. Porosity characteristics were calculated from N
2sorption
isotherms measured at 77 K with Micromeritics ASAP 3020 porosimeter. Prior to the
analysis samples have been subjected to a degazing at 100°C for 24h. The adsorption
isotherms were obtained and the specific surface area and the pore size distributions
(PSD) were calculated by assuming a graphene-based structural framework and using a
2D non-local density functional theory (NLDFT) treatment of the fluid density in the
pores which are considered as energetically heterogeneous
2.
Electrochemical analysis
The synthesized materials were tested in a three-electrode supercapacitor
configuration with porous carbon (YP50) as counter, silver wire as reference electrodes
and a 25 μm thick cellulose sheet as a separator. Large porous carbon electrodes with
excess weight were used to counter the charges and ensure distinct responses from the
working electrodes. A custom-built Swagelok type cell was used to assemble the cell
components. The working electrodes were fabricated as a slurry by mixing active
materials, polyvinylidene fluoride (PVDF) and acetylene black carbon in a ratio of
80:10:10 using N-methyl-2-pyrrolidone and are coated onto 0.5 cm
2stainless steel disks.
The as prepared electrodes were dried at 65
oC in air for 3 h prior to drying under
vacuum at 120
oC overnight. The dried electrodes were noted to weigh 1 - 1.5 mg
resulting in loading densities of 2-3 mg/cm
2. 1M tetralkylammonium tetrafluoroborate
2
(TAABF
4) salt solutions in anhydrous acetonitrile with varying cations; ethyl (TEABF
4),
propyl (TPABF
4), butyl (TBABF
4) and hexyl (THABF
4), are used as electrolytes. The
performances of SC were evaluated using cyclic voltammetry (CV) at various scan
rates. A multichannel VMP3 potentiostat/galvanostat with EC-Lab software (Biologic)
was used for all electrochemical techniques. CV measurements were performed
between - 1 to 1 V vs. Ag. at scan rates of 10, 20 and 50 mV s
-1. The gravimetric
capacitances (C) were derived from CV curves using the equation C = (ʃ I(v).dv)
/(m(dv/dt).V), where ʃ I(v).dv is the total area under the curve in the potential
window, dv/dt is the scan rate, m is the mass of the active material in the working
electrode and V is the total potential window.
Table S1. Thermal gravimetric weight loss values, elemental composition values from
X-ray photoelectron spectroscopy and d-spacing obtained from X-ray diffraction
spectra for the synthesized materials. The grafting densities of the diamines in
different RPs were calculated by normalizing TGA weight losses with respect to RGO
and dividing by the respective diamine molecular weights. Weight losses at 800
oC
awere used for this calculation assuming that all the diamines in RPs would be degraded
by this temperature.
bWeight losses in RPs normalized with RGO as baseline.
c
Adjusted weight loss of RPs were divided by the respective diamine molecular weights
for a comparison of the amounts of diamine.
Material
TGA Analyses
XPS - Elemental
Composition
XRD
Analyses
BET
Analyses
Wt.
loss
(%)
aWt. loss
with
RGO as
Ref.
bGrafting
density
cC
%
O
%
N
%
d
(Å)
G
d
(Å)
CL
Specific
Surface
Area (m
2/g)
GO
43
-
-
74.7 25.3
-
-
7.6
RGO
14
-
-
91.2
4.5
4.3 3.7
-
330
5 RP
31
17
0.16
86.5
8.0
5.3 3.9
7.8
138
6 RP
33
19
0.15
86.8
7.6
5.4 3.9
8.0
130
8 RP
37
23
0.16
86.8
7.6
5.5 4.0
8.6
108
3
Figure S1. X-ray photoelectron (a) survey scans and (b) C 1s high-resolution spectra of
GO, RGO and RPs. The spectra indicate presence of C, N and O elements in the
materials with GO showing significantly higher O intensities compared to others.
Figure S2. C 1s high-resolution X-ray photoelectron spectra of (a) GO, (b) RGO, (c) 5
RP, (d) 6 RP and (e) 8 RPs. The signals from C atoms in different chemical
environments are deconvoluted as C-C/C=C (284.5 eV), C-N (285.6 eV), C-OH (285.9
eV), epoxy/alkoxy (286.5 eV) and carbonyl groups (288.3 eV).
1000 800 600 400 200 0 GO RGO 5 RP 6 RP 8 RP In te n s it y ( a .u ) O1s N1s
Binding energy (eV)
C1s 294 291 288 285 282 In te n s it y ( a .u ) GO RGO 5 RP 6 RP 8 RP
Binding Energy (eV)
(a)
(b)
294 291 288 285 282 C-C C-N O-C-O C=OBinding Energy (eV)
In te n s it y ( a .u ) 294 291 288 285 282 C-C C-OH O-C-O C=O
Binding Energy (eV)
In te n s it y ( a .u ) 294 291 288 285 282 C-C C-N O-C-O C=O
Binding Energy (eV)
In te n s it y ( a .u ) 294 291 288 285 282 C-C C-N O-C-O C=O
Binding Energy (eV)
In te n s it y ( a .u ) (e) (a) (b) (c) (d) GO RGO 5 RP 6 RP 8 RP 294 291 288 285 282 C-C C-N O-C-O C=O
Binding Energy (eV)
In te n s it y ( a .u )
4
Figure S3. (a) N 1s high-resolution X-ray photoelectron spectra of GO, RGO and RPs.
Deconvolutions of high resolution N 1s signal into pyridinic (398.2 eV), amine (399.2
eV), pyrrolic (400.2 eV), and graphitic (401.5 eV) components for (b) RGO, (c) 5 RP (d)
6 RP and (e) 8 RP.
Figure S4. (a) X-Ray diffraction spectra of 8 RP before and after soaking in 80%
ethanol-water solution for overnight, (b) X-Ray diffraction spectra of GO before and
after soaking in 80% ethanol-water solution for 5 minutes. Even after soaking
overnight in ethanol-water solution, XRD pattern of 8 RP remains unchanged
confirming that the presence of covalent crosslinks between the sheets. Visible
swelling and shift in XRD peak positions is seen in GO after just few minutes in solvent
and thus highlighting the lack of cross-linking.
10 20 30 40 50 Wet GO Dry GO 2 Theta In te n s it y ( a .u ) 10 20 30 40 50 Wet 8 RP Dry 8 RP 2 Theta In te n s it y ( a .u )
(a)
(b)
408 405 402 399 396 Pyridinic Amine Pyrrolic Graphitic In te n s it y ( a .u )Binding energy (eV) 408 405 402 399 396 GO RGO 5 RP 6 RP 8 RP
Binding Energy (eV)
In te n s it y ( a .u ) 408 405 402 399 396 In te n s it y ( a .u )
Binding energy (eV)
408 405 402 399 396 In te n s it y ( a .u )
Binding energy (eV)
408 405 402 399 396 Pyridinic Amine Pyrrolic Graphitic In te n s it y ( a .u )
Binding energy (eV) (b) (e) (c) (d) (a) RGO 5 RP 6 RP 8 RP
5
Figure S5. Scanning electron microscopy images of (a) RGO, (b) 5 RP, (c) 6 RP and (d)
8 RP.
Figure S6. Cumulative porous volumes of the synthesized materials.
0
10
20
30
0.0
0.2
0.4
0.6
0.8
1.0
RGO 5 RP 6 RP 8 RPV
o
lu
m
e
(
c
c
/g
)
Pore Width (nm)
6
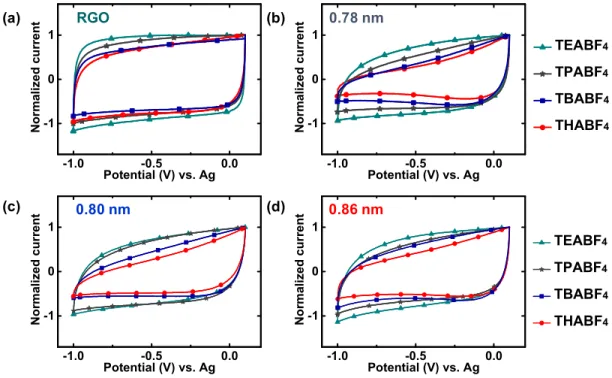
Figure S7. Normalized CVs of (a) RGO (b) 5 RP (d = 0.78 nm), (c) 6 RP (d = 0.80 nm)
and (d) 8 RP (d = 0.86 nm) obtained using various 1 M TAABF
4/ acetonitrile
electrolytes at a scan rate of 20 mV s
-1in the voltage range of -1.0 V to 0.1 V vs. Ag. RGO
lacks nanopores or cross-linked interlayer galleries and hence does not show any
specific limitation to TAA
+cations.
-1.0 -0.5 0.0 -1 0 1 TEABF4 TPABF4 TBABF4 THABF4 N o rm a li z e d c u rr e n t Potential (V) vs. Ag -1.0 -0.5 0.0 -1 0 1 N o rm a li z e d c u rr e n t Potential (V) vs. Ag -1.0 -0.5 0.0 -1 0 1 TEABF4 TPABF4 TBABF4 THABF4 N o rm a li z e d c u rr e n t Potential (V) vs. Ag -1.0 -0.5 0.0 -1 0 1 N o rm a li z e d c u rr e n t Potential (V) vs. Ag (a) (d) (b) (c) RGO 0.78 nm 0.86 nm 0.80 nm
7
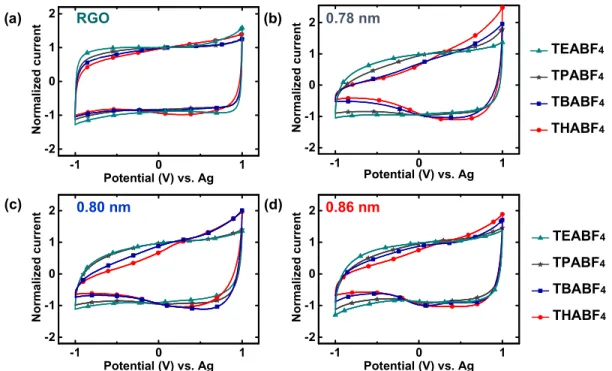
Figure S8. Normalized CVs of (a) RGO (b) 5 RP (d = 0.78 nm), (c) 6 RP (d = 0.80 nm)
and (d) 8 RP (d = 0.86 nm) obtained using various 1 M TAABF
4/ acetonitrile
electrolytes at a scan rate of 20 mV s
-1in the voltage range of -1.0 V to 1.0 V vs. Ag. RGO
lacks pores or inter layer galleries spacing below 1 nm and hence doesn’t show any
specific limitation to TAA
+cations.
-1 0 1 -2 -1 0 1 2 N o rm a li z e d c u rr e n t Potential (V) vs. Ag -1 0 1 -2 -1 0 1 2 TEABF4 TPABF4 TBABF4 THABF4 N o rm a li z e d c u rr e n t Potential (V) vs. Ag (a) (d) (b) (c) RGO 0.78 nm 0.86 nm 0.80 nm -1 0 1 -2 -1 0 1 2 N o rm a li z e d c u rr e n t Potential (V) vs. Ag -1 0 1 -2 -1 0 1 2 TEABF4 TPABF4 TBABF4 THABF4 N o rm a li z e d c u rr e n t Potential (V) vs. Ag
8
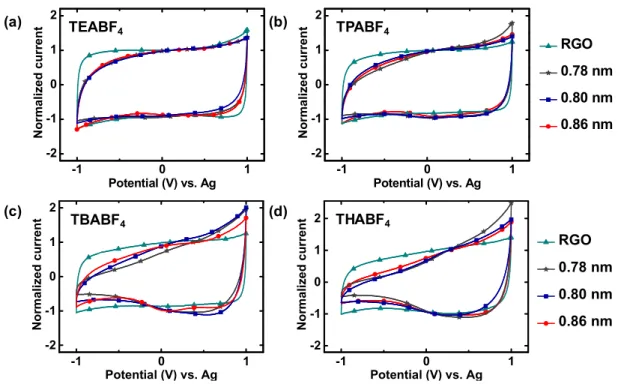
Figure S9. Normalized CVs of RGO and RPs obtained at scan rates of 20 mV s
-1in the
voltage range of -1.0 V to 1.0 V vs. Ag using 1 M solutions of (a) TEABF
4(Ф= 0.68 nm),
(b) TPABF
4(Ф= 0.76 nm), (c) TBABF
4(Ф= 0.82 nm), and (d) THABF
4(Ф= 0.95 nm) in
acetonitrile as electrolytes.
-1 0 1 -2 -1 0 1 2 N o rm a li ze d c u rr e n t Potential (V) vs. Ag -1 0 1 -2 -1 0 1 2 RGO 0.78 nm 0.80 nm 0.86 nm N o rm a li ze d c u rr e n t Potential (V) vs. Ag -1 0 1 -2 -1 0 1 2 N o rm a li z e d c u rr e n t Potential (V) vs. Ag -1 0 1 -2 -1 0 1 2 RGO 0.78 nm 0.80 nm 0.86 nm N o rm a li z e d c u rr e n t Potential (V) vs. Ag (a) (d) (b) (c) TEABF4 TPABF4 TBABF4 THABF49
Figure S10. (a) Normalized charge-discharge capacitances of 8RP obtained from CVs in
1M THABF
4/AN at 50 mV/s scan rate in the potential range of -1 to 1 V vs. Ag over 500
cycles. (b) CV curves for the 50
thand the 500
thcycles and (c) Ex-situ XRD patterns of 8
RP electrode before and after 500 CV cycles at 50 mV/s scan rate in the potential range
of -1 to 1 V vs. Ag. Cross-linking (CL) peak is retained even after 500 CV cycles. In
addition, peaks corresponding to PVDF binder and stainless steel current collector are
also seen.
Figure S11. Specific capacitances are calculated from CVs at 20 mV s
-1for the cells tested
in the voltage range of -1.0 V to 1.0 V vs. Ag. Values are shown with (a) variation in the
electrolyte and (b) change in the material.
0 30 60 90 120 150 RGO 0.78 nm 0.80 nm 0.86 nm G ra v im e tr ic C a p a c it n a c e ( F /g ) THABF4 TBABF4 TPABF4 TEABF4 RGO d=0.78 d=0.80 d=0.86 0 30 60 90 120 150 TEABF4 TPABF4 TBABF4 THABF4 G ra v im e tr ic C a p a c it n a c e ( F /g ) (a) (b) -1 0 1 -2 -1 0 1 2 50 th Cycle 500th Cycle C u rr e n t (A /g ) Potential (V) vs. Ag 0 100 200 300 400 500 0.0 0.2 0.4 0.6 0.8 1.0 Charge Discharge N o rm a li z e d c a p a c it a n c e Cycle number