Science Arts & Métiers (SAM)
is an open access repository that collects the work of Arts et Métiers Institute of Technology researchers and makes it freely available over the web where possible.
This is an author-deposited version published in: https://sam.ensam.eu Handle ID: .http://hdl.handle.net/10985/19566
To cite this version :
X. XU, Adil BENAARBIA, D.J. ALLEN, M.A.E. JEPSON, W. SUN - Investigation of microstructural evolution and creep rupture behaviour of 9% Cr MarBN steel welds - Materials Science and Engineering: A - Vol. 791, p.139546 - 2020
Investigation of microstructural evolution and creep rupture
1
behaviour of 9% Cr MarBN steel welds
2
X. Xu*1, A. Benaarbia2, D. Allen1, Mark A. E. Jepson1, W. Sun3
3
1 Department of Materials, Loughborough University, Loughborough, Leicestershire
4
LE11 3TU, UK
5
2 Arts et Métiers, CNRS, Université de Lorraine, LEM3, F-57000 Metz, France
6
3 Department of Mechanical, Materials and Manufacturing Engineering, University of
7
Nottingham, Nottingham, Nottinghamshire, NG7 2RD, UK
8 9
ABSTRACT
10
The weldments made from the 9-12% Cr tempered martensitic steel are associated with
11
a complex microstructure arising from complicated thermal histories of the fusion and
12
heat affected zones. The complicated microstructural and micro-mechanical states in
13
these critical regions provide a challenge for the determination of creep failure
14
mechanisms. Based on detailed metallographic examination, the microstructural
15
distribution in the heat affected zone of the welds constructed using a recently developed
16
9% Cr MarBN steel, IBN-1, has been identified and classified into Equiaxed Zone (EZ),
17
Duplex Zone (DZ) and Over-tempered Zone (OZ). Cross-weld testing performed at
18
650°C has revealed a significant reduction in creep life as compared to bulk material.
19
Creep rupture has been shown to occur in the parent metal region with a ductile manner
20
at a high stress, whereas creep rupture initiates in the DZ region in an intergranular
21
manner at a low stress. Detailed metallographic investigation has further revealed a higher
22
damage susceptibility in the regions along the pre-existing Prior Austenite Grain
23
Boundaries (PAGBs). The diffusional reaustenitisation of local microstructure along the
precipitates as compared to the surrounding microstructure formed after displacive
26
reaustenitisation.
27
KEYWORDS: 9% Cr tempered martensitic steel; heat affected zone; multi-pass welding;
28
high temperature creep; failure mechanism
29
1. INTRODUCTION
30
The 9-12% Cr creep resistant martensitic steels are widely used in high temperature
31
pressure vessels and piping for the power generation industry due to their good
32
combination of creep strength and oxidation resistance. Based on a nominal composition
33
of Fe-9%Cr-3%W-3%Co-VNbBN [1], variants of Martensitic steel strengthened by
34
boron and nitrogen (MarBN) have been recently developed to replace the more
35
conventional 9% Cr materials such as the Grade 91 and 92 steels by providing superior
36
creep performance in combination with sufficient oxidation resistance [2]. During recent
37
years, the major developments based on the concept of MarBN include a range of
38
materials originating from international collaborative research activities including the
39
G115 (China), SAVE12AD (Japan), NPM-1 (Europe) and the IBN-1 (UK) steels [3–6].
40
These materials are typically manufactured by using common industrial processes
41
finished with normalisation and tempering to produce a tempered martensitic
42
microstructure in combination with secondary precipitates distributed both on grain
43
boundaries and within the grain interiors [1]. These MarBN steels are also compatible
44
with a variety of fusion welding processes including Manual Metal Arc Welding
45
(MMAW), Submerged Arc Welding (SAW) and Gas Tungsten Arc Weld (GTAW).
46
Multi-pass welding processes have been used to fabricate welds on MarBN steels to
47
achieve sufficient ductility in the weld metal and the Heat Affected Zone (HAZ).
Interest in the creep performance of welds fabricated in 9-12% Cr steels is increasing due
49
to their potential applications in power plant systems. The evaluation of welded joint
50
behaviour during creep exposure is a key factor in determining the lifetime of power plant
51
components. The existing studies of cross-weld samples under creep conditions have
52
shown that the ratio of creep rupture strength between cross-welds and the parent material
53
depends on both creep loading conditions and welding procedure [7]. At low testing
54
temperatures there is no large difference between parent metal and cross-weld creep
55
strength, whilst this difference becomes important at high temperatures and low stress
56
levels. Additionally, rupture locations were found to shift from the weld metal to the HAZ
57
as the applied stress decreased [8]. No substantial differences were found in the minimum
58
creep rate, the time to fracture and creep ductility for the cross-weld specimens taken
59
from different locations of the weld [8].
60
The welds fabricated in 9-12% Cr steels are associated with premature creep failure
61
within the HAZ, typically termed as ‘Type IV’ failure [9]. Type IV failure is commonly
62
presented in the HAZ region close to the boundary with the parent metal and causes a
63
substantial loss in creep strength for weldments as compared to bulk materials [10,11].
64
Detailed metallographic examination conducted on interrupted creep test specimens has
65
revealed the presence of creep cavities prior to final rupture in a Type IV manner [12].
66
Based on extensive metallographic examination, the metallurgical cause for the formation
67
of creep cavities is complicated and linked with a range of factors relating to the
68
microstructure of 9-12% Cr steels. For instance, the presence of second phase particles
69
(e.g. boron nitride, BN) above a critical size has been determined as a critical issue that
70
promotes the formation of cavities from the early stage of creep [12,13]. The presence of
71
Type IV failure in 9-12% Cr steels is also related with a layer of HAZ material exhibiting
a refined martensitic microstructure in combination with a lack of precipitate formation
73
on lath and grain boundaries [14,15]. However, most of the existing studies are conducted
74
using welds made from conventional materials such as Grade 91 and 92 steels, whilst the
75
research focused on the creep failure mechanism of recently developed MarBN steels is
76
comparatively limited.
77
Detailed investigation of the creep failure mechanism of 9-12% Cr steel welds is also
78
challenging due to a complicated HAZ microstructure formed by the complex thermal
79
distribution established during multi-pass welding. Extensive research has been
80
conducted using experimental measurement and numerical modelling techniques to
81
understand the thermal distribution in the HAZ [16–18]. These studies reveal that the
82
thermal history of the HAZ is typically composed of a heating phase with a heating rate
83
of >100°C/s and a subsequent cooling phase during which temperature decreases to the
84
ambient level within tens of seconds [16,17]. The variation of the microstructure in the
85
HAZ has been further correlated with thermal distribution based on detailed
86
metallographic examination and dilatometry simulation in 9-12% Cr steels as reported in
87
[19,20]. Detailed previous studies conducted on a more conventional Grade 92 alloy have
88
classified the HAZ microstructure into three critical sub-regions: Completely
89
Transformed Zone (CTZ), Partially Transformed Zone (PTZ) and Over-Tempered Zone
90
(OTZ) based on the range of peak temperatures reached during weld thermal cycles [20].
91
A more recent study based on the dilatometry simulation of a MarBN steel, IBN-1, has
92
further determined a similar trend of variation in the HAZ microstructure as a function of
93
peak temperature [21]. However, there is a lack of direct, systematic investigations from
94
the weld HAZs to correlate with the presence of creep damage in MarBN steels.
In the current research, the microstructural distribution in the HAZ of welds in a parent
96
metal of the MarBN steel, IBN-1, has been investigated in detail in the initial state without
97
creep exposure. The mechanical behaviour of the IBN-1 welds has been further
98
investigated upon short-term creep exposure using cross-weld specimens at 650°C to
99
compare with the bulk materials tested at similar testing conditions. Detailed
100
metallographic examinations have been subsequently performed to identify the critical
101
metallurgical factors related to the formation of creep damage after rupture at different
102
stress levels.
103
2. MATERIAL AND EXPERIMENTAL METHODS
104
2.1. Materials
105
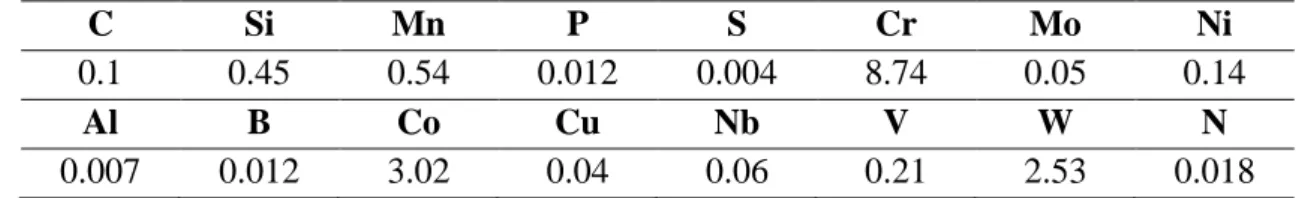
The chemical composition of the IBN-1 steel used (referred as parent metal) is listed in
106
Table 1. The initial heat treatment of the parent metal involved a normalisation process
107
at 1200°C for 4 hours and a tempering process at 765°C for 3 hours. A butt weld was then
108
fabricated between the plates of parent metal that are ~30 mm in thickness by using a
109
multi-pass MMAW process with a recently developed matching filler material, Metrode®
110
Chromet® 933. In total, 26 weld beads were deposited with a heat input of 1.1 – 1.5 kJ/mm
111
with the interpass temperature maintained between 200°C and 300°C. Post Weld Heat
112
Treatment (PWHT) was conducted after welding at 760°C for 2 hours.
113
Table 1. Chemical composition of the IBN-1 parent metal (wt. %, balance is Fe).
114 C Si Mn P S Cr Mo Ni 0.1 0.45 0.54 0.012 0.004 8.74 0.05 0.14 Al B Co Cu Nb V W N 0.007 0.012 3.02 0.04 0.06 0.21 2.53 0.018 115
2.2. Creep testing
116
Creep test specimens were machined to a dog-bone shape with a cylindrical gauge portion
117
measuring 50 mm in length and 10 mm in diameter. The gauge portion consists of the
118
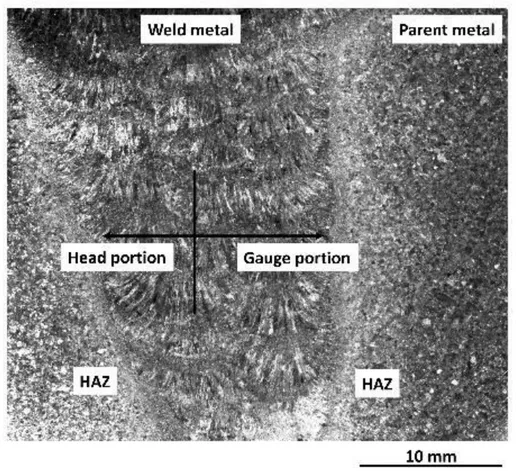
weld and the parent metals, together with the intermediate HAZ located at ~10 mm from
119
the boundary between the gauge and the head portions, Figure 1. The HAZ is
120
perpendicular to the principal stress direction to achieve a volume fraction of the weld
121
metal at ~20 % in the gauge portion.
122
123
Figure 1. Optical macrograph giving an overview of the weld structure in the
cross-124
weld creep specimen.
125
Isothermal short-term cross-weld creep tests were conducted at 650°C with a series of
126
stress levels ranging from 160 MPa to 280 MPa. The stress levels were selected based on
the existing experience of creep testing of MarBN steel [22], such that the specimens were
128
expected to be ruptured in different manners for a comparison in creep characteristics.
129
The specimens tested at a stress level close to 280 MPa were expected to fracture in a
130
ductile manner with rupture occurring in the parent metal. The specimens tested at a stress
131
level close to 160 MPa were chosen to fracture in the HAZ.
132
The testing machine was equipped with high temperature Linear Variable Displacement
133
Transformers (LVDT) to continuously monitor the elongation of specimens, and a
134
resistance-heating furnace enabling a quasi-homogeneous testing temperature of up to
135
800°C. The measured creep strain represents the integral accumulated creep strain of the
136
entire cross-weld material within the gauge length. Three thermocouples were attached
137
to the specimen inside the furnace to track the operating temperature. Note that the
138
thermal gradient between both sample extremities was less than 2°C. Prior to testing,
139
thermal loading was first performed with a rate of 40°C/min until reaching the target
140
temperature. After stabilization of the furnace temperature (~30 minutes), creep tests were
141
conducted until the macroscopic failure of samples.
142
2.3. Metallographic examination
143
Gauge portions of the creep ruptured specimens were sectioned from the head and along
144
the longitudinal direction for detailed metallographic examination of the cross-sections.
145
The specimens were prepared using conventional metallographic preparation methods,
146
which involved mounting in electrically conductive Bakelite, grinding on SiC with water
147
to a 1200 grit finish, polishing on standard polishing cloths using 6 µm and 1 µm diamond
148
suspensions and a final chemo-mechanical polishing process using a suspension of 0.06
µm colloidal silica in water. An as-fabricated weld was also prepared using the same
150
procedure to provide details of the initial microstructure before creep exposure.
151
Hardness testing was conducted on the as-fabricated weld using a loading weight of 10 kg
152
and a dwell time of 10 s using a Struers® Durascan® 70 hardness testing system equipped
153
with a Vickers indenter. Seven individual measurements were conducted to obtain the
154
average value of hardness from both the weld and the parent metals. Hardness mapping
155
was also undertaken on the as-fabricated weld and on creep ruptured specimens in the
156
regions adjacent to the rupture surface using a loading weight of 0.2 kg and a dwell time
157
of 10 s using the identical hardness testing system. Vickers hardness indents were
158
distributed on a square grid with a spacing of 0.1 mm.
159
Fractography examination was performed on the fracture surfaces of creep ruptured
160
specimens using a JEOL® JSM-7800F Field Emission Gun (FEG) Scanning Electron
161
Microscope (SEM) at an accelerating voltage of 5 kV. Grain orientation mapping of the
162
matrix was undertaken by performing EBSD mapping at an accelerating voltage of 20 kV
163
using an Oxford Instruments® Nordlys® MAX2 camera in the JEOL® JSM-7800F
FEG-164
SEM. EBSD maps were collected on the cross-section of the as-fabricated weld and
165
adjacent to the rupture surface of creep fractured specimens at a step size of 2 µm with a
166
size of 1000 × 1000 µm to provide an overview of the microstructure. EBSD mapping
167
was also performed at a finer step size of 0.1 µm to obtain details of the microstructure.
168
The distribution of secondary precipitates in identical regions to where EBSD mapping
169
was conducted was characterised using ion induced Secondary Electron (SE) imaging in
170
a FEI® Nova Nanolab® 600 Focused Ion Beam (FIB) FEG-SEM. The ion beam was
171
operated at an accelerating voltage of 30 kV with XeF2 gas etching used to enhance the
Thin-foil specimens were extracted from site-specific locations where the correlative
174
EBSD/ion induced SE analysis was conducted using an in-situ lift-out technique [24] in
175
a FEI® Nova Nanolab® 600 FIB/FEG-SEM. The thinning of specimens was performed at
176
an accelerating voltage of 30 kV with a beam current decreasing to 0.1 nA, followed by
177
a final cleaning process performed at an accelerating voltage of 5 kV. The extracted
thin-178
foil specimens were investigated using Bright Field Scanning Transmission Electron
179
Microscopy (BF-STEM) in a FEI® Tecnai® F20 Transmission Electron Microscope
180
(TEM) at an accelerating voltage of 200 kV. Secondary precipitates were further
181
characterised using Selected Area Electron Diffraction (SAED) in combination with
182
Energy Dispersive X-ray (EDX) spectroscopy using an Oxford Instruments® X-Max 80N
183
TLE EDX system.
184
3. RESULTS
185
3.1. Microstructural distribution in the as-fabricated condition
186
The hardness of the weld and the parent metals were measured using macro-hardness
187
testing. The hardness of the weld and the parent metals were determined to be 290±4 and
188
249±2 HV10, respectively. The value of hardness obtained from the parent metal is
189
consistent with the previous reports from similar MarBN steels [25,26]. The weld metal
190
exhibited a higher level of hardness as compared to the parent metal. This is possibly
191
attributed to a more refined martensitic microstructure as formed in the weld metal after
192
rapid solidification and cooling during the welding stage, and a less homogenised and
193
recovered martensitic substructure due to a lack of normalisation treatment as compared
194
to the parent metal.
The microstructural variation in the as-fabricated weld without creep exposure was
196
further characterised using hardness mapping analysis at a different loading weight of 0.2
197
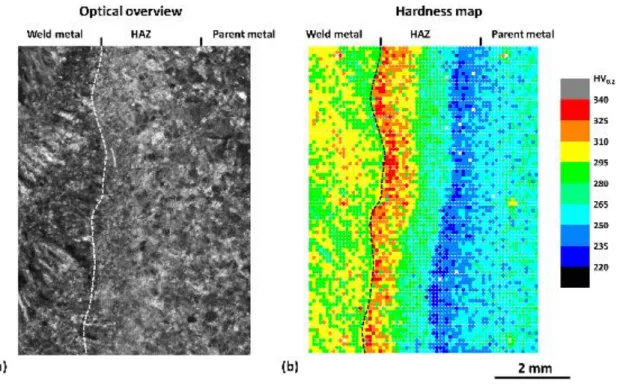
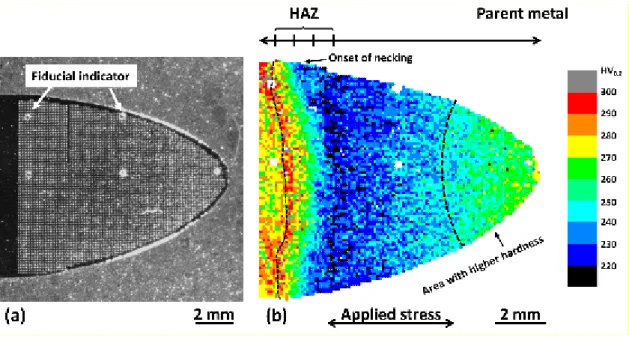
kg. Figure 2 demonstrates a macro optical micrograph providing an overview of the weld
198
microstructure and a hardness map from the same region.
199
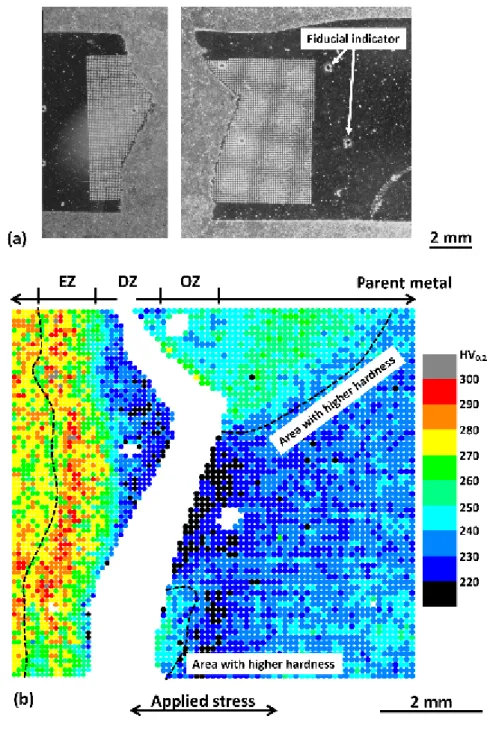
200
Figure 2. (a) A macro optical micrograph demonstrating the variation of
201
microstructure between the weld metal, the HAZ and the parent metal. (b) A
202
hardness map showing the variation in hardness from the same region.
203
From the hardness map, the weld metal has a higher level of hardness at 296±9 HV0.2 as
204
compared to the parent metal measured with a hardness of 261±9 HV0.2. These values of
205
hardness are lower than the values obtained at a loading weight of 10 kg. This is
206
attributable to the different measuring volumes that were achieved at a different loading
207
weight. No significant variation in hardness was observed in the HAZ along the direction
parallel to the fusion boundary (i.e. from bottom to top in Figure 2), whilst a decrease in
209
hardness was clearly observed as the distance from the fusion boundary increased.
210
The distribution in hardness in the HAZ region suggests significant microstructural
211
variation as a function of distance from the fusion boundary. Correlative EBSD analysis
212
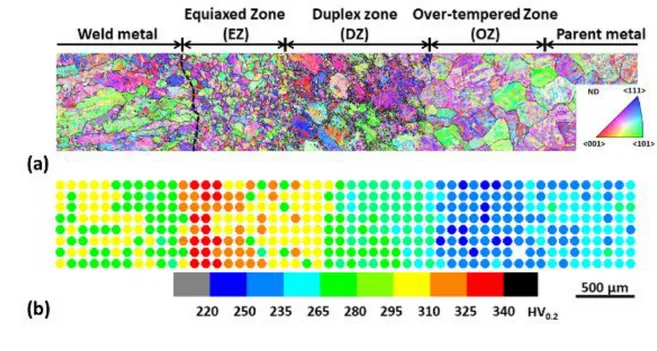
was further conducted to detail the microstructural gradient in the HAZ, Figure 3.
213
214
Figure 3. (a) An EBSD map providing an overview of the tempered martensitic
215
matrix in as-fabricated IBN-1 weld. The grain boundaries with a misorientation
216
range between 20° and 50° are outlined by solid lines. (b) A correlative hardness
217
map showing the variation of hardness in the identical region is also included for
218
comparison.
219
Due to a Kurdjumov-Sachs orientation relationship preserved between the martensitic (α′)
220
and the parental austenitic (γ) phases during martensitic transformation, the austenitic
221
grain structure was characterised from EBSD maps using a boundary misorientation
222
range between 20° and 50° [20,27,28]. Figure 3a shows that columnar and equiaxed
austenitic structures are presented in the weld and the parent metals, respectively. The
224
columnar grains in the weld metal are typically 50-200 µm in width and over 1000 µm in
225
length, whilst the equiaxed grains in the parent metal are predominantly 100-500 µm in
226
diameter. In the HAZ region close to the fusion boundary, the grain structure was found
227
to have transformed from a refined, equiaxed morphology in the region <1 mm from the
228
fusion boundary to a duplex grain structure containing small austenite grain ‘necklaces’
229
around pre-existing PAGBs in the region 1-2 mm from the fusion boundary. The equiaxed
230
grains in the region <1 mm from the fusion boundary are predominantly <150 µm in
231
diameter, whereas the austenite “necklace” grains on the initial PAGBs are <20 µm in
232
diameter in the regions 1-2 mm from the fusion boundary. The microstructural gradient
233
in the HAZ was further correlated with the variation in hardness as demonstrated in Figure
234
3b. The hardness map demonstrates that the region with a refined, equiaxed grain
235
structure has a higher level of hardness measuring 305±16 HV0.2, whereas the region
236
showing a duplex grain structure has a lower level of hardness of 262±17 HV0.2. The grain
237
structure in the regions ~2-3 mm from the fusion boundary is not significantly varied from
238
the parent metal, whereas the hardness was lower, with an average value measuring 247±9
239
HV0.2.
240
The microstructure in the HAZ of as-fabricated IBN-1 weld is further correlated with the
241
microstructure produced by the simulation of weld thermal cycles as previously reported
242
in [21], Table 2.
243
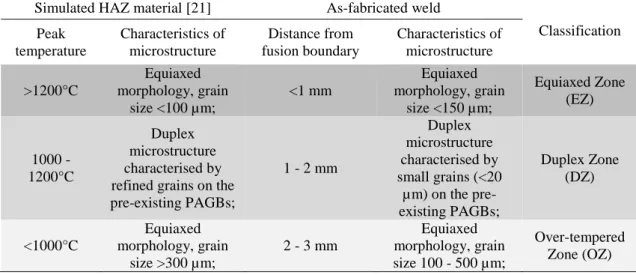
Table 2. A comparison in microstructure between the HAZ of the as-fabricated
IBN-244
1 weld and the simulated HAZ material produced using dilatometry-based
245
simulations of weld thermal cycle [21].
Simulated HAZ material [21] As-fabricated weld Classification Peak temperature Characteristics of microstructure Distance from fusion boundary Characteristics of microstructure >1200°C Equiaxed morphology, grain size <100 µm; <1 mm Equiaxed morphology, grain size <150 µm; Equiaxed Zone (EZ) 1000 - 1200°C Duplex microstructure characterised by refined grains on the pre-existing PAGBs; 1 - 2 mm Duplex microstructure characterised by small grains (<20 µm) on the pre-existing PAGBs; Duplex Zone (DZ) <1000°C Equiaxed morphology, grain size >300 µm; 2 - 3 mm Equiaxed morphology, grain size 100 - 500 µm; Over-tempered Zone (OZ) 247
Table 2 demonstrates that the distribution of HAZ microstructure as a function of the
248
distance from fusion boundary is in strong agreement with the microstructure in the HAZ
249
simulated materials as a function of peak temperature. This suggests that the
250
microstructure in the weld HAZ can be classified based on the gradient of heat input as a
251
function of the distance from fusion boundary. As a result, the weld HAZ was classified
252
as three critical sub-regions, the Equiaxed Zone (EZ), the Duplex Zone (DZ) and the
253
Over-tempered Zone (OZ) (Figure 3). A detailed description of the microstructure in these
254
sub-regions is not the focus of the investigation in the current research, as this has been
255
reported elsewhere in a previous study [21]. However, it has been clearly demonstrated
256
in the current research that the microstructure of the HAZ in MarBN steel welds is
257
different from the conventional understanding of the HAZs in low alloy Cr-Mo steels,
258
which are commonly classified into Coarse-grain (CG), Fine-grain (FG), Inter-critical
259
(IC) and Over-tempered (OT) regions [11].
260
3.2 Mechanical behaviour
261
Creep responses for cross-weld specimens are compared with the parent metal specimens
262 263
summarised in Table 3. These include the Steady-State Creep Rate (SSCR), the time to
264
fracture τf, ductility ϵf, and the Reduction of Area (RA).
265
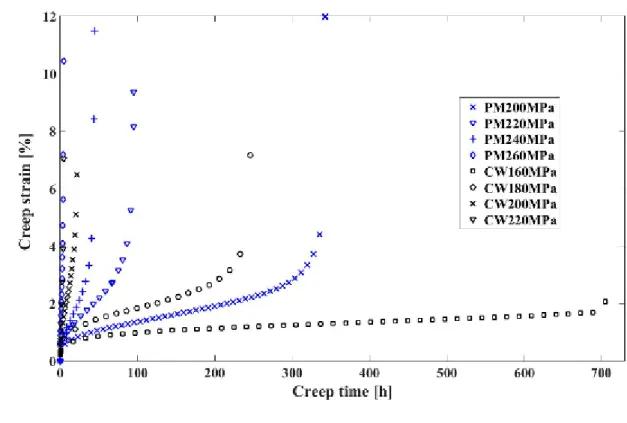
It can be seen that the three typical creep stages (a primary creep stage followed by an
266
apparently steady-state creep deformation and an accelerating tertiary creep stage) are
267
clearly visible for all tests under investigation. The creep results demonstrate that the
268
minimum creep strain rate increases with the increase of stress while creep rupture time
269
decreases as stress increased. At the medium stress level of 200 MPa and 220 MPa, SSCR
270
values for cross-weld are 26-fold higher than the parent metal, whilst the time to rupture
271
is 14- to 18-fold shorter as compared to the parent metal. This clearly indicates a lower
272
creep resistance of the cross-weld specimen as compared to the parent metal specimen.
273
This finding applies to all stress levels selected for this investigation. Moreover, no
274
significant changes have been observed when comparing both values of the area reduction
275
and ductility reported for both parent metal and cross-weld.
277
Figure 4. Strain-time curves for creep tests conducted on parent metal (PM) and
278
cross-weld (CW) specimens at 650°C.
279
Table 3. Material creep properties for parent metal (PM) and cross-weld (CW)
280
specimens selected at different stress levels.
281 𝝈 [MPa] Material SSCR [𝟏𝟎−𝟓× 𝐡−𝟏] 𝝉𝒇 [h] 𝝐𝒇 [%] RA [%] 160 PM - - - - CW 1.13 705.56 2.66 14.44 180 PM - - - - CW 7.31 248.35 5.62 42.24 200 PM 6.12 342.91 11.93 62.05 CW 170.02 22.96 7.86 73.79 220 PM 29.12 95.47 9.36 73.68 CW 770.15 5.14 11.35 80.29 240 PM 280.32 13.73 11.48 74.29 CW - - - - 260 PM 1000.21 4.43 10.48 75.11 CW - - - - 280 PM 4851.23 0.94 14.88 81.08 CW - - - -
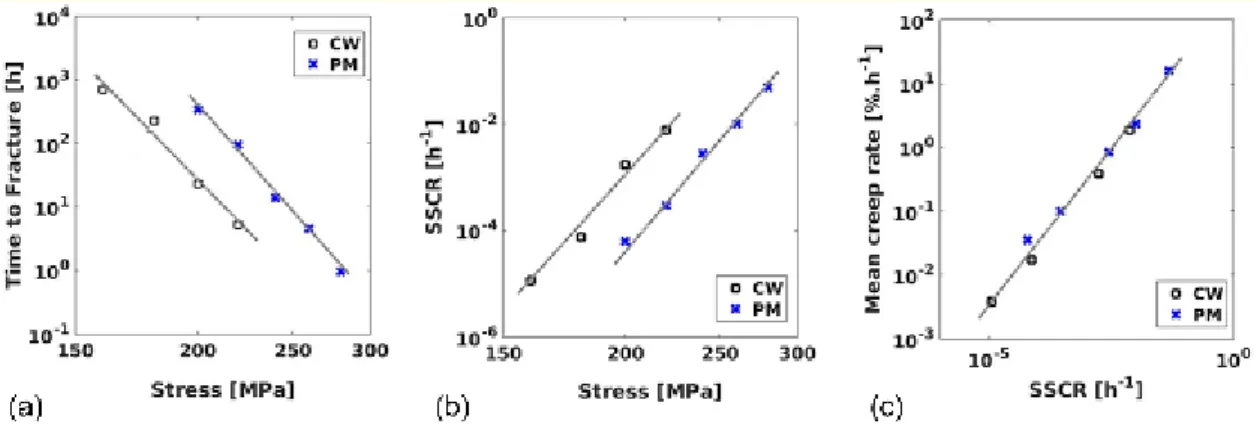
All aforementioned creep rupture characteristics of the parent metal and cross-weld are
283
gathered for comparison in Figure 5 and summarised in Table 4 in the form of power-law
284
(relating the time-to-rupture or SSCR to the stress) and Monkman-Grant (relating the
285
mean creep rate to SSCR) relationships. Figures 5a and 5b show that the cross-weld
286
specimens have a considerably shorter creep life and a higher creep strain rate as
287
compared to the parent metal specimens, whilst Figure 5c reveals a similar
Monkman-288
Grant (MG) relationship for both the cross-weld and the parent metal specimens. In
289
addition, no significant differences were observed for the apparent stress and MG
290
exponents between the cross-weld and the parent metal specimens, as detailed in Table
291
4. The parent metal specimens show a slightly higher stress exponent value, 𝓂, as
292
compared to the cross-weld specimen, whilst the stress exponent value, 𝓃, is slightly
293
higher for the cross-weld specimen. The MG exponent, 𝜉, for the cross-weld specimens
294
turns out to be 0.95, whilst that of the parent metal specimens is ~ 0.87.
295
Additional calculations were conducted on separate groups of the specimens tested at
296
different stress levels, which appear to exhibit different creep behaviour as indicated by
297
an evident deviation from the linear relationship as shown in Figure 5a. The stress
298
exponent value, 𝓂, was obtained at 8.87 and 15.70 for the specimens tested at 160/180
299
MPa and 200/220 MPa, respectively. A close value of stress exponent, 𝓂, between the
300
cross-weld specimens tested at a higher level of stress and the parent metal specimens
301
suggests similar creep behaviour for the specimens tested at the identical conditions,
302
whilst the creep behaviour of the specimens tested at 160/180 MPa may be different as
303
proposed by a considerable discrepancy in stress exponent value with the parent metal
304
specimens. As a result, creep life is significantly shortened to a higher extent for the
cross-305 306
307
Figure 5. (a) Time to fracture vs. applied stress. (b) SSCR vs. applied stress. (c) Mean
308
creep rate (𝝐𝒇/𝝉𝒇) vs. SSCR of IBN-1 cross-weld (CW) and parent metal (PM)
309
specimens.
310
Table 4. Apparent values of creep function coefficients for parent metal (PM) and
311
cross-weld (CW) specimens.
312
Material Time to fracture
𝝉𝒇 = 𝒑 𝛔−𝓶
Steady-state creep rate
𝐒𝐒𝐂𝐑 = 𝒒 𝛔𝓷 Monkman-Grant relationship 𝐒𝐒𝐂𝐑𝝃= 𝝎 𝝐𝒇/𝝉𝒇 𝒑 [(MPa)-1.h] 𝓶 [-] 𝒒 [(MPa.h)-1] 𝓷 [-] 𝝎 [-] 𝝃 [-] PM 7.59 × 1042 17.53 1.07 × 10−50 19.88 0.63 0.87 CW 2.63 × 1038 16.08 6.47 × 10−53 21.42 0.56 0.95 313
3.3. Creep rupture behaviour of cross-weld specimen at different stress levels
314
The microstructures in the creep exposed cross-weld specimens were investigated using
315
hardness mapping analysis in combination with fractography examination to understand
316
the correlation between the weld microstructure and the creep rupture behaviour.
317
Hardness mapping was conducted in the region close to the rupture surface to reveal the
320
Figure 6. (a) Photographs showing the cross-section of a creep ruptured cross-weld
321
specimen after creep testing at 650ºC and 160 MPa for 705 hours prior to hardness
322
mapping analysis. (b) A hardness map showing the variation of hardness in the
323
region of analysis.
324
Figure 6b shows that the hardness of the weld metal ranges between 238 and 299 HV0.2
metal is in the range of 221-258 HV0.2 with an average value obtained at 236±6 HV0.2.
327
The hardness in the HAZ decreases from 312 HV0.2 to 205 HV0.2 with distance from the
328
fusion boundary. The rupture surface is located at ~1.0-2.5 mm from the fusion boundary
329
with a zig-zag crack path. The rupture surface is aligned at ~90° to the principal stress
330
direction close to the outer surface (bottom), whereas it is ~70° and ~45° to the principal
331
stress direction in the centre and close to the other side (top), respectively. The hardness
332
in the regions extending from the portions at ~90° and ~45° is in the range of 232-253
333
HV0.2 and 235-273 HV0.2, respectively. The hardness measured from the regions
334
extending from the portion at ~70° to the principal stress direction is lower and in the
335
range between 206 and 237 HV0.2. The angle of the rupture surface is related to the
336
microstructure of the weld and the local stress state during creep testing. However, it is
337
also affected by the other factors such as the surface condition of the specimen and the
338
experimental condition of creep test. Detailed examination of the creep ruptured
cross-339
weld specimen is required to reveal the underlying reasons for the rupture of specimens.
340
Hardness mapping analysis was further conducted on the creep ruptured specimen which
341
was tested at 650°C and 200 MPa, Figure 7.
343
Figure 7. (a) A photograph showing the cross-section of a creep ruptured cross-weld
344
specimen after creep testing at 650ºC and 200 MPa for 23 hours prior to hardness
345
mapping analysis.
346
The hardness measured from the weld and parent metals (Figure 7) is similar to the
347
specimen ruptured at 160 MPa. The hardness of the weld metal is in the range between
348
253 and 314 HV0.2 with an average value measuring 279±9 HV0.2, whereas the hardness
349
of the parent metal is between 219 and 269 HV0.2 with an average value obtained at 241±8
350
HV0.2. The hardness in the HAZ is similar to the specimen tested at 650°C and 160 MPa
351
and is decreased from 320 to 205 HV0.2 as the distance from the fusion boundary
352
increases. The rupture surface is located at ~11 mm from the fusion boundary, with
353
substantial necking which also includes an increase in hardness to a maximum value of
354
285 HV0.2.
355
Fractographic examination was conducted on the rupture surfaces to understand the
356
fracture behaviour of the creep exposed specimens. Figure 8 demonstrates the topography
Figures 8b-8g demonstrate that the rupture surface in the specimen tested at 650°C and
359
160 MPa has changed from an intergranular to a ductile dimpled topography from the
360
regions with an angle of at ~90° to ~70° and ~45° to the principal stress direction. The
361
intergranular surface at ~90° is not similar to the characteristics of typical faceted surfaces
362
formed by intergranular fracture [29], but it is covered by scale-like features that are
363
possibly formed by oxidation (Figure 8g). The dimples in the region ~70°/~45° to the
364
principal stress direction are typically 3-10 µm in diameter and occasionally associated
365
with inclusion particles (e.g. Figure 8c), which is consistent with the existing report of
366
plastic damage associated with secondary phase particles [30]. The rupture surface of the
367
specimen tested at 650°C and 200 MPa is composed of a dimpled central region in
368
combination with a shear lip close to the outer surface (Figure 8h). Figure 8i demonstrates
369
that the dimples in the central region are similar in size as compared to the specimen
370
tested at 650°C and 160 MPa and occasionally associated with inclusions.
372
Figure 8. (a) An optical overview of rupture surface in the specimens tested at (left)
373
650°C/160 MPa and (right) 650°C/200 MPa. Topography of the rupture surface is
374
further detailed for the regions with an angle of (b, c) ~45°, (d, e) ~70° and (f, g) ~90°
375
to the principal stress direction in the specimen tested at 650°C/160 MPa and (h, i)
376
the rupture surface after creep testing at 650°C/200 MPa.
Previous studies that were systematically conducted at various creep test conditions have
378
revealed a variation in rupture behaviour from catastrophic HAZ failure occurring in the
379
‘Type IV’ zone, to ductile rupture of the parent metal against a decreasing testing
380
temperature and/or an increasing stress level for the welds with a parent metal of similar
381
materials [11,31]. This trend in creep rupture behaviour against the variation of creep test
382
condition is consistent with the creep behaviour of IBN-1 steel welds between the tests
383
conducted at 650°C and 160/200 MPa here. The IBN-1 weld tested at 200 MPa
384
demonstrates similar creep behaviour to the IBN-1 parent materials from the identical
385
industrial heat in tests at similar conditions, where dislocation climb acts as the dominant
386
rate controlling factor for creep deformation [22]. However, the specimen tested at 650°C
387
and 160 MPa demonstrates distinctively different creep rupture behaviour as indicated by
388
an intergranular rupture surface located in the HAZ. Detailed metallographic examination
389
is required to obtain an in-depth understanding of metallurgical causes for the occurrence
390
of intergranular HAZ failure.
391
3.4. The influence of HAZ microstructure on creep rupture
392
EBSD mapping was conducted in local areas close to the rupture surface in the HAZ of
393
the specimen tested at 650°C and 160 MPa, Figure 9.
394
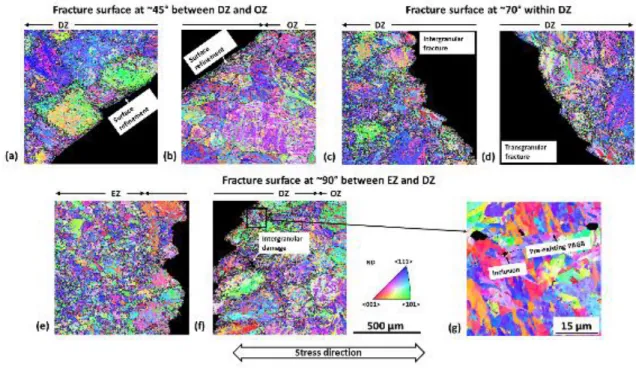
Figure 9 clearly demonstrates the correlation between HAZ microstructure and the
395
location of rupture surface. The surface portion at ~45° to the principal stress direction is
396
close to the boundary between the DZ and the OZ, whereas the portion at ~70° is located
397
within the DZ. The surface portion at ~45° is transgranular and relatively straight (Figures
398
9a and 9b), whereas the surface portion at ~70° is transformed from intergranular (Figure
399
9c) to transgranular (Figure 9d) when moving from the region adjacent to the surface
portions at ~90° to the region close to the portion at ~45°. However, the surface portion
401
at ~90° is clearly intergranular and formed along the ‘necklace’ of pre-existing PAGBs
402
as marked by the traces of refined grains <20 µm in diameter (Figures 9e and 9f). The
403
location of the intergranular surface portion has been confirmed in the region close to the
404
boundary between the EZ and the DZ, with a distance of ~1.1 mm from the fusion
405
boundary. The presence of secondary damage was also observed in the intergranular
406
region on pre-existing PAGBs and triple points (Figures 9f and 9g) in the area close to
407
the rupture surface.
408
409
Figure 9. EBSD maps showing the microstructure in the regions close to rupture
410
surface at (a, b) ~45°, (c, d) ~70° and (e, f) ~90° to the principal stress direction in
411
the specimen tested at 650°C and 160 MPa. (g) An EBSD map collected at a higher
412
resolution detailing the correlation between microstructure and secondary damage
413
close to rupture surface. The grain boundaries with a misorientation range between
414
20° and 50° are outlined by solid lines.
The initial microstructure in the HAZ of the as-fabricated IBN-1 weld was further
416
investigated in detail to identify the cause of intergranular creep rupture from a
417
metallurgical perspective. Figure 10 demonstrates the correlative micrographs obtained
418
from the DZ regions in the as-fabricated weld at a similar distance from the fusion
419
boundary as the location of the rupture surface using EBSD and ion induced SE imaging.
420
Figure 10a demonstrates an evident transition between the EZ and DZ at ~1 mm from the
421
fusion boundary as indicated by the change in microstructure. One region (Region 1)
422
selected for correlative EBSD/ion induced SE analysis is close to the boundary between
423
the EZ and the DZ with a similar distance from the fusion boundary as the rupture surface
424
(Figure 9) to compare with the microstructure in another region (Region 2) further away
425
from the fusion boundary (~1.3 mm). EBSD mapping analysis (Figures 10b and 10d)
426
reveals the elongated blocks that are a few microns in width within the martensitic
427
substructure of the fine and coarse grains within the DZ, whereas the correlative ion
428
induced SE micrographs (Figures 10c and 10e) demonstrate the precipitate particles that
429
are preferentially distributed on substructure boundaries. Notably, the boundary of the
430
refined grains formed along a pre-existing PAGB (e.g. Grain B) are consistently
431
decorated by precipitate particles with a diameter of <150 nm in Region 1 (Figure 10c),
432
whereas the boundary of the refined grains in Region 2 (e.g. Grain D) are decorated to a
433
lesser extent (Figure 10d). This is attributed to an incomplete dissolution of the
pre-434
existing precipitate particles in the regions further away from the fusion boundary due to
435
a lower experienced peak temperature, which consumes the carbide forming elements in
436
the matrix and mitigates a further formation of grain boundary precipitates as previously
437
reported in Grade 92 steel weld [20].
439
Figure 10. (a) A large-scale EBSD map providing an overview of microstructure in
440
the DZ with the regions of specific analysis indicated by black boxes. (b, d) EBSD
441
and (c, e) ion induced SE micrographs of the martensitic substructure and the
442
structure of precipitates in the regions at (b, c) 1.1 mm and (d, e) 1.3 mm from the
443
fusion boundary. The boundary of small austenite grains on the ‘necklace’ of
pre-444
existing PAGBs were revealed by a misorientation range of 20°-50°. Ion induced SE
micrographs were inverted in grey scale for a clear visualisation of the precipitates
446
as bright particles.
447
The precipitates on the boundary of a refined grain (Grain B) in Region 1 were further
448
extracted using the FIB lift-out technique for high-resolution analysis in TEM using
449
SAED and STEM-EDX. Figure 11 displays a BF-STEM micrograph collected from the
450
boundary of Grain B with the SAEDPs and EDX maps collected from precipitates and
451
the surrounding matrix.
452
The martensitic substructure is predominantly composed of laths that are <1 µm in width
453
in combination with a high density of dislocations within the lath interiors. The majority
454
of the precipitate particles distributed on the boundaries of Grain B are <150 nm in
455
diameter and have an FCC lattice structure similar to the M23C6 carbides [32]. A crystal
456
orientation relationship of {011}precipitate // {111}matrix, <111> precipitate // <011>matrix was
457
also confirmed between the precipitates and the matrix (Figure 11b). Figures 11c-11f
458
further demonstrate that the precipitates distributed on the boundary of Grain B have a
459
similar chemistry to the M23C6 carbides that are abundant in Cr in combination with a
460
minor level of W [33]. The presence of precipitate particles that are abundant in W or
461
Nb/V was also observed at a minor level (Figures 11d-11f). The chemical compositions
462
of the W-rich and Nb/V-rich precipitates are similar to the chemistry of Laves and MX
463
carbonitrides [34,35], respectively.
465
Figure 11. (a) A BF-STEM micrograph of the detailed martensitic microstructure
466
in the region adjacent to the boundary of Grain B (Figure 10) and (b) an SAEDP
467
collected from a precipitate particle with grey scale inverted for the visualisation of
pattern. (c-f) Correlative EDX maps demonstrating the distribution of elements in
469
the precipitates and the surrounding matrix.
470
4. DISCUSSION
471
The dimpled rupture surface on the specimen tested at 650°C and 200 MPa is formed by
472
ductile fracture due to significant stress concentration in the necked region, similar to that
473
as previously observed in parent metal specimens [22]. However, the rupture behaviour
474
of the IBN-1 weld tested at 650°C and 160 MPa is distinctively different and is marked
475
by an intergranular rupture surface located within the HAZ. Based on detailed
476
metallographic examinations of the specimens before and after creep exposure, the
477
rupture surface generated at an applied stress of 160 MPa was found to be locateed in the
478
region close to the boundary between EZ and DZ.
479
The EZ and DZ are distinctively classified by an evident transition in prior austenite grain
480
morphology from an equiaxed microstructure to a duplex structure containing refined
481
PAGs distributed on the initial PAGBs (Figure 10). These fine grains are likely to form
482
via a diffusive transformation mechanism that is initiated from the PAGBs due to a lower
483
energy for formation. This is evidenced by a preferential distribution of Cr-containing
484
M23C6 carbides on the boundary of these refined grains (Figure 10). This is caused by the
485
segregation of carbide forming elements (e.g. Cr) on the boundaries as result of diffusion
486
[38]. Similar observations were also obtained from a Fe-13%Cr-4%Ni-Mo martensitic
487
steel after diffusive austenitisation in the lower temperature regime (i.e. tempering at
488
<680°C) as previously reported [39].
489
However, it is considered that the materials in the remaining area (i.e. close to the centre
490 491
heating rates experienced during welding. The existing observations of displacive
492
austenitisation is comparatively limited for 9-12% Cr steels due to a relatively lower
493
heating rate associated with typical manufacturing and heat treatment processes utilised
494
for industrial applications [40]. However, fusion welding may facilitate the
495
reaustenitisation of original parent metal in the weld HAZ via a diffusionless, displacive
496
mechanism due to a high heating rate associated with weld thermal cycles that is typically
497
>100°C/s as revealed in previous research [16,18]. The critical threshold of heating rate
498
for the occurrence of displacive austenitisation has been determined to be ~400°C/s in a
499
0.15%C-5%Mn low alloy steel, whilst displacive austenitisation has been reported upon
500
a heating rate of 5°C/s in a Fe-13%Cr-4%Ni-Mo steel [28,41].
501
The resultant microstructure formed by displacive austenitisation has been demonstrated
502
in a previous study as a duplicated austenitic structure defined by high-angle PAGBs in
503
combination with austenitic laths sharing similar crystal orientation formed within the
504
PAG interiors. The austenitic laths with a similar crystal orientation are formed within an
505
individual PAG due to a crystallography memory effect that ‘reverses’ the orientation of
506
α/α'-Fe matrix based on a Kurdjumov-Sachs orientation relationship [42]. In the current
507
research, the microstructure observed from the central area within the PAG interiors in
508
the DZ (Figures 3 and 9) is in strong agreement with the austenitic microstructure formed
509
in a displacive manner as reported in [42]. This also explains the lack of high-angle
510
boundaries within the interiors of pre-existing PAGs in the DZ as highlighted by a range
511
of misorientation of 20°-50°. Therefore, the duplex austenitic structure in the DZ is
512
formed via a diffusive reaustenitisation process that gives rise to refined grains along the
513
pre-existing PAGBs in combination with a displacive mechanism that reaustenitises the
514
martensitic matrix within the PAG interior. This is consistent with the experimental
observation as previously reported in another MarBN steel [26]. Upon further heating
516
after austenitisation is completed, the displacively formed austenite is prone to
517
recrystallisation due to a high density of dislocations in the microstructure as reported in
518
[41,42]. This further explains the presence of an equiaxed austenitic structure in the
519
regions closer to the fusion boundary as highlighted in the EZ area (Figures 3 and 9).
520
The martensite transformed from displacively formed austenite is commonly related with
521
a higher dislocation density inherited from the initial austenitic microstructure as
522
compared to the martensitic phases transformed from diffusively formed austenite
523
[41,42]. This suggests a higher dislocation density in the martensitic matrix within the
524
PAG interiors as compared to the intergranular regions showing a refined austenitic
525
structure formed by diffusive phase transformation. Therefore, the intergranular regions
526
along the PAGBs are more susceptible to damage formation by acting as the vulnerable
527
sites in the microstructure. In addition, the correlative EBSD and ion induced SE analysis
528
has revealed preferential formation of the M23C6 carbides on the boundaries of diffusively
529
formed austenite grains in the region close to the boundary between the EZ and DZ. This
530
is consistent with the observation from a previous study on a Fe-1%Cr-0.6%C alloy that
531
reveals the segregation of Cr accompanied with the migration of austenite grain
532
boundaries during diffusive austenitisation [38]. The diffusion of carbide forming
533
elements away from the pre-existing PAGBs further explains the scarcity of intergranular
534
M23C6 carbides in the areas between refined austenite grains. The depletion of precipitates
535
on PAGBs may further contribute to a higher susceptibility of intergranular damage due
536
to a lack of stabilisation effect provided by the grain boundary precipitates [33]. Figure
537
12 demonstrates a schematic diagram illustrating the critical metallurgical factors
associated with the formation of intergranular damage in a duplex martensitic
539
microstructure formed by a combination of diffusive and displacive mechanisms.
540
541
Figure 12. A schematic diagram illustrating the formation of intergranular damage
542
in the microstructure of DZ after reaustenitisation from the initial microstructure
543
of the parent metal prior to PWHT.
544
5. CONCLUSIONS
The microstructural distribution in the HAZ of IBN-1 welds has been clearly determined
546
and classified into three distinctive sub-regions as the Equiaxed Zone (EZ), the Duplex
547
Zone (DZ) and the Over-tempered Zone (OZ) in the initial microstructure prior to creep
548
exposure. The microstructural and mechanical characterisations conducted after
short-549
term creep testing have further revealed an evident variation in creep behaviour between
550
the welds tested at different stress levels and the bulk materials tested at identical
551
conditions. From a mechanical point of view, a low creep resistance of the welds, as
552
compared to the parent metal, has been observed. The SSCR values for the welds were
553
found 26-fold higher than the parent metal, while the time to rupture was 14- to 18-fold
554
shorter as compared to the parent metal.
555
Detailed fractography and metallography examinations revealed a ductile rupture
556
occurred in the parent metal for the welds tested at a higher level of stress, whilst the
557
welds tested at a lower stress demonstrated a failure location in the DZ microstructure
558
close to the boundary with EZ. The initiation of such failure in IBN-1 welds was
559
dominated by intergranular cracking along the pre-existing initial PAGBs from the
560
original microstructure of the parent metal. The areas along these PAGBs acted as
561
vulnerable sites in a tempered martensitic matrix transformed from an austenitic
562
microstructure formed by a combination of diffusive and displacive mechanisms. In
563
particular, the intergranular regions were associated with higher damage susceptibility
564
due to a relatively lower strength as compared to the matrix within the PAG interiors and
565
a lack of precipitates on the PAGBs.
566
6. ACKNOWLEDGMENTS
This work was supported by the Engineering and Physical Sciences Research Council
568
(https://www.epsrc.ac.uk/) through the IMPULSE project (grant number:
569
EP/N509991/1). The authors gratefully acknowledge the following partners for their
570
valuable contributions: Doosan Babcock, GE Power, Uniper Technologies,
571
Metrode Products, Goodwin Steel Castings and Wyman-Gordon.
572
Specific acknowledgments to Dr Paul Robb (Doosan Babcock) for providing the test
573
material and welding procedure. The authors also acknowledge use of facilities within
574
the Loughborough Materials Characterisation Centre.
575
7. DATA AVAILABILITY
576
The raw/processed data required to reproduce these findings cannot be shared at this time
577
as the data also forms part of an ongoing study.
578
8. REFERENCES
579
[1] M. Taneike, F. Abe, K. Sawada, Creep-strengthening of steel at high
580
temperatures using nano-sized carbonitride dispersions, Nature. 424 (2003) 294–296.
581
[2] R. Viswanhatan, R. Purgert, U. Rao, Materials technology for advanced coal
582
power plants, in: Proc. 1st Int. Conf. ‘Super-High Strength Steels’, Rome, Italy, 2005.
583
[3] T. Hamaguchi, H. Okada, S. Kurihara, H. Hirata, M. Yoshizawa, A. Iseda,
584
Microstructural Evaluation of 9Cr-3W-3Co-Nd-B Heat-Resistant Steel (SAVE12AD)
585
After Long-Term Creep Deformation, in: ASME 2017 Pressure Vessels and Piping
586
Conference, American Society of Mechanical Engineers, 2017.
587
[4] S. Hollner, E. Piozin, P. Mayr, C. Caës, I. Tournié, A. Pineau, B. Fournier,
588
Characterization of a boron alloyed 9Cr3W3CoVNbBN steel and further improvement
of its high-temperature mechanical properties by thermomechanical treatments, J. Nucl.
590
Mater. 441 (2013) 15–23.
591
[5] D.J. Allen, An investigation of the factors determining creep strength and
592
ductility in Grade 92 steel, in: Kern, T. (ed.) 4th International ECCC Creep & Fracture
593
Conference (ECCC 2017), Dusseldorf, 10-14th September. Dusseldorf: Steel Institute
594
VDEh.
595
[6] P. Yan, Z. Liu, H. Bao, Y. Weng, W. Liu, Effect of tempering temperature on
596
the toughness of 9Cr–3W–3Co martensitic heat resistant steel, Mater. Des. 54 (2014)
597
874–879.
598
[7] F. Masuyama, M. Matsui, N. Komai, Creep rupture behavior of advanced 9-12%
599
Cr steel weldment, Key Eng. Mater. 171 (1999) 99–108.
600
[8] V. Sklenička, K. Kuchařová, M. Svobodová, M. Kvapilová, P. Král, L. Horváth,
601
Creep properties in similar weld joint of a thick-walled P92 steel pipe, Mater. Charact.
602
119 (2016) 1–12.
603
[9] H.J. Schuller, L. Hagn, A. Woitscheck, Cracking in the Weld Region of Shaped
604
Components in Hot Steam Pipe Lines–Materials Investigations, Der Maschinenschaden.
605
47 (1974) 1–13.
606
[10] D.J. Abson, J.S. Rothwell, Review of type IV cracking of weldments in 9-12%
607
Cr creep strength enhanced ferritic steels, Int. Mater. Rev. 58 (2013) 437–473.
608
[11] J.A. Francis, W. Mazur, H. Bhadeshia, Review Type IV cracking in ferritic
609
power plant steels, Mater. Sci. Technol. 22 (2006) 1387–1395.
610
[12] J.D. Parker, Creep cavitation in CSEF steels, in: Proc. Seventh Int. Conf. Adv.
611
Mater. Technol. Foss. Power Plant, 2013: p. 714.
[13] Y.Gu, Microstructural investigation of creep behaviour in Grade 92 power plant
613
steels, Ph.D. thesis, 2017.
614
[14] Y. Liu, S. Tsukamoto, T. Shirane, F. Abe, Formation Mechanism of Type IV
615
Failure in High Cr Ferritic Heat-Resistant Steel-Welded Joint, Metall. Mater. Trans. A.
616
44 (2013) 4626–4633.
617
[15] K. Kimura, Y. Takahashi, Evaluation of long-term creep strength of ASME
618
Grades 91, 92, and 122 type steels, in: ASME 2012 Press. Vessel. Pip. Conf., American
619
Society of Mechanical Engineers, 2012: pp. 309–316.
620
[16] M.S. L. Havelka, P. Mohyla, Thermal cycle measurement of P92 welded joints,
621
in: Proc. 23rd Int. Conf. Met. Mater., 2014.
622
[17] A.H. Yaghi, D.W.J. Tanner, T.H. Hyde, A.A. Becker, W. Sun, Abaqus Thermal
623
Analysis of the Fusion Welding of a P92 Steel Pipe, in: SIMULIA Cust. Conf., 2011:
624
pp. 622–638.
625
[18] A.H. Yaghi, T.H. Hyde, A.A. Becker, W. Sun, Finite element simulation of
626
welding and residual stresses in a P91 steel pipe incorporating solid-state phase
627
transformation and post-weld heat treatment, J. Strain Anal. Eng. Des. 43 (2008) 275–
628
293.
629
[19] X. Xu, G.D. West, J.A. Siefert, J.D. Parker, R.C. Thomson, Microstructural
630
Characterization of the Heat-Affected Zones in Grade 92 Steel Welds: Double-Pass and
631
Multipass Welds, Metall. Mater. Trans. A. 49 (2018) 1211–1230.
632
[20] X. Xu, G.D. West, J.A. Siefert, J.D. Parker, R.C. Thomson, The Influence of
633
Thermal Cycles on the Microstructure of Grade 92 Steel, Metall. Mater. Trans. A. 48
634
(2017) 5396–5414.
[21] J. Guo, X. Xu, M.A.E. Jepson, R.C. Thomson, Influence of weld thermal cycle
636
and post weld heat treatment on the microstructure of MarBN steel, Int. J. Pres. Ves.
637
Pip. 174 (2019) 13-24.
638
[22] A. Benaarbia, X. Xu, W. Sun, A.A. Becker, M.A.E. Jepson, Investigation of
639
short-term creep deformation mechanisms in MarBN steel at elevated temperatures,
640
Mater. Sci. Eng. A. 734 (2018) 491-505.
641
[23] L. Li, R. MacLachlan, M. a. E. Jepson, R. Thomson, Microstructural Evolution
642
of Boron Nitride Particles in Advanced 9Cr Power Plant Steels, Metall. Mater. Trans.
643
A. 44 (2013) 3411–3418.
644
[24] L.A. Giannuzzi, B.W. Kempshall, S.M. Schwarz, J.K. Lomness, B.I. Prenitzer,
645
F.A. Stevie, FIB Lift-Out Specimen Preparation Techniques, in: L.A. Giannuzzi, F.A.
646
Stevie (Eds.), Introd. to Focus. Ion Beams Instrumentation, Theory, Tech. Pract.,
647
Springer US, Boston, MA, 2005: pp. 201–228.
648
[25] Y. Li, K. Li, Z. Cai, J. Pan, X. Liu, P. Wang, Alloy design of welding filler
649
metal for 9Cr/2.25 Cr dissimilar welded joint and mechanical properties investigation,
650
Weld. World. 62 (2018) 1137–1151.
651
[26] F. Abe, M. Tabuchi, S. Tsukamoto, Metallurgy of Type IV fracture in advanced
652
ferritic power plant steels, Mater. High Temp. 28 (2011) 85–94.
653
[27] H. Kitahara, R. Ueji, N. Tsuji, Y. Minamino, Crystallographic features of lath
654
martensite in low-carbon steel, Acta Mater. 54 (2006) 1279–1288.
655
[28] N. Nakada, T. Tsuchiyama, S. Takaki, D. Ponge, D. Raabe, Transition from
656
diffusive to displacive austenite reversion in low-alloy steel, Isij Int. 53 (2013) 2275–
657
2277.
[29] C.L. Briant, S.K. Banerji, Intergranularfailure in steel: the role of
grain-659
boundary composition, Int. Met. Rev. 23 (1978) 164–199.
660
[30] J. Lin, Y. Liu, T.A. Dean, A review on damage mechanisms, models and
661
calibration methods under various deformation conditions, Int. J. Damage Mech. 14
662
(2005) 299–319.
663
[31] T. Sakthivel, M. Vasudevan, K. Laha, P. Parameswaran, K.S. Chandravathi, S.P.
664
Selvi, V. Maduraimuthu, M.D. Mathew, Creep rupture behavior of 9Cr–1.8 W–0.5 Mo–
665
VNb (ASME grade 92) ferritic steel weld joint, Mater. Sci. Eng. A. 591 (2014) 111–
666
120.
667
[32] A. Baltusnikas, I. Lukosiute, R. Levinskas, Transformation kinetics of M23C6
668
carbide lattice parameters in low alloyed steel, Mater. Sci. 16 (2010) 320–323.
669
[33] F. Abe, Precipitate Design for Creep Strengthening of 9% Cr Tempered
670
Martensitic Steel for Ultra-supercritical Power Plants, Sci. Technol. Adv. Mater. Sci.
671
Technol. Adv. Mater. 9 (2008) 13002–15.
672
[34] L. Cipolla, H.K. Danielsen, D. Venditti, P.E. Di Nunzio, J. Hald, M.A.J.
673
Somers, Conversion of MX nitrides to Z-phase in a martensitic 12% Cr steel, Acta
674
Mater. 58 (2010) 669–679.
675
[35] O. Prat, J. Garcia, D. Rojas, G. Sauthoff, G. Inden, The role of Laves phase on
676
microstructure evolution and creep strength of novel 9% Cr heat resistant steels,
677
Intermetallics. 32 (2013) 362–372.
678
[36] Z.B. Zhang, O. V Mishin, N.R. Tao, W. Pantleon, Microstructure and annealing
679
behavior of a modified 9Cr−1Mo steel after dynamic plastic deformation to different
680
strains, J. Nucl. Mater. 458 (2015) 64–69.
[37] M.E. Kassner, T.A. Hayes, Creep cavitation in metals, Int. J. Plast. 19 (2003)
682
1715–1748.
683
[38] G. Miyamoto, H. Usuki, Z.-D. Li, T. Furuhara, Effects of Mn, Si and Cr addition
684
on reverse transformation at 1073 K from spheroidized cementite structure in Fe–0.6
685
mass% C alloy, Acta Mater. 58 (2010) 4492–4502.
686
[39] Y.Y. Song, X.Y. Li, L.J. Rong, D.H. Ping, F.X. Yin, Y.Y. Li, Formation of the
687
reversed austenite during intercritical tempering in a Fe–13% Cr–4% Ni–Mo
688
martensitic stainless steel, Mater. Lett. 64 (2010) 1411–1414.
689
[40] D. Richardot, J.C. Vaillant, A. Arbab, W. Bendick, The T92/P92 book
690
Vallourec-Mannesmann tubes, (2000).
691
[41] Y. Song, X. Li, L. Rong, Y. Li, The influence of tempering temperature on the
692
reversed austenite formation and tensile properties in Fe–13% Cr–4% Ni–Mo low
693
carbon martensite stainless steels, Mater. Sci. Eng. A. 528 (2011) 4075–4079.
694
[42] N. Nakada, R. Fukagawa, T. Tsuchiyama, S. Takaki, D. Ponge, D. Raabe,
695
Inheritance of dislocations and crystallographic texture during martensitic reversion into
696
austenite, ISIJ Int. 53 (2013) 1286–1288.
697 698