HAL Id: hal-02136870
https://hal.archives-ouvertes.fr/hal-02136870
Submitted on 19 Dec 2019
HAL is a multi-disciplinary open access
archive for the deposit and dissemination of
sci-entific research documents, whether they are
pub-lished or not. The documents may come from
teaching and research institutions in France or
abroad, or from public or private research centers.
L’archive ouverte pluridisciplinaire HAL, est
destinée au dépôt et à la diffusion de documents
scientifiques de niveau recherche, publiés ou non,
émanant des établissements d’enseignement et de
recherche français ou étrangers, des laboratoires
publics ou privés.
A Flexible Biopolymer based UHF RFID-Sensor for
food quality monitoring
Benjamin Saggin, Yassin Belaizi, Arnaud Vena, Brice Sorli, Valérie Guillard,
Isabelle Dedieu
To cite this version:
Benjamin Saggin, Yassin Belaizi, Arnaud Vena, Brice Sorli, Valérie Guillard, et al.. A Flexible
Biopoly-mer based UHF RFID-Sensor for food quality monitoring. 2019 IEEE International Conference on
RFID Technology and Applications (RFID-TA), Sep 2019, Pisa, Italy. pp.484-487,
�10.1109/RFID-TA.2019.8892248�. �hal-02136870�
T his research was funded by European “Framework Programs for Research and T echnological Development” instrument called “Horiz on 2020” within “GLOPACK” project and by French “National Agency for Research” within “SPIDLab” project.
XXX-X-XXXX-XXXX-X/XX/$XX.00 ©20XX IEEE
A Flexible Biopolymer based UHF RFID-Sensor
for food quality monitoring
Benjamin SAGGIN Institute of Electronics and Systems
University of Montpellier Montpellier. France benjamin.saggin@umontpellier.fr
Brice SORLI
Institute of Electronics and Systems University of Montpellier
Montpellier. France brice.sorli@umontpellier.fr
Yassin BELAIZI Institute of Electronics and Systems
University of Montpellier Montpellier. France yassin.belaizi@umontpellier.fr
Valerie GUILLARD Agropolymer Engineering and
Emerging Technologies University of Montpellier
Montpellier. France valerie.guillard@umontpellier.fr
Arnaud VENA
Institute of Electronics and Systems University of Montpellier
Montpellier. France arnaud.vena@umontpellier.fr
Isabelle DEDIEU Agropolymer Engineering and
Emerging Technologies University of Montpellier
Montpellier. France isabelle.dedieu@umontpellier.fr
Abstract—This paper introduces a flexible UHF RFID
sensor to detect food quality. This sensor is based on an interdigitated capacity included in a RFID antenna on which is deposited a layer of vegetal biopolymer. Thus, depending on the food spoilage, electromagnetic coupling between the capacity and the biopolymer is used to modulate adaptation coefficient between chip and antenna of the RFID tag. This study is validated by experimental measurements of RFID-sensor exposed to real food gas environment in the process of degradation.
Keywords—RFID, sensor, UHF, EPC standard, agri-food, biopolymer, wheat gluten, food quality, food spoilage
I. INT RODUCT ION
Radio Frequency Identification (RFID) technology is increasingly prevalent in traceability and commodity management applications. This technology has the advantage of tracking stocks faster by allowing to read RFID tags affixed to products, few meters away and without direct visibility. In recent years, this technology has attracted growing interest in pharmaceutical and agri-food industry [1], including the fact that it becomes possible to add sensor information to identification [2]. Sensing property is done according to two techniques: first requires the use of an internal or external digital sensor to the RFID chip; second method, less costly and which is the subject of this paper, is based on antenna surface functionalization by a s ensitive material. In this case, the sensor information is “analog” and correlated with impedance tweak between antenna and chip. Impedance adaptation is due to the electrical complex permittivity of sensitive material that evolves following influence of physical parameter to be measured.
In this article, an RFID-sensor, studied beforehand [3], is presented and suited to agri-food field in order to produce a food packaging called "smart" as illustrated in Fig. 1. The
objective is to measure evolution of food spoilage by using a UHF RFID-sensor in complex environment composed of different gases.
II. RFID-SENSOR GEOMET RY AND DET ECTION PRINCIPLE
As noted above, a low-cost RFID-sensor is presented here, and the adaptation coefficient γ(ψ), between the antenna and a conventional RFID chip, contains the sensing parameter, the physical parameter, ψ. On RFID reader side, extracting the sensor information is to track evolution of transmitted power required to activate the tag, pTX
turn-on and/or
the reflected power by the tag, pRX
turn-on. To extract the sensor
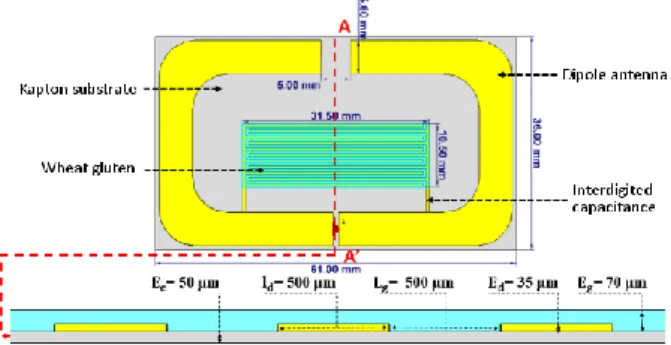
value, it is a matter of finding a relationship between physical parameter and activation power. The geometry shown in Fig. 2 is based on a folded dipole. To maximize the variation of
γ(ψ), an inter-digited capacity is connected in parallel to the
chip [4].
RFID chip used in this study is sold by Magicstrap, based on a chip NXP G2XM (ZIC = 20-j200 to 867 MHz). The sensitive
area of the RFID-sensor is represented by the blue-green zone in Fig. 2. Intended agri-food application concerns the realization of a device for monitoring degradation stage of food present in its packaging. This measurand takes very different forms depending on the nature of food [5]: increase of carbon dioxide (CO2) concentration, release of ethanol
(…) during fermentation, etc... Our choice, concerning the detection material, has been a biological element, thus subjected, also, to degradation: wheat gluten. This plant biopolymer presents a modification of its electrical
Yellow = copper, Grey = polyimide, Blue-green = wheat gluten
Fig. 2 Sensor design Fig. 1 RFID-sensor concept
permittivity properties according to several parameters [1]. Wheat gluten electrical permittivity has been characterized for different environments, to varying humidity and to the presence of different gases [6]–[8]. However, wheat gluten has not been tested in a real, complex environment (presence of various gases) and integrated into food packaging. Therefore, this RFID-sensor will be exposed to an environment, such as hermetic food packaging, where biological degradation is located, and gas concentrations are changed as well. Gas concentrations changes are main sensing targets in this paper.
The RFID-sensor is characterized by an optimal adaptation at around 928 MHz when the sensitive material is completely dry (low humidity) and it has not adsorbed gas, as shown in the Fig. 3. This graph presents simulation result, obtained using CST Microwave Studio software. Moisture variation was simulated from changes in electrical permittivity observed on gluten in previous experiments [9].
Exposure to significant relative humidity, or to various gas concentrations, increases relative electrical permittivity of the sensitive material and thus shifting optimal adaptation of RFID tag to lower frequencies and to lower gains. Of course, standard reader cannot sweep frequencies for 200 MHz, there are constrained to North American (902-928 MHz) and European (865.4-867.4 MHz) frequency bands. But, even with these limitations, many options are available. The tracking can be done for a fixed frequency and variation of power (pTX
turn-on) required to activate the tag is observable
as shown in Fig. 5. Use of Analog Identifier (AID) [10], introduced by Gaetano Marrocco, can also do it as the maturation sensitivity is held by the antenna. Covering a smaller frequency range by increasing the quality factor of the tag is planned too in near future.
III. FOOD QUALIT Y DETECTION RESULTS
The RFID reader used for this experiment is the "TagFormance Pro" model from “Voyantic”. It is used to monitor the whole RFID Ultra High Frequency band to better consider the tag behavior and to further optimize the reading with a standard reader. It is driven by a LabView program to automate activation power measurements with time.
The experiment consists in a sample of cheese subjected to natural decomposition in an enclosed environment (sealed plastic box). Concentration of dioxygen, carbon dioxide, ethanol is tracked inside a cell as well as temperature and humidity. The RFID-sensor is placed inside the cell. The reader antenna is positioned on the outer wall of the airtight box and aligned with the RFID-sensor. Each experiment lasts 4-6 days depending on the product and its fermentation cycle.
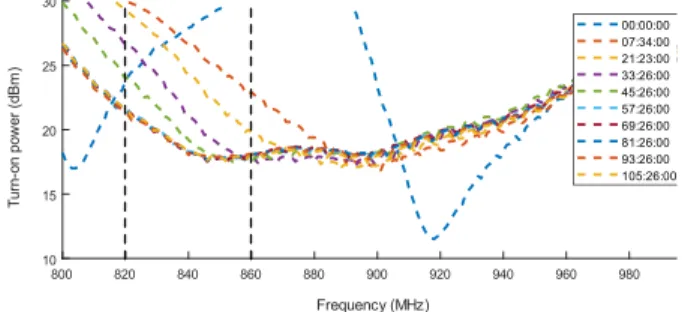
Fig. 4 shows the RFID-sensor turn-on power according to the frequency at several key moments of the experimen t: the initial measurement, the measurement once the moisture stabilization achieved as well as measurements every 12 hours.
Indeed, after moisture stabilization (starting at
t=07:34:00) as shown in Fig. 4, decrease of sensor quality
factor is noted. It is due to wheat gluten changing its permittivity with gas releasing because of food maturation.
In order to better understand the behavior of the RFID-sensor, temporal plots of the turn-on power, PTX
turn-on, is
presented in Fig. 5. Focus is made on two fixed frequencies, 820 MHz and 860 MHz, as they exhibit significant variations in PTX
turn-on.
In Fig. 5 graph, there are mainly three distinct areas. Firstly, moisture stabilization phase, which starts after cell is locked. Meanwhile, PTX
turn-on evolves in a chaotic way
between 18 and 30 dBm. Then comes food maturation phase, during which food rejects CO2 (curve in orange) and
consumes dioxygen (curve in pink). During this phase PTX turn-on decreases monotonically for both frequencies. Finally, the
fermentation phase during which food spoils by releasing ethanol (green curve). Here PTX
turn-on no longer evolves and
keeps a constant value of 22 dBm and 18 dBm, respectively for the frequencies 820 MHz and 860 MHz. Correlation between PTX
turn-on and food maturation is possible in the
maturation phase, power evolves following the pace of evolution of dioxygen with a variation of 8 dB (at 820 MHz) among a variation of 20% dioxygen. Stable RFID-sensor
Fig. 4 Behavior of the sensor studied in relation to the maturation of food Fig. 3 Sensor frequency behavior in relation to the maturation of food
turn-on power during fermentation phase can be linked to a gas saturation of the biomaterial.
IV. GAS CONCENT RATION DETECTION TEST
To confirm that the RFID-sensor can sense the dioxygen and/or carbon dioxide concentration, it is exposed to multiple gas concentration steps. At the beginning of the experimen t, O2 and CO2 concentrations were 100% and 0%, respectively.
These rates will reverse, gradually by 20% every hour, 53 minutes after the start of the experiment. And this, in order to simulate, in an accelerated manner, the behavior of a maturing food.
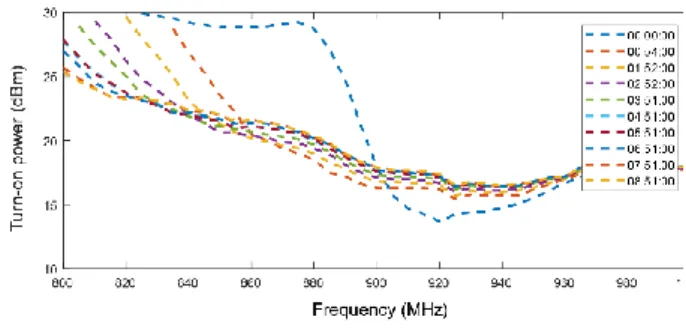
In order to better appreciate the response of the sensor, evolution in PTX
turn-on frequencies at several moments is
presented in Fig. 6. Several measurements are shown in this graph: initial measurement, measurement when the concentrations inversion has started, and an hourly measurement.
Besides a significant variation in the frequency response during moisture stabilization, a degradation of the quality factor is observed after the first 53 minutes.
The graph, Fig. 7, shows two temporal plots of PTXturn-on
at frequencies of 830 MHz and 860 MHz. CO2 concentration
evolution is plotted on the same graph.
As shown in Fig. 7, the initial step, which held the stabilization phase, goes with PTX
turn-on decrease of about 7
dBm for the 830 MHz frequency. The developed sensor appears to follow the rise in CO2 concentration, which goes
hand-down with a decrease in O2 and have the same behavior
to the experiment described in Fig. 5. Moreover, it is observed that the last CO2 concentration step does not induce
modification on PTX
turn-on. This is due to gluten saturation for
extreme CO2 concentrations, exceeding 80%.
At the frequency of 860 MHz, the RFID-sensor is estimated to be very insensitive to changes in gas concentration at this frequency, as seen in Fig. 5 and Fig. 7.
In order to check the influence of gluten coating, this experiment is conducted on a tag without wheat gluten layer and results are presented in Fig. 8. Time between CO2-O2 step is increased to 8 hours to ensure that the inter-digitated capacity is not sensitive to gas concentration.
One could observe fluctuations of turn-on power due to moisture stabilization at the start of the experimen t. Nevertheless, this change is really small compared to standard reader power step detection. Without gluten coating, the interdigitated capacity is not capable for gas concentration detection as the sensor turn-on power does not fluctuated significantly.
V. CONCLUSION
This study shows that RFID-sensor based on biopolymers can monitor food maturation by shifting its optimal adaptation.
The enclosed environment of food packaging being a complex environment by the presence of different gases in various concentrations. Investigation of the influence of CO2
on the sensor response is done to determine the origin of variations observed. A significant effect on quality factor is observed as a function of CO2 concentration. Indeed, this one
decreases for the two experiments presented.
However, it should be noted that previous studies have shown that moisture represents the main source of variation of the sensor response in the first few hours. Plan to test the sensor by exposing it to an ethanol-laden environment is needed in order to have a complete understanding behavior of the sensor.
ACKNOWLEDGMENT
The authors would like to thank the ANR LabCom and the H2020 Glopack project to funding this work. They would like also thank T. Cohen for his technical assistance.
REFERENCES
[1] F. Bibi, C. Guillaume, N. Gontard, and B. Sorli, “A review: RFID technology having sensing aptitudes for food industry and their contribution to tracking and monitoring of food products,” Trends in Food Science &
Technology, vol. 62, pp. 91–103, Apr. 2017.
[2] A. Rida, L. Yang, and M. M. Tentzeris, RFID-enabled
sensor design and applications. Boston: Artech House,
2010.
[3] A. Vena, B. Sorli, Y. Belaizi, B. Saggin, and J. Podlecki, “An Inkjet Printed RFID-enabled Humidity Sensor on Paper based on Biopolymer,” 2019.
[4] Y. Belaizi, A. Vena, B. Sorli, and F. Bibi, “Capteur d’humidité flexible par RFID UHF passif,” in 20èmes
Journées Nationales Microondes, Saint-Malo, France,
2017.
[5] E. Caplice and G. F. Fitzgerald, “Food fermentations: role of microorganisms in food production and preservation,” International Journal of Food Microbiology, vol. 50, no. 1, pp. 131–149, Sep. 1999.
Fig. 7 Sensor temporal behavior to gas concentrations
[6] F. Bibi, C. Guillaume, A. Vena, N. Gontard, and B. Sorli, “Wheat gluten, a bio-polymer layer to monitor relative humidity in food packaging: Electric and dielectric characterization,” Sensors and Actuators A:
Physical, vol. 247, pp. 355–367, Aug. 2016.
[7] F. Bibi, C. Guillaume, N. Gontard, and B. Sorli, “Wheat gluten, a bio-polymer to monitor carbon dioxide in food packaging: Electric and dielectric characterization,”
Sensors and Actuators B: Chemical, vol. 250, pp. 76–84,
Oct. 2017.
[8] F. Bibi, C. Guillaume, B. Sorli, and N. Gontard, “Plant polymer as sensing material: Exploring environmental
sensitivity of dielectric properties using interdigital capacitors at ultra high frequency,” Sensors and
Actuators B: Chemical, vol. 230, pp. 212–222, Jul. 2016.
[9] F. Bibi, “Etude des propriétés diélectriques à haute fréquence d’un polymère végétal : le gluten de blé, et utilisation comme biocapteur de marqueurs environnementaux de la qualité des aliments dans des systèmes RFID passifs,” Montpellier, 2015.
[10] G. Marrocco, “RFID Grids: Part I—Electromagnetic Theory,” IEEE Transactions on Antennas and