by
MICHAEL G. FITZGERALD B.S., UNIVERSITY OF NEW ORLEANS
(1974)
SUBMITTED IN PARTIAL FULFILLMENT OF THE REQUIREMENTS FOR THE DEGREE OF
DOCTOR OF PHILOSOPHY
at the
MASSACHUSETTS INSTITUTE OF TECHNOLOGY and the
WOODS HOLE OCEANOGRAPHIC INSTITUTION SEPTEMBER, 1980
Signature of Author.
/
i' G'u /Joint Program in Oceanography, Massachusetts
Institute of Technology - Woods Hole Oceanographic
Institution, and Department of yarth & Planetary
Sciences K4assachusetts Institute of Technology, September, 1980.
Cert if ied by. . . ... . . . . . . . . . . .
Thesis Supervisor
Accepted by. . . . -.
Chairman, Joint Oceanography Committee in the
Earth Sciences, Massachusetts Institute of
Technology - Woods Hole Oceanographic Institution
MASSACHUSETTS INSTITUTE
OF TECHNOLOGY
AUG 1l
1980
ANTHROPOGENIC INFLUENCE ON THE SEDIMENTARY REGIME OF AN URBAN ESTUARY -- BOSTON HARBOR
Michael G. Fitzgerald
Submitted to the Woods Hole Oceanographic Institution-Massachusetts Institute of Technology Joint Program in Oceanography on June 2, 1980, in partial fulfillment of the requirements for the degree of Doctor of Philosophy.
Abstract
Boston Harbor (and its approaches) is a glacially carved, tidally dominated estuary in western Massachusetts Bay.
Characterized by low river discharge and significant human impact, the harbor is typical of many bays and estuaries along the New
England coast.
The sands and gravels that floor Massachusetts Bay and the harbor approaches are relict glacial sediments, but in areas of
fine-grained sediments, Holocene sedimentation rates have averaged 0.015 cm/yr. In the harbor itself, modern organic-rich sediments are accumulating in several depocenters at an estimated rate of 0.2-0.3 cm/yr. The high organic matter content (greater than 10%) of these modern sediments is attributed in part to anthropogenic wastes. Decomposition of this organic material and subsequent
production of methane gas render the sediment impenetrable to
acoustic energy, facilitating the mapping of these modern deposits. Wastes rich in trace metals are discharged into the harbor from the sewage treatment facility at Deer Island and from numerous point sources in the Inner Harbor. Organo-metallic complexes and iron oxide coating on suspended particles and bottom sediment appear important in the transport and retention of these metals.
Calculations suggest that at least 33% of the metal discharged into the outer harbor is retained. Trace metal profiles in the bottom sediments reflect the increasing use and discharge of these metals
during the past 100 years. Large variations in several cores may be
related to circulation changes accompanying the closing of Shirley Gut in 1936.
In the water column, silt and clay sized mineral grains are suspended together in organically bound agglomerates. The organic film binding these particles is a by-product of biological activity and aids in the deposition of particulates and pollutants.
seems to form a transition between the more silty and less mobile
subsurface sediments and the suspensates of the turbid water column. The redistribution of natural sediments (resuspension/
advection) is a key depositional process, accounting for as much as 70-80% of the material deposited in the harbor. Harbor circulation indicates that Massachusetts Bay may be an important source for this material. Human activity may enhance the ability of the harbor to retain this redistributed material by stimulating biological
production (organic film) and supplying lipid-rich organic material
through waste disposal.
Boston Harbor is an efficient sediment trap. Long flushing times and landward bottom drift aid in the retention of fine-grained
wastes, whose impact on the biological and chemical environment of the harbor can be severe. Other estuaries along the coast of New
England may operate in similar ways with respect to waste dispersal.
Thesis Advisor: Dr. John D. Milliman
Associate Scientist Ti tle:
ACKNOWLEDGMENTS
So many contribute to the writing of a thesis. John
Milliman, my advisor and friend, I thank above all for his invaluable guidance and support. Michael Bothner has provided
insight, suggestions, and the use of his laboratory, and has
shared generously both work and data; I am deeply grateful. The other members of my committee, David Aubrey, John Southard, Robert Beardsley, and Brian Tucholke, I thank for their
constructive comments and assistance.
Jean Whelan, I thank for her important contribution to my work and Zofia Mlodzinska for her many nutrient analyses. My
studies have benefited greatly from discussions with Elazar Uchupi, K.O. Emery, Susumo Honjo, Pat Lohmann, and Colin
Summerhayes.
I thank David Ross and Ellen Gately of the W.H.O.I.-Sea Grant Office for their help in obtaining funds for this research. In addition, the U.S. Geological Survey has on
numerous occasions provided equipment and expertise, and I am
Angela Sousa for typing (under pressure) this thesis and the proposals that funded it. Special thanks go to W.H.O.I. Graphic Services, especially Laurie Raymond and Liz Fye, for their fine work. To Dick Coburn, skipper of the R/V ASTERIAS, may thanks for his infinite patience with science.
Finally, I thank my dear friends for being there to work or to play. And to my wife Barbara for a smile that wipes away
Table of Contents
Page
I. Abstract 2
II. Scientific Objectives 16
III. Introduction 17 a. Environmental Setting 18 b. Geography 23 c. Hydrography 23 d. Bottom Topography 27 e. Geologic Setting 30 CHAPTER 1
IV. Bottom Sediments 34
a. Subsurface Geology 34
1. Acoustic Basement 38
2. Transparent Layer 38
b. Bottom Sediment Thickness 48
c. Texture and Composition 52
1. Size Distribution 59 2. Composition 64 a. Inorganic Components 64 b. Calcium Carbonate 65 c. Organics 66 CHAPTER 2
V. Pollution History -- Trace Metal Accumulation 83 a. Surface Distribution of Trace Metals 83
1. Previous Work 83
2. Present Study 89
b. Downcore Variations in Sediment
Characteristics 104 1. Sediment Texture 104 2. Organic Carbon 108 3. Metals 108 c. Sedimentation Rates 131 d. Interpretation 141 e. Trapping Efficiency 142
Table of Contents (continued)
Page CHAPTER 3
VI. Suspended Sediments and Water Quality 148
a. Circulation 148
b. Previous Studies 161
c. Water Properties and Suspended Matter 163 d. Statistics -- Characterization of Seston
Source 188
e. Suspended Matter and Its Relation to
Bottom Sediments 194
1. Dispersal of the Deer Island Sludge Plume 194
2. Organic Film 204
3. Sediment Trap 211
f. Schematic Model of Suspended Matter Regime 217
VII. Synthesis 222
VIII. Recommendations for Future Work 229
IX. Acknowledgments of Support 232
X. Biographical Sketch 233
XI. References 234
XII. Appendix I 242
a. Field and Laboratory Techniques 242
1. Seismic Operations 242 2. Bottom Sediments 243 3. Suspended Sediments 245 a) Field Work 245 b) Laboratory Analyses 247 XIII. Appendix II 249 a. Cruise-by-cruise examination of
LIST OF FIGURES Page Figure 1. Figure 2 Figure 3. Figure 4. Figure 5. Figure 6. Figure 7. Figure 8. Figure 9. Figure 10.
Map of sewer outfalls and storm--sewer overflows
in Boston Harbor
Geography of Boston Harbor and its approaches. Dashed lines refer to shipping lanes.
Bathymetry of Boston Harbor and its approaches contoured from 1973 U.S. Coast and Geodetic Survey chart.
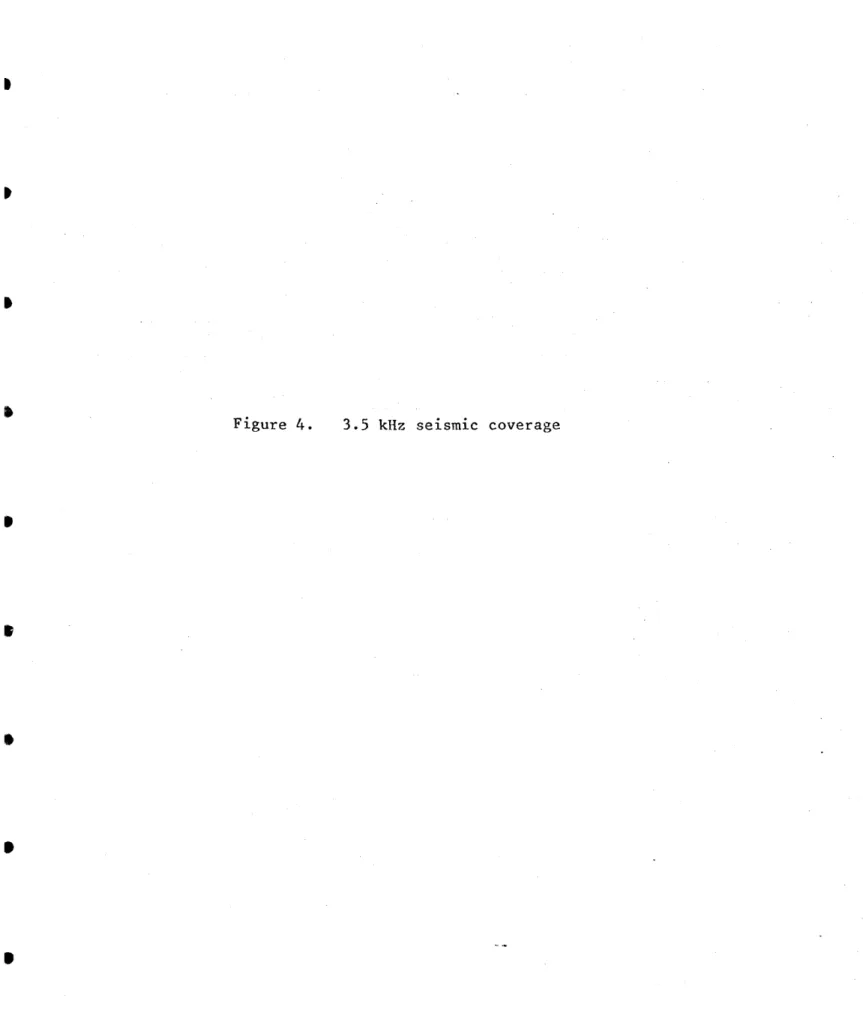
3.5 kHz seismic coverage
Selected 3.5 kHz profile showing the irregular and complex surface of the acoustic basement (A). Sediment surface (S) is indicated.
Vertical scale is approximately 50 m (1/16 sec); horizontal scale 1 km.
Topography of the acoustic basement (relative to mean sea level). Offshore data taken from
Willett et al. (1972). Boston Harbor data from this study.
3.5 kHz profile, taken near the outer islands, showing the acoustic character of the
"transparent layer" as described by Meisburger (1976). Sediment surface (S), acoustic basement (A), and "blue reflector" (R) are labelled. Vertical scale is approximately 50 m 1/16 sec); horizontal scale .75 km.
3.5 kHz profile taken southeast of Long Island showing the extensive layering characteristic of much of the harbor. Sediment surface (S) and acoustic basement (A) are labelled. Vertical scale is approximately 50 m; horizontal scale .8 km. "Ringing" section is an acoustically turbid
zone (see text).
Isopach map, contoured in milliseconds two-way travel time, of sediment over acoustic basement. Grab sample locations used by Mencher et al.
(1968). 36 40 42 45
48
50Figure 12. Figure 13. Figure 14. Figure 15. Figure 16. Figure 17. Figure 18. Figure 19. Figure 20. Figure 21. 1976).
Core and grab sample locations (this study.
Surficial sediments of Massachusetts Bay (from Willett et al., 1972).
Distribution of mud, material finer than 62 microns. Based on samples from Mencher et al., 1968, and this study.
Percent organic 'arbon in surficial sediments (this study).
Distribution of organic matter. Based on samples from New England Aquarium (1972), and this study. Percent organic carbon versus percent clay in grab samples from Boston Harbor and its
approaches. Triangles represent offshore samples taken by Hathaway (1971). Line approximates carbon/clay relationship for offshore samples. Ratio of carbon to total nitrogen in grab samples (this study).
Acoustically turbid zone (location shown in Figure 20). Sediment surface (S) and acoustic basement (A) indicated for reference. Vertical
scale is approximately 50 m (1/16 sec); horizontal scale is 1.5 km.
Distribution of acoustically turbid zones in Boston Harbor (indicated by *). Heavy line A-A' indicates location of profile shown in Figure 19. A. Distribution of lead in the surficial
sediments of Boston Harbor (taken from White, 1972).
B. Distribution of chromium in surficial sediments of Boston Harbor (taken from White, 1972).
Figure 22. Figure 23. Figure 24. Figure 25. Figure 26. Figure 27. Figure 28. Figure Figure Figure Figure Figure Figure 29. 30. 31. 32. 33. 34. Figure 35. Figure 36.
Concentration of lead (ppm dry weight) in the grab samples from this study.
A. LEAD VS. ORGANIC CARBON (in grab samples)
B. LEAD VS. CLAY CONTENT (in glab samples)
R-Scores for factor I. Positive values are associated with the most highly contaminated
samples.'
Factor I vs. Factor II. Plot effectively divides samples into three categories (see text).
Down-core variations in mud (silt plus clay) and clay (<4 microns) for cores: C2-78, C3-78, C4-77, C5-78, C7-77, C8-78, C9-78, and CIl-78.
Down-core variations in organic carbon content. Organic carbon (%) vs. clay content (%) for cores C2-78, C3-78, C4-77, C5-78, C7-77, C9-78, C10-78, and CI-78. Line represents the carbon/clay relationship of grab samples from Massachusetts Bay (Figure 17).
Trace metal profiles for core C2-77. Trace metal profiles for core C3-77. Trace metal profiles for core C4-77. Trace metal profiles for core C5-77. Trace metal profiles for core C7-77.
Profiles of Factor I for cores C2-77, C3-77, C4-77, C5-77, and C7-77.
Cores selected for 2 10Pb-dating. Cores C2, C4, C5, and C7 were taken in 1977. The remaining cores were collected in 1973.
Profile of excess 2 10Pb for C2-77, C4-77, C3-78, C5-77, and C9-78. X's indicate samples assumed to have background levels of 2 10Pb.
10. Page 92 94 99 101 107 110 112 115 117 119 121 123 130 134 137
Figure 37. Figure 38. Figure 39. Figure 40. Figure 41. Figure 42. Figure 43. Figure 44.
Tidal excursion segments defined by Ketchum
(1951). Numbers refer to accumulation factor, or
flushing time (in number of tides), for each segment.
Nontidal component of current meter record (averaged over an integral number of tidal cycles) at several harbor locations. Note general counterclockwise circulation. Data supplied by NOAA/Circulatory Surveys Branch.
A. Tidal variations of current speed at station
BH3 (in the shipping channel near Deer
Island), October, 1978.
B Progressive vector diagram of near-bottom
currents (measured hourly with a direct reading ENDECO current meter).
C. Progressive vector diagram of surface currents.
Recovery locations of surface and bottom drifters.
A. Released from New England Aquarium (NEA) and station BH1
B. Released from station BH3
Suspended matter and water quality stations. Tidal variations (summer):
A. Temperature, salinity, nitrite, and noncombustible seston at BH1;
B. Temperature, salinity, ammonia, and noncombustible seston at BH3;
C. Temperature, salinity, ammonia, and noncombustible seston at BH4.
Tidal variations (summer) in temperature, salinity, ammonia, and noncombustible seston: Photomicrograph of mineral grain from suspended matter sample. Back-scattering x-ray pattern
reveals the presence of Cu (at 08) and Fe (between 06 and 07). Page 150 153 156 159 165 167 170 173
Figure 45. Figure 46. Figure 47. Figure 48. Figure 49. Figure 50. Figure 51.
Tidal variations (autumn):
A. Temperature, nitrite, nitrate, and noncombustible seston at BHi;
B. Temperature, salinity, ammonia, and noncombustible seston at BH3;
C. Temperature, salinity, total seston, and noncombustible seston at BH4.
A. Photograph showing carbonate laths (crossed-nichols)
B. Photomicrograph showing carbonate lath bundle.
Tidal variations (winter):
A. Temperature, salinity, nitrate, and noncombustible seston at BHi;
B. Temperature, salinity, ammonia, and
noncombustible seston at BH3;
C. Temperature, sal.inity, ammonia, and noncombustible seston at BH4.
A. Photomicrograph showing abundance of organic film in autumn surface sample from BHl
(flood tide, September, 1979).
B. Photomicrograph showing paucity of organic material in winter sample from BHl (flood tide, January, 1978).
Tidal variations (spring):
A. Temperature, salinity, nitrate, and noncombustible seston at BHI;
B. Temperature, salinity, ammonia, and noncombustible seston at BH3;
C. Temperature, salinity, ammonia, and noncombustible seston at BH4.
A, B, C, Tidal variations of R-scores for Factor I for station BHi: October (1978), May (1979), and September (1979),
respectively. See Table 12 for description of these factors.
A, B, C. D. Tidal variations of R-scores for Factor I for station BH3:
October (1978), February (1978), May (1979), and September (1979),
respectively. See Table 13 for description of this factor. 12. Page 176 179 181 184 187 191 198 ---
---Figure 52. Figure 53. Figure 54. Figure 55. Figure 56. Figure 57. Figure 58. Figure 59. Figure 60. Figure 61. Figure 62. Figure 63. Figure 64. Figure 65.
200 kHz profile showing the Deer Island plume
rising to the water surface and spreading. The
water surface (S) and harbor bottom (B) are
labelled.
Path of surface drogue released in the "boil" of the Deer Island plume.
Photomicrograph of organically bound floc. Locations of sediment trap arrays.
Schematic model of suspended sediment regime. Suspended matter and water quality stations.
Tidal variations at station BH3, August 1977.
Tidal variations at station BH1, August 1977.
A. Tidal variations at station B11, November,
1977.
B Tidal variations at station BH3., November,
1977.
A. Tidal variations at station BHl, January
1978.
B. Tidal- variations at station BH3, January
1978.
A. Tidal variations at station BHl, May 1978. B. Tidal variations at station BH3, May 1978.
A. Tidal variations at station' BH1, July 1978. B. Tidal variations at station .BH3, July 1978.
A. Tidal variation of oxygen saturation at station BHI.
B. Tidal variation of oxygen saturation at
station BH3.
A. Tidal variations at station BHl, October
1978.
B. Tidal variations at station BH3, October
1978. Page 203 206 209 214 220 251 253 256 259 264 269 271 277 280
14. Page Figure 66. Figure 67. Figure 68. Figure 69. Tidal variations 1979. Suspended matter Tidal variations Tidal variations Tidal variations 1979. Tidal variations 1979. at station BH3, variations. at station BH1, at station BH3, at station BH1, at station BH3, February May 1979. May 1979. September September
Tidal variations of chlorophyll a at station BHi and BH3. 284 289 294 297 I ANWAVOWAWNI
--LIST OF TABLES
Page Table
1 Pleistocene stratigraphy of Boston Harbor 32
2 Size partitioning of the organic carbon 74
3 Organic analysis of selected grab samples 74
4 Trace metal concentrations in the surface sediments
of Boston Harbor 85
5 Factor analysis of geochemical data on grab samples 97
6 Trace metal correlation matrix (grab samples) 103
7 Surface enrichment of trace metals in cores C2, C3,
C4, C5 and C7 125
8 Correlation matrix for core data 126
9 Principal factors identified from the geochemical
data of cores 127
10 Summary of sedimentation rates 140
11 Input of trace metals (Cd+Cu+Ni+Zn) into Boston Harbor by the Deer.Island Treatment Plant
(including the Nut Island sludge) 144 12 Factor analysis of water quality data for BHl
(diurnal sampling)
(1) Main factors controlling variance
(2) Percentage of variance explained by each factor
(3) Factor loadings within each factor (
)
19513 Factor analysis of water quality data for BH3 (diurnal sampling)
(1) Main factors controlling variance
(2) Percentage of variance explained by each factor
(3) Factor loadings within each factor
(
)
196.36.
11.
Scientific ObjectivesThis thesis reports the findings of a three-year study designed to establish and explain the past and present patterns of movement and accumulation of sediment in Boston Harbor, with
particular emphasis on ant-hropogenic wastes and their influence on natural processes. Because of its small riverine input and
extensive urban influence, Boston Harbor offers an opportunity to assess the nature of man's impact on depositional processes.
Several basic (and related) questions outline the task: what types
of sediment cover the harbor floor; where are they concentrated, and
why; what are the sources of these sediments; do pollutants
accumulate in the harbor and at what rate; how effective is the harbor at retaining these pollutants; by what mechanisms are these pollutants transported; how does the composition of suspended particulates compare to bottom sediments; how does the suspended particulate regime change with time (tidally and seasonally)? Answers to these questions are vital to harbor management schemes aimed at improving existing conditions and minimizing future adverse impact. Three main research programs address the questions raised:
1) determine the character, distributionthickness, and sources of
bottom sediments; 2) define the accumulation history of pollutants (trace metals) in the harbor; and 3) relate the suspended
particulate.regime to the recent sedimentary history of the harbor. These programs are the topics of the major divisions of this
thesis. The collected samoles are stored in the Data and Earth Sampling Center of the -Woods Hole Oceanographic Institution. The data on which this report is based will appear in a separate data
file (Ellis et al., 1980).
III. Introduction
Estuaries, a critical transition between land and the sea, exhibit a wide range of hydrographic and ecologic
conditions. As such, the estuarine environment is far more important than its physical dimensions would imply. For example, estuaries form a major sink oF modern fluvial, and marine sediments (Meade, 1972) as well as provide spawning grounds for many fish and invertebrates (Officer, 1976). However, because many major cities are located on or near
estuaries, this fragile environment is exposed to a diversity of pressures: economic activities (such as fishing and
shipping) often conflict directly with recreation (e.g., bathing and boating), as do engineering projects (such as dredging, mining, and sewage dumping). Unfortunately the complexity of estuarine processes often makes the effects and interactions of various anthropogenic forces more difficult to understand. Clearly, however, coastal management schemes must incorporate a knowledge of both the dynamic regime within the estuary and the effects of man's activities in order to maintain that estuary as a viable economic and esthetic resource.
18.
a. Environmental Setting
Boston Harbor and its neighboring waters face environmental problems similar to many other harbors and estuaries adjacent to large urban centers. Man's activity, both on land and in the estuary itself, has greatly affected harbor configuration (through extensive landfill operations),
freshwater runoff, and water quality.
The discharge of domestic and industrial wastes into the harbor has made a major and lasting effect on this
environment. The serious nature of this environmental
contamination is reflected in the dramatic reduction in acreage open for shellfishing. Presently 9 sq. km of the harbor are
closed to shellfishing with another 10 sq. km restricted
(Boston Globe, December 10, 1979). The extent of the pollution of bottom sediments in portions of the harbor is shown by the character of the benthic communities in these areas (FWPCA,
1969; Stewart, 1968; Normandeau Assoc., 1975). Opportunistic
polychaete worms and-amphipods, typical of sediments stressed by human and industrial wastes, dominate the soft bottom community of the harbor. Five genera compose the polychaete assemblage: Polydora, Nephthys, Phyllodoce, Etcone, and Tharyx, and one
species, Polydora ligni, predominates. Of the three genera (Ampelisca, Corophium, and Lysianopsis) comprising the amphipod assemblage, Ampelisca is the most common, often outnumbering
Boston Harbor receives the discharge of municipal wastes from the 43 dommunities served by the Metropolitan District Commission (MDC). Efforts to cope with the problem led to the construction of the.two existing primary treatment plants, fed
by 225 miles of interceptor sewers. -Five of the older
communities in the 36 square mile downtown area have combined sanitary and stormwater sewers that overflow into the rivers at hundreds of discharge points (Figure 1). Additional pollution
sources include industrial waste discharges, shipping wastes, and debris from rotting dock facilities.
Municipal wastes discharged at the mouth of the harbor from outfalls at the twenty-five year-old Nut Island treatment plant and the eleven-year-old Deer Island facility carry a sizeable pollutant load. The Nut Island plant contributes 123 million gallons per day (MGD), and Deer Island over 329 MGD of chlorinated primary sewage to the harbor waters (MDC Annual Report, 1975). The flow from these two plants is equal to three-quarters of the average flow of all rivers emptying into the harbor. A third outfall, which discharged raw sewage from Moon Island for eighty years, contributed a considerable amount of material. prior to its closing in 1969.
Map of sewer outfalls and storm-sewer overflows in Boston Harbor.
20.
22.
At present, approximately 100 tons of solid material
from the waste treatment plants are flushed daily into the
harbor at ebbing tide to enhance the dispe-sion of this
material into Massachusetts Bay. Evidence suggests, however, that some of this sediment accumulates in the harbor (Bumpus et
al., 1953), and McLeod (1972) has estimated that at least 20%
of the sewage spoils are retained. In addition to the organic
load, the sludge contains waste oils, trace metals, and chlorinated hydrocarbons. Waste oils make up 2% of the net weight of the organic material in the sludge, or some 1,360 kg per day (Gilbert et al., 1972). During September, 1979, Deer Island alone discharged some 200 kg of lead per day (MDC flow-records).
Boston Harbor presents a managerial and environmental dilemma. Currently, local, state, and federal agencies are in the throes of a debate concerning a harbor cleanup plan and the 1 billion dollars allocated for it. To comply with the Federal Clean Water Act, Boston must upgrade its system to secondary treatment by 1983, unless MDC can secure a waiver allowing primary effluent to be pumped far out to sea. Decisions, hampered by the paucity of data on the harbor environment,are based solely on engineering and political considerations,and action is expected to be long delayed by litigation.
b. Geography
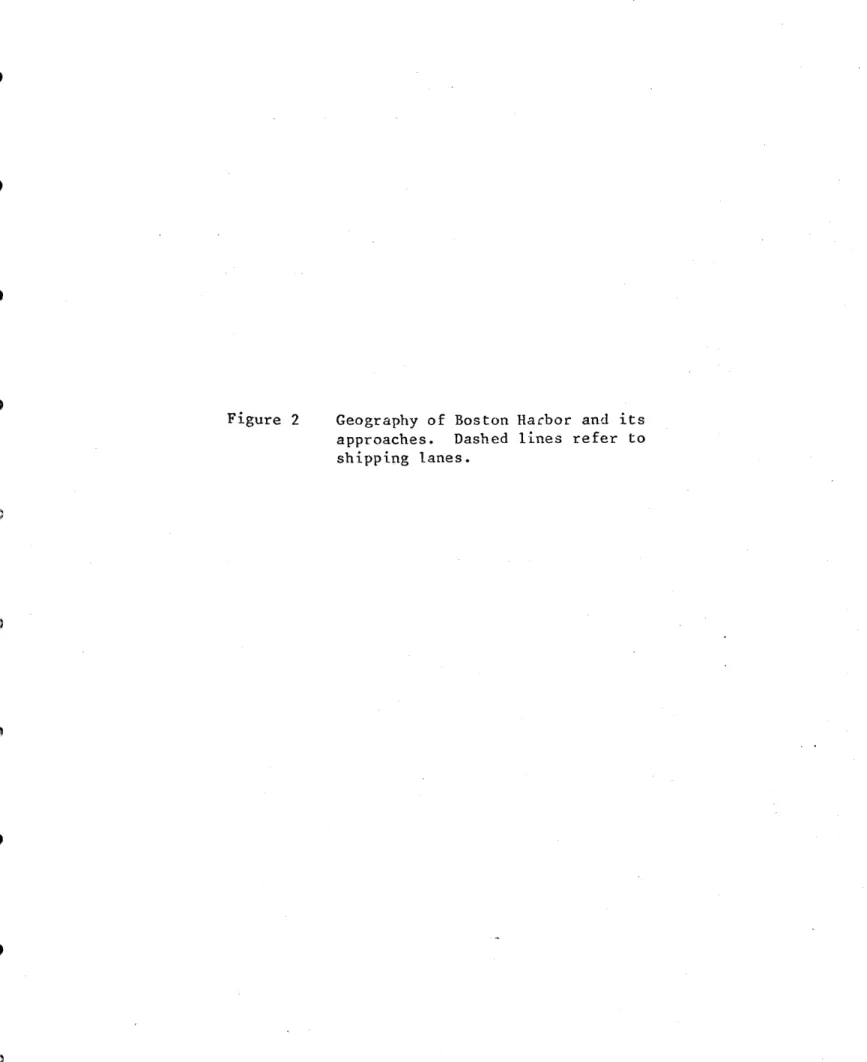
Boston Harbor and its 31 associated islands cover an area of 114 square kilometers in westernmost Massachusetts Bay (Figure 2). Draining into the harbor along its 190 km
shoreline are the Charles, Mystic, Chelsea, Neponset, Weymouth Fore, and Weymouth Back Rivers. The natural configuration of Boston Harbor and the recent construction of causeways between various harbor islands have effectively divided the harbor into
two major subdivisions: 1) the Inner Harbor, Dorchester Bay, Deer Island Flats, and President Roads to the north, and 2) Quincy Bay, Hull Bay, Hingham Bay, and Nantasket Roads to the
south and east.
c. Hydrography
The harbor has little freshwater influx. The Charles, Mystic, and Chelsea Rivers contribute freshwater to the Inner Harbor at an approximate rate of 15 to 40 m 3/sec
(Karpen, 1974) - the Charles, though dammed, accounting for more than half of all freshwater flow into the harbor. Bumpus et al. (1951) estimate the flushing time for freshwater in the Inner Harbor at 2 to 12 days depending on river discharge, while the flushing time for the entire harbor is 42 days.
A thin wedge of water of less than 29 0/oo
(4-29 O/oo) occupies the surface layers from the Mystic River seaward throughout most of the length of the Inner Harbor.
24.
Figure 2 Geography of Boston Harbor and its approaches. Dashed lines refer to shipping lanes.
42020'
48'1
42*14'
26.
This fresher water is underlain by water of salinity between
30.0 and 31.0 /oo. This intermediate wedge of water extends
out across President Roads to Deer Island. In the approaches, salinities are generally greater than 32.0 0/oo, though
spring freshening (due to increased runoff) decreases salinities throughout the area.
From December through March the water column in Boston Harbor and Massachusetts Bay is virtually isothermal, reaching
its minimum temperature in late February; surface temperatures 0
during this period range between 0 and 6 C. In April vernal warming heats the surface layers, continuing through August, with surface temperatures reaching 18 C (Bumpus et al., 1953; Bumpus, 1974).
Semi-diurnal tides (mean range of 2.7 m) are primarily. responsible for water exchange in the harbor (Bumpus et al.,
1953; New England Aquarium, 1973). On a volume flow
relationship, the residence time is slightly under two tidal cycles. However,,because many areas have sluggish- circulation, complete flushing presumably takes longer. Maximum current velocities approach 100 cm/sec between Deer Island and Long
Island three hours after flood, but in most areas maximum surface velocities are less than 50 cm/sec (Folger, 1972).
Wave directions are predominantly from the SW through W in summer, NW and N to NE in winter, corresponding to the prevailing wind system (Bumpus et al., 19-53). Wave heights
offshore usually range 1-2m from November through April and
O-lm the remainder of the year. Landward of the outer islands, lower sea states will prevail for SW, W, NW, and N winds due to limited fetch. Swells within the harbor are predominantly low,
though occasional medium and high swells accompany NE and E
winds.
d. Bottom Topography
The submarine bottom topography of Boston Harbor and western Massachusetts Bay (Bumpus et al., 1951; Meisburger,
1976) is characterized by irregular (hummocky) terrain
possessing considerable relief (Figure 3). The seabed includes a system of NE-SW trending, steep-sided, rough-topped,
discontinuous rock ledges and troughs. Northeast of The Graves (Figure 2), the trend of the elevations changes to NW-SE,
possibly indicating a change from bedrock to glacial sediments (Bumpus et al., 1951). Away from these rock ledges glacial deposition probably controlled the bathymetric
characteristics. The majority of harbor islands owe their relief to the presence of glacial drumlins, whose long axes are oriented roughly in an E-SE direction (LaForge, 1932).
Postglacial erosion and deposition (including man's activities) have modified bottom morphology throughout the harbor area.
More than three-quarters of the harbor has a depth (mean low water) of 3m or less. However, two major shipping channels provide Boston Harbor with effective connections to
Bathymetry of Boston Harbor and its approaches, contoured from 1973 U.S. Coast and Geodetic Survey chart.
28.
22' 16 12 22 .... ... -12 400 6 2: 20' AA 183' 18, 'MOON IS. NUT
IS
.Q)4
BATHMTY OF BOSTON HARBO0R
...AND APPROACHE
ADAPTED FROM US. COAST AND CNORITRA
M.-GEODETIC SURVEY MAP (1973 SCALE 1:25,00
70*50'
30.
Massachusetts Bay: President Roads, with a mean low water depth (MLW) of 12 m and Nantasket Roads, with a MLW depth of 9 m. Prior to its closing in 1936, Shirley Gut (Figure 1) also provided an important connection with Massachusetts Bay for
tidal exchange.
e. Geologic Setting
Boston Harbor lies wholly within the Boston Lowland, a structural and topographic basin underlain by faulted and
folded Paleozoic clastic sediments (Pre-Devonian) with-interbedded andesitic volcanics of the Boston Bay Group
(LaForge, 1932). Post-depositional erosion carved an irregular surface into the bedrock before the onset of-Quaternary
glaciation (Upson and Spencer,1964). This old topography, which now forms the bedrock surface under the Boston Lowland, was later modified by glacial ice masses and subsequently buried by glacial drift, alluvium, and coastal deposits.
Basement rocks trend to the northeast and slope
generally seaward. A few highs in the old topography outcrop on the seafloor and form some of the islets in Boston harbor and its approaches. Elongated, deep areas represent former drainage pathways. The apparent convergence of these valleys toward Point Shirley and the depth to basement (68 m below MLW) suggest a major outlet valley beneath the former position of
Except for bedrock exposures throughout the area, most
surficial and shallow subsurface deposits consist of Quaternary
glacial and glaciomarine sediments. In general, these glacial
deposits lie directly upon the bedrock surface and are thickest in ancient bedrock valleys (see below). Holocene fluvial and coastal marine deposits are important only locally.
The record of Pleistocene glacial and interglacial stages in the Boston region is fragmentary (Table 1); however, the bulk of glacial deposits in the area are probably of
Wisconsin-age (Kaye, 1961). Presumably pre-Wisconsin
continental glaciers deposited drift, though evidence of such past events has been largely obliterated by subsequent glacial erosion. During excavation under Boston Common, Kaye (1961)
did find evidence of four, and possibly five, ice advances and three marine transgressions (pre-Wisconsin deposits). The oldest widespread deposit of Pleistocene age in the Boston area
is a discontinuous drift layer (Drift III) which Kaye (1961) believed was deposited during the early Wisconsin-Iowan substage.
After retreat of the glacier associated with Drift III, the area was inundated,and a layer of glaciomarine clay (Clay III) was deposited. A second period of emergence followed the deposition of Clay III, during which this clay and exposed portions of older deposits were eroded.
TABLE i
-Pleistocene Stratigraphy
Epoch
Kaye
(1961)1
Judson (1949)2
Upson & Spencer (1964)3
Upper peat
Holocene
Marine silt
Estuarine
deposits
Lower peat
Late Wisconsin
Drift IV
Lexington
Out-(Cary)
Mostly outwash
wash
Outwash
(in Boston Basin)
Lexington Drift
Mid Wisconsin
Clay III
Boston Clay
Marine clay
(Tazewell)
Early Wisconsin
Drift
III
Boston- Till
Till
(Iowan)
Illinoian
Drift II
Bedrock
Illinoian
or
Clay I
Pre Boston Till
Yarmouth
Kansan
or
Drift I
Nebraskan
Bedrock
Based on a section under Boston Commons, Massachusetts.
Based on excavations at Boston, Massachusetts.
Another glacial episode (late Wisconsin) followed this period of erosion, depositing sediments consisting primarily of outwash. This last glaciation is dated at about 10,000 years B.P. (Kaye and Barghoorn, 1964).
Since that time, relative sea level has risen and estuarine and coastal sediments have been deposited -- modern sea level reaching a near standstill about 3000 years B.P. The rise of sea level to its present position over the past 3000 years at a rate of about 1 cm/year (Emery and Uchupi, 1972) has
subjected glacial deposits to continuing marine reworking. This reworking has distributed a surface "skin" of marine sand and gravel over much of the area. Silts and clays, largely organic in composition, are now being deposited in sections of Boston Harbor.
34.
Chapter 1
IV. Bottom Sediments
a. Subsurface Geology
With the cooperation of the U.S. Geological Survey,
seismic reflection profiling operations gathered data on the
bottom morphology and shallow subbottom structure of Boston
Harbor (Figure 4). Previous seismic operations within the harbor were very limited in scope (Edgerton, 1963, 1965; Yules,
1966). Profiling surveys of western Massachusetts Bay
complement our own work and include the Massachusetts Coastal
Mineral Inventory Survey, MCMI (Willett, 1972), and the Inner
Continental Shelf Sediment and Structure study, ICONS
(Meisburger, 1976). -The paucity of deep borings in the harbor
and the complexity of the basement topography preclude the
correlation of internal reflectors. Thus,.interpretation of
the harbor's subbottom structure must be inferred from the detailed offshore seismic and coring surveys.
Relationships between bottom morphology and subsurface
structure are fairly consistent in western Massachusetts Bay
and Boston Harbor. Most topographic highs. on the seafloor are
associated with outcrops of the irregular bedrock surface or
glacial till, while topographically flat or low areas occur
a 4 22' 42020 .... .... 4244*O4 -6 0 'O2' 74*00 58' 56' 54 1
*1
C.' 70'50'Oldale, Uchupi, and Prada (1973) inferred the existence of four discontinuous sedimentary units overlying the basement complex in the western Gulf of Maine and the southeastern Massachusetts offshore area. Defined largely on the basis of
seismic reflection data, these units are: (l) coastal plain
sediments of late Cretaceous to early Pleistocene age, (2) moraine deposits of Pleistocene age, (3) glaciomarine and marine deposits of Pleistocene and Holocene age, and (4) glaciolacustrine deposits of late Pleistocene age. The
irregular acoustic basement was traced in many cases to within
short distances of the shore, where crystalline and sedimentary
rock of pre-Cretaceous age outcrop.
Two of these sedimentary units are found within western Massachusetts Bay (Oldale, Uchupi, and Prada, 1973). Unit 2, a glacial moraine, is present in only one place in the Bay, where
it forms a large submarine hill. The other unit comprises glaciomarine deposits of Pleistocene and Holocene age. This unit, which Oldale, Uchupi, and Prada (1973) called the "transparent layer", outcrops throughout Massachusetts Bay alternating with outcrops of the basement complex (Meisburger,
mu
38.
1. Acoustic Basement
An acoustic basement containing no internal reflectors is evident on our 3.5 kHz records and the low
frequency recorcds (sparker and uniboom) of the ICONS and MCMI studies. This basement underlies the transparent unit and, in places, may outcrop on the sea floor to create topographic highs. It is likely that acoustic basement is not
everywhere-coincident with the top of' pre-Cretaceous basement complex rocks, but includes overlying glacial deposits in places both in the harbor and its approaches (Meisburger, 1976).
The surface of the acoustic basement is highly irregular and complex (Figure 5). The basement topography consists
mostly of elongate lows and irregular highs. The orientation of basement features is east to east-southeast offshore and northeast in the harbor proper (Figure 6).
2. Transparent Reflection Unit
Numerous reflectors can be seen in the transparent layer, and locally, reflectors defining cut-and-fill and slump structures are present (Oldale, Uchupi, and Prada, 1973). In some places, continuous internal reflectors are absent, and the record has a mottled appearance. The mottling is inferred to represent local deposits of coarser grained material, perhaps sand and gravel (Oldale, Uchupi, and Prada, 1973). Generally, the unit has a flat upper surface, and partly or completely fills topographic lows in the basement unit.
Selected 3.5 kHz profile showing the irregular and complex surface of the acoustic basement (A). Sediment surface (S) is indicated. Vertical scale is approximately 50 m (1/16 sec);
horizontal scale 1 km.
40.
Topography of the acoustic basement (relative to mean sea level). Offshore data taken from Willett et al.' (1972). Boston Harbor data from this study.
6 0 6 05' 7100 55' 50' 45' 70*40' 4530' 6/ 45 175 45 -- 66 30 4 2 5 -04 5 25 204-0 30 45-20' -5
Meisburger (1976) divides the offshore transparent unit into upper and lower subunits separated by an irregular
reflecting surface. Meisburger (1976) suggests that this "blue reflector" is probably an erosional surface. Below this
reflector, the transparent unit is reflectively featureless or possesses weakly defined reflectors with a horizontal or gently .warped attitude. The upper transparent subunit has internal
reflectors that are generally stronger, often discontinuous, and relatively steep. Offshore both subunits occur together throughout most of the area; where only one subunit is present it is usually the lower (Meisburger, 1976).
Though outer portions of the harbor display the subbottom character discussed above (Figure 7), large areas show strong reflectors (layering) throughout most of the sediment column (Figure 8). These layers drape over the acoustic basement, thereby suggesting a quiescent current regime, while overlying these parallel reflectors are discontinuous layers showing cut-and-fill structures,
suggestive of the more vigorous current regime which exists today.
Boreholes in Boston Harbor show the upper part of the transparent layer to be Holocene silt and clay and the lower part to be glaciomarine silt and clay of late Pleistocene age (R.H. Burroughs, unpublished data); Oldale et al. (1973) inferred a similar correlation for the transparent layer
3.5 kHz profile, taken near the outer
islands, showing the acoustic character of the "transparent layer" as described
by Meisburger (1976). Sediment surface (S), acoustic basement (A), and "blue
reflector" (R) are labelled. Vertical scale is approximately 50 m (1/16 sec); horizontal scale .75 km.
44'.
W:~hc~
~
46.
Figure 8. 3.5 kHz profile taken southeasL of Long Island showing the extensive
layering characteristic of much of
the harbor. Sediment surface (S) and acoustic basement (A) are labelled. Vertical scale is approximately 50 m; horizontal scale .8 km. "Ringing" section is an acoustically turbid zone
48.
offshore. No internal reflector within the unit, suggestive of
an unconformity between the glaciomarine and Holocene marine
deposits, could be identified. This fact suggests that in most
places deposition has been continuous since the late Pleistocene.
The silt and clay represented by the transparent layer
thus appears to have a complex origin. Presumably, most of the material consisted of glacial rock flour carried by melt-water
streams and deposited in the basins. As the rising Holocene
sea submerged the area, silt and clay were winnowed from
glacial drift and carried into the basins (Oldale et al.,
1973). Finally, the uppermost silt and clay deposit probably
contains some material transported by modern streams.
b. Bottom Sediment Thickness
Analyses of the 3.5 kHz profiles (Figure 9) shows the
partial filling with sediment of the northeast trending bedrock
valleys. Sediment is thinnest over topographic.highs and
thickest in troughs, where penetration reaches 45 - 50
milliseconds two-way travel time. Assuming a velocity of 1.6
km/sec, this time corresponds to 35-40 m of sediment. This is
in good agreement with the thickness of Quaternary deposits on land (LaForge, 1932).
The isopach map highlights the historical loci of
deposition in Boston Harbor: northeastern Dorchester Bay,
Isopach map, contoured in milliseconds two-way travel time, of sediment over acoustic basement.
ISOPACH MAP OF BOSTON HARBOR
CONTOUR INTERVAL=,O4 SEC
22'o. (TWO WAY TRAVEL TIME)
0 - : .03P 42 2'O0
-j
00
--00 - -o 42044--3 - 07 0'54'0.025 60 C4' 0' 7400' 5' 5654(52i705Thompson, Spectacle, Long, and Moon Islands. Another thick wedge of sediment - not identified in our survey - lies in the Deer Island Flats at the former position of Shirley Gut (Bumpus et al., 1951). Comparing the locations of these historical depocenters with sites of modern deposition is important in assessing the modification of sedimentary patterns through time (see section on organic bottom sediments).
As stated earlier, the few deep test borings in the harbor show Holocene marine silt and clay overlying
glaciomarine silt and clay of Pleistocene age. Unfortunately, these borings are too few to map the extent of these deposits and their horizontal relationships. Several shallow borings (6-9m) in the harbor by the U.S. Army Corps of Engineers, however, do provide some information on recent sediment
relations (Bumpus et al., 1951). Soft mud areas are found in sheltered portions of the harbor such as Deer Island Flats and Quincy Bay. The greatest thickness of mud recorded is 12m in
SW Dorchester Bay (Boston Society of Civil Engineers, 1961), but normal thicknesses of this mud run from 1.5 to 6 meters. The materials beneath these soft sediments vary from gravel' to clay (Bumpus et al., 1951). Outside of these mud areas, few generalizations can be made regarding vertical sediment sequences, except that they are heterogeneous. Adjacent
borings frequently show no correlation either in sequence or in thickness of individual types.
52.
In the harbor, the most prevalent subbottom deposit is a blue-gray to slightly greenish-gray clay, which becomes
yellow-brown when oxidized.. This clay, generally called the Boston Blue Clay, may correspond to Clay III of Kaye (1961). This clay is often layered with fine sand or silt in beds.of
less than three- centimeters to more than thirty (Mencher et al., 1968). The thicker layering may give rise to the parallel reflectors seen on continuous seismic profiling records in the President Roads and other areas (see above). From Fort
Independence through President Roads to Deer Island, the Boston Blue Clay is commonly encountered at depths of 1 to 10 meters below the bottom. Overlying sediments vary greatly in
thickness and composition within short horizontal distances (Bumpus et al., 1951).
c. Texture and Composition
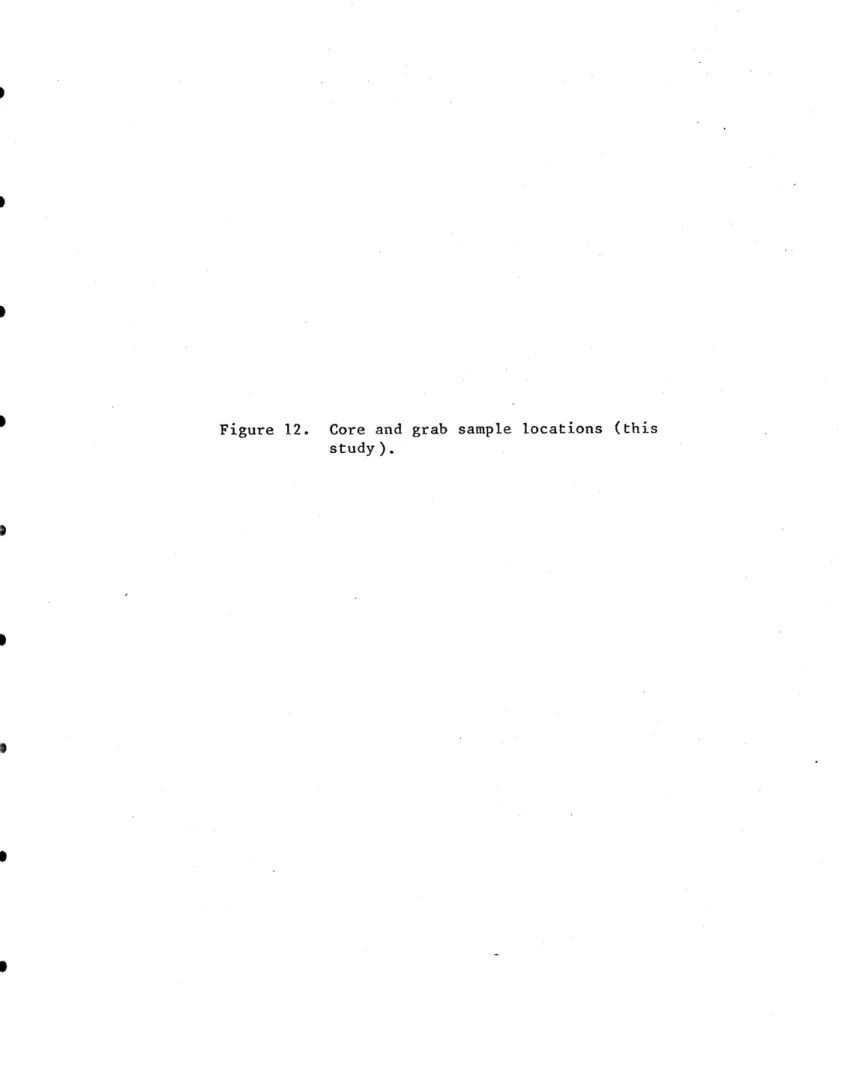
The results of several studies, including this work, are utilized to fully describe the distribution and character of bottom sediments in Boston Harbor and its approaches (Bumpus et al., 1951; Mencher et al., 1968; Hathaway, 1971; New England Aquarium, 1972; Willett et al., 1979; Meisburger, 1976). Figures 10, 11, and 12 show the distribution of samples.
Figure 10. Grab sample locations used by Mencher et al. (1968).
22' 42020 48 46 42*44'1 I 04' 0 2' 74 *00' 58' 56' 54' 52' 70*50'
Figure 11. Bottom sample locations for the MCMI and ICONS surveys (see Willett et al., 1972;
70*55' 50' 45' 56. 42*30' 25' 15' 42*40' 40'
Figure 12. Core and grab sample locations (this study).
22' 42*20' 48 46 42*4411 1 04' 02' 74*000' 58' 56' 54' .52' 70*50'
1. Size Distribution
Data from the 34 cores collected for the ICONS study (Meisburger, 1976), the 26 cores collected for the MCMI
(Willett, 1972), and the 460 grab samples collected by Bumpus et al. (1951) provide information on surficial sediments in western Massachusetts Bay. Surface sediments in the harbor approaches are heterogeneous in character (Figure 13). In the region east and southeast of Boston Harbor, surface sediments are characterized by coarse gravels, while fine sands dominate northeast of the harbor. Coarse, gravelly sediments - similar to those found in the shipping channels - are interpreted as reworked glacial drift; the fine sand ascribed to modern progradation of sand from the shore and littoral zone (Meisburger, 1976).
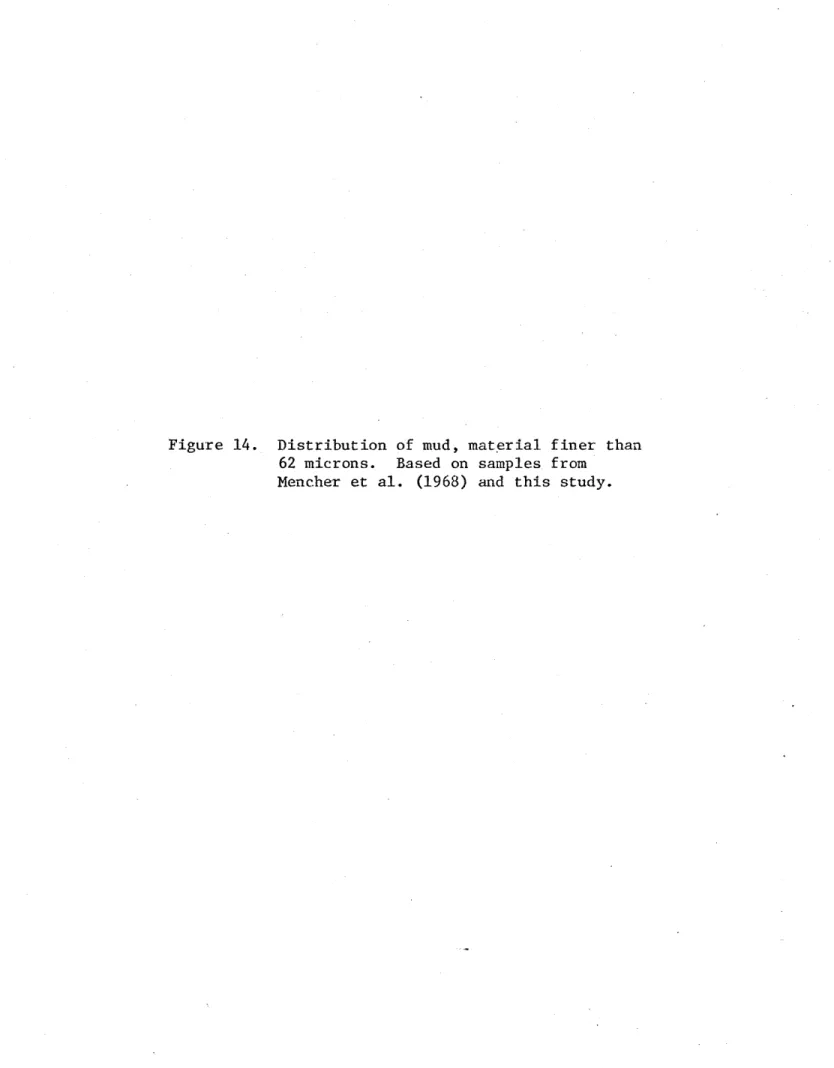
Based on the 152 grab samples taken by Mencher et al.
(1968) and the 27 samples taken during this study, muds (silt
plus clay) within the harbor are concentrated in areas where dredging has not taken place and where tidal velocities are a minimum (Figure 14). Sands and gravels and mixtures of the two are found in the shipping channels and near the harbor islands (ridge crests). The major depocenters of mud correspond to the historical loci identified in the previous section. The muds
60.
Figure 13. Surficial sediments of Massachusetts Bay (from Willett et al., 1972).
70*55' 50' 45' 42*30' 25' 20 15' 42*40' 40'
62.
Figure 14. Distribution of mud, material finer than 62 microns. Based on samples from
02' 74*00' 58' 56' 54 52' 22' 42020' 48' 46'1 42*44'
L
04' 70*50'64.
harbor, where the mud content exceeds 50 percent, the ratio of clay to mud is generally less than 0.40, indicating that these muddy sediments are dominated by silt-size material. In
contrast, sands and gravels in the harbor (and its approaches) usually contain less than 5 percent clay and slightly less silt
(ratio of clay to mud is greater than 0.50).
2. Bottom Sediment Composition
a. Inorganic Sedimentary Components
The greater than 62 micron fraction of harbor sediments is fairly uniform. Constituents incude: 1) angular to
rounded, vitreous quartz (80-90%) with minor amounts of frosted quartz; 2) angular, glossy unburnt coal and black (burnt) wood shards (5-10%), most abundant near the navigation channels; 3) muscovite, feldspar, heavy minerals (15%); and 4) rounded rock
fragments (<5%). Some samples contain iron-stained quartz grains. In the harbor approaches, the dominant mineral constituent of the greater than 62 micron fraction is quartz. Rock fragments are common in coarser sands. Biogenic content is minor, consisting primarily of agglutinated foraminifera. Mica is generally present, but at low percentages.
Microscopic examination and x-ray diffraction studies of the
2-62 micron fraction (silt) show that harbor samples are dominated
present in minor amounts. X-ray diffraction studies on
oriented samples and powder mounts do show the presence of 0
feldspar, 10 A mica, illite, and chlorite. Offshore samples display a similar composition.
The mineralogy of the less than 2 micron fraction is
dominated by illite. Chlorite and feldspar are secondary constituents, while quartz and kaolinite occur in trace amounts.
b. Calcium Carbonate
Both shelled and nonshelled organisms abound in the black muds and in the waters just above. Mussels are common, and shell fragments are frequent constituents of the
mud. Other than these mussel banks, however, most sediments in
the harbor contain less than 1.0 percent calcium carbonate and
many contain less than 0.5 percent. The bulk of this carbonate
consis-ts of the remains of mollusks with subordinate amounts of
benthonic foraminifera, echinoids, and barnacles. Molluscan
shells dominated by the blue mussel Mytilus edulis (Linne), are most common in the fine muddy sediments of Dorchester and
Quincy Bays.
Analyses of the samples from the harbor approaches by
Willett et al. (1972), Meisburger (1976), and Hathaway (1971)
66.
bottom sediments. Mollusk shells, where found, are usually fragmented; the majority are derived from the mussel, Mytilus edulis, and the quahog, Mercenaria mercenaria.
c. Organics
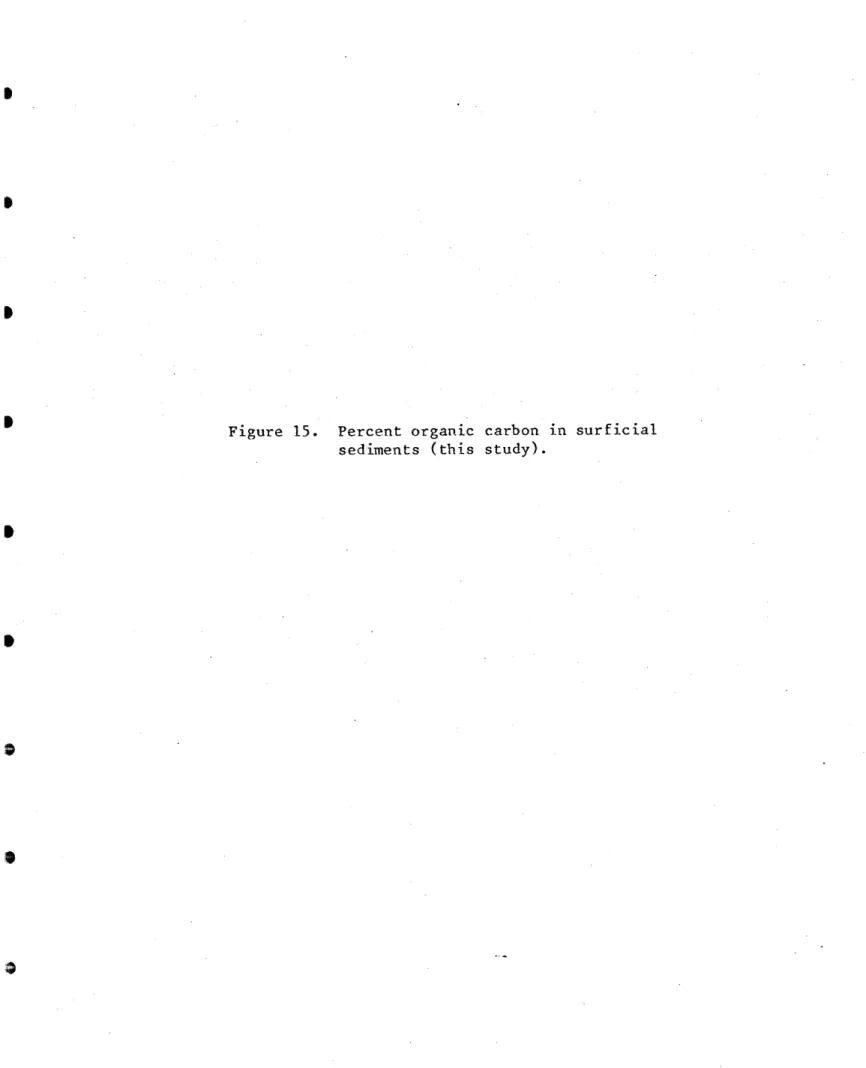
Organic carbon is most abundant in the
fine-grained sediments of northern Quincy Bay and between the harbor islands (compare Figures 14, 15, and 16). In these areas, organic carbon in the surface sediments measures 4-5% by weight (LECO Analyzer). Away from these areas, most samples contain between 1.0 and 2.0 percent organic carbon, which are levels typical of estuaries along the eastern seaboard (Folger,
1972). Mencher et al. (1968) reported organic carbon values in
excess of 15%, but these values appear at least three times greater than the ones reported here. Because of the
wide-spread confidence in LECO methods and the errors possible in the "spectrographic" procedure employed by Mencher et al., it is assumed that the latter values are in error.
In the sandy and gravelly sediments of the harbor approaches and near the outer islands, organic carbon content is generally below 0.5 percent. Conover (1951) reported that the total organic matter content of the bottom sediments of Massachusetts Bay and the harbor approaches were generally below 2%, though some samples contained values in excess of
10%. (For comparison, Conover (1951) calculated a mean of
Figure 15. Percent organic carbon in surficial sediments (this study).
0
0
ORGANIC
22' 42*20' 48' 46 42*44' 04' 02'CARBON CONTENT (%)
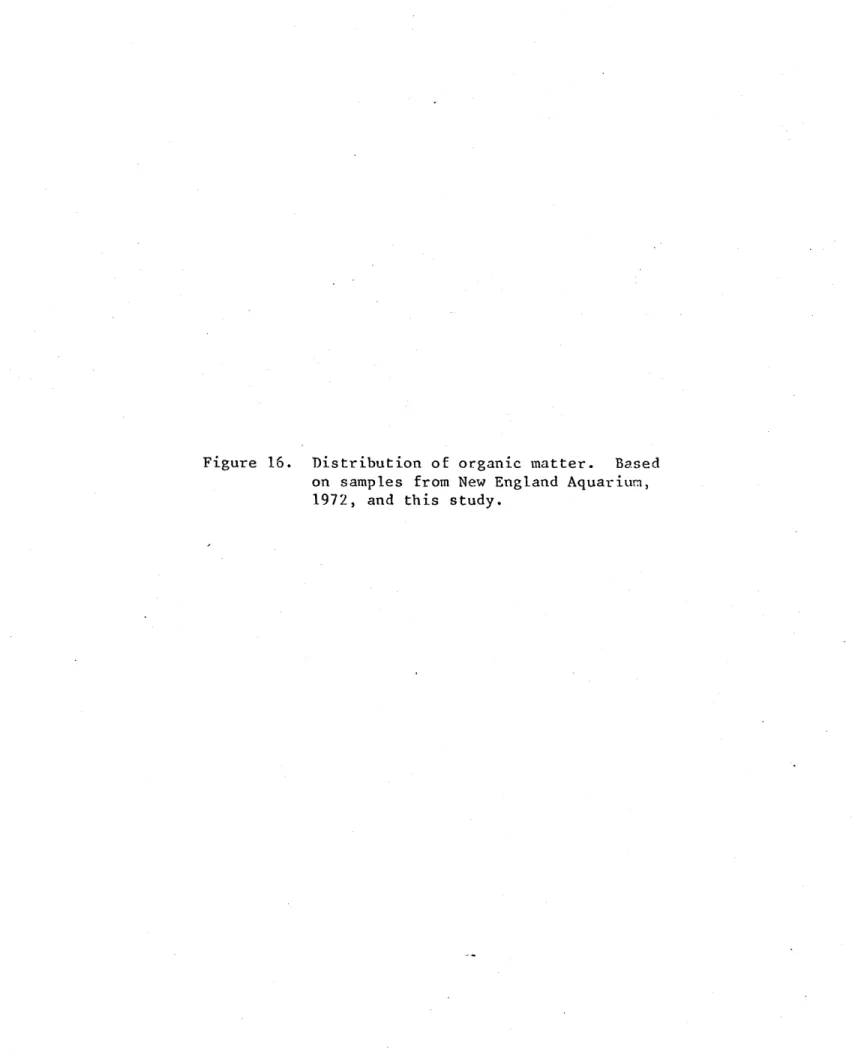
74 000' 58' 56' 54' 0 52' 70*50'Figure 16. Distribution of organic matter. Based on samples from New England Aquarium, 1972, and this study.
) 0 OD Nl NV 70. O -o 0 0 N 0
~0
0 -0Organic carbon and clay show a direct relation (Figure
17). However, high-carbon values do not merely reflect areas
of fine grain size. In some samples (e.g. G25. and G26) very small clay contents are matched with dramatic concentrations of organic carbon. Analyses of the organic carbon content of the clay fraction for grab samples G2, G3, G5, G9, and G25 (Figure
10) show that the clay-size organic particles constitute under
20% of the total organic carbon content (Table 2), suggesting that silt and.sand-size organic particles are also important. In fact, examination of the sand-size material in G25 shows that most grains are coated with an organic film.
Conover (1951) reported that the organic matter
deposited in the sediments of the harbor approaches was derived largely from marine sources, the most important of which were phytoplankton.. Conover (1951) did note, however, that some
surface samples showed evidence of pollution from sewage, the highest values for organic matter content occurring near the North Channel and the Deer Island sewage outlet. Mencher et al. (1968) also concluded that a great.part of the organic material in Boston Harbor proper was derived from.sewage.
The composition of the organic material in grab samples
G5, G12, G14, G15 was examined by Chevron Oil Company using
microscopic organic analyses (Table 3). All four samples
72.
Figure 17. Percent organic carbon versus percent clay in grab samples from Boston Harbor and its approaches. Triangles represent
offshore samples taken by Hathaway (1971).
MASS, BAY & HARBOR
HARBOR PROPER
APPROACHES
0.10
20
30
40
% CLAY
5r
(4%)L-0
50
74.
TABLE 2
Size partitioning of the organic carbon
BULK ORGANIC CARBON CONTENT (%) 2.64 2.26 3.65 2.29 0.81
PERCENTAGE OF TOTAL CARBON SAND 27.7 46.9 43.2 53.6 79.8 SILT 62.6 35.7 49.3 36.1 12.0 CLAY 9.7 17.4 7.5 10.2 8.3 TABLE 3
Organic analysis of selected grab samples
Wt.% Wt.% Wt.%
SAMPLE CaCO3 BFOC TOC H/C
OIL-P Wt.%
OM
(%)
BIT BIT/BFOC TAI.23 4.02 4.48 1 75
.41 2.00 2.08 0.6 50
.11 4.34 4.91 1 80
.35 3.67 4.06 1 80
- Bitumen-Free Organic Carbon
- Total Organic Carbon .
OM - Oil-Prone Organic Matter
- Bitumen
- Thermal Alteration Index SAMPLE G2 G3 G5 G9 G25 G5 G12 G14 G15 BFOC TOC OIL-P BIT TAI .45 .08 .57 .39 .12 .04 .13 .11 1-1.5 1-1.5 1-1.5 1-1.5
material which tends to bind particles together. The greater than 10 micron fraction of the organic matter has a heavy terrestrial influence which includes pollen, spores, humic and cuticular material. Amorphous algal material and occasional foraminifera linings are also in the greater than.10 micron fraction. The less than 10 micron fraction is predominately amorphous in all four samples. Much of this amorphous material is believed to be related to larger humic particles. Sample
G12 is somewhat anomalous in that it contains significantly
more pyrite than the others and appears more biodegraded. All samples possess numerous diatom and silicoflagellate fragments.
In general, the.organically enriched muds of the harbor have C/N ratios of less than 4.0, while the sandy sediments of
the topographic highs and navigation channels have C/N ratios in excess of 5.0 (Figure 18). These low values of C/N may be explained by the large nitrogenous input from sewage discharge and the severe fractionation of the sewage-derived organics (R. Vaccaro, personal communication). Yet, curiously, these C/N values do not reflec-t terrestrial origin. Differences between our C/N values and those calculated by others for the area (Hathaway, 1971; Stewart, 1968) are probably due to differences in nitrogen determination--i.e., Kjeldahl versus LECO.
76.
Figure 18. Ratio of carbon to total nitrogen in grab samples (this study).
22' 5,1 6:4 46'A 4:4 42020*5:4 14:4 - -4:5 4:4 9:4 -
T
.4:4 -4:4 484 4::1-4 34 '-IV 4:5e 464 - e4 42*44' C4'4 0 2' 74*000' 58' 56. 54' 52' 70-50'78.
Pockets of organic-rich sediment are often acoustically
inpenetrable to the energy from high-resolution, continuous
seismic profilers. The cause of these acoustically turbid zones is ascribed to interstitial gas bubbles of methane and H2S produced by the biochemical degradation of organic matter
(Schubel and Schiemer, 1972). During our seismic survey of Boston Harbor, several such acoustically turbid zones were
identified (Figures 19 and 20). For the most part, these zones are coincident with sediments of high organic content (compare Figures 16 and 20). While coring in these sediments, bubbles with a strong odor of H 2S evolved from the sediments.
Acoustically turbid zones not associated with present areas of high organic content (i.e. those in Hingham Bay and the zone off Pt. Alerton) may represent areas where gas production
occurs at some depth in the sediments. The acoustic records in these areas showed that the reflective surface was at a shallow depth below the sediment/water interface.
Figure 19. Acoustically turbid zone (location shown in Figure 20). Sediment surface (S) and acoustic basement (A) indicated for
reference. Vertical scale is
approximately 50 m (1/16 sec); horizontal scale is 1.5 km.
80.
7
C
Oat:
Figure 20. Distribution of acoustically turbid zones in Boston Harbor (indicated by*). Heavy line A-A' indicates location of profile shown in Figure 19.
0
0
DISTRIBUTION
OF ACOUSTICALLY TURBJ'D ZONES
22' 42020' 48 '6 42*44' -04' 70*50'