HAL Id: hal-00296163
https://hal.archives-ouvertes.fr/hal-00296163
Submitted on 26 Feb 2007
HAL is a multi-disciplinary open access
archive for the deposit and dissemination of
sci-entific research documents, whether they are
pub-lished or not. The documents may come from
teaching and research institutions in France or
abroad, or from public or private research centers.
L’archive ouverte pluridisciplinaire HAL, est
destinée au dépôt et à la diffusion de documents
scientifiques de niveau recherche, publiés ou non,
émanant des établissements d’enseignement et de
recherche français ou étrangers, des laboratoires
publics ou privés.
Annual variation of strato-mesospheric carbon monoxide
measured by ground-based Fourier transform infrared
spectrometry
V. Velazco, S. W. Wood, M. Sinnhuber, I. Kramer, N. B. Jones, Y. Kasai, J.
Notholt, T. Warneke, T. Blumenstock, F. Hase, et al.
To cite this version:
V. Velazco, S. W. Wood, M. Sinnhuber, I. Kramer, N. B. Jones, et al.. Annual variation of
strato-mesospheric carbon monoxide measured by ground-based Fourier transform infrared spectrometry.
Atmospheric Chemistry and Physics, European Geosciences Union, 2007, 7 (5), pp.1305-1312.
�hal-00296163�
www.atmos-chem-phys.net/7/1305/2007/ © Author(s) 2007. This work is licensed under a Creative Commons License.
Chemistry
and Physics
Annual variation of strato-mesospheric carbon monoxide measured
by ground-based Fourier transform infrared spectrometry
V. Velazco1, S. W. Wood2, M. Sinnhuber1, I. Kramer3, N. B. Jones4, Y. Kasai5, J. Notholt1, T. Warneke1, T. Blumenstock3, F. Hase3, F. J. Murcray6, and O. Schrems7
1Institute of Environmental Physics University of Bremen, Bremen, Germany 2National Institute of Water and Atmospheric Research Ltd, Lauder New Zealand
3Institute of Meteorology and Climate Research, Forschungszentrum Karlsruhe and Univ. Karlsruhe, Karlsruhe, Germany 4Department of Chemistry University of Wollongong, Wollongong, Australia
5Global Environment Division National Institute of Information and Communications Technology (NICT), Tokyo, Japan 6Department of Physics and Astronomy, University of Denver, Denver, Colorado, USA
7Alfred Wegener Institute for Polar and Marine Research, Bremerhaven, Germany
Received: 5 May 2006 – Published in Atmos. Chem. Phys. Discuss.: 28 July 2006
Revised: 13 December 2006 – Accepted: 20 February 2007 – Published: 26 February 2007
Abstract. We present long-term time-series of strato-mesospheric CO vertical columns measured from stations lo-cated in Antarctica, mid-latitudes and the Arctic, covering the period from 1997–2005. The instrument and the mea-surement technique allows the separation of tropospheric and strato-mesospheric contributions to the CO column, there-fore providing information on the chemistry and dynamics both at low and high altitudes. Data from polar stations show a similar annual variability of strato-mesospheric CO with a strong maximum in late winter and spring. A small en-hancement in late summer for some stations, which we call the “summer bulge”, can be seen occasionally. Generally, the mid-latitude stations show no significant annual variability of strato-mesospheric CO columns. Measurements were com-pared with a two-dimensional chemistry-transport model of the middle atmosphere. The annual and latitudinal variations of CO are reproduced well by a model run including ther-mospheric CO. Comparison with two model scenarios show that the polar winter maximum is due solely to downward transport of thermospheric CO, while CHOxchemistry in the
stratosphere could probably contribute to the summer maxi-mum.
1 Introduction
The high latitude regions have a larger seasonal variation in atmospheric properties than anywhere else on earth (Notholt
Correspondence to: V. Velazco
et al., 1997). To study this variation, we use carbon monox-ide (CO), which is an excellent tracer for global transport and air mass descent rates in the polar stratosphere and lower mesosphere. Its importance as an indicator of vertical transport in the mesosphere was highlighted in results from ground-based measurements e.g. K¨unzi and Carlson (1982). At altitudes of about 50 km, the photochemical lifetime of CO is about 7 days, which is comparable to the vertical and horizontal advection time scales at these altitudes (Dupuy et al., 2004; Solomon et al., 1985).
The primary source of carbon monoxide in the upper mesosphere and lower thermosphere is the photolysis of car-bon dioxide. In the stratosphere, CO is produced through the oxidation of atmospheric methane, but OH rapidly destroys it through oxidation. This reaction acts as the main sink of CO. This process does not take place during the polar night, since OH is produced by reactions involving photolysis, e.g. of H2O, and since the concentration of OH diminishes rapidly
during polar night. Carbon monoxide follows the meridional circulation towards the winter hemisphere polar night region. The consecutive downward motion induces a sharp gradient in the CO concentrations down to the stratosphere (Solomon, et al., 1985). In summer, uplifting of air masses with low CO content takes place. Solomon et al. (1985) predicted that very large abundances should accumulate in the polar night meso-sphere because of the absence of photochemical destruction processes.
Previous ground-based measurements of mesospheric CO were shown in pioneering works such as that of K¨unzi and Carlson (1982); Clancy et al. (1982); Zander et al. (1981); Farmer et al. (1980); Goldsmith et al. (1979); etc. However,
1306 V. Velazco et al.: Strato-mesosphere CO measurements by ground-based FTIR there is a lack of long term ground-based observations of
strato-mesospheric CO in the literature. Recently, satellites have been able to measure high-altitude CO (e.g. Lopez-Valverde et al., 1993; Dupuy et al., 2004; Clerbaux et al., 2005). But until now, the longest reported time series of CO in the upper atmosphere was done by Forkmann et al. (2003) over the Onsala Space laboratory, Sweden (57.4◦N, 12◦E). The time series spanned from September 2000 to September 2002.
Strato-mesospheric CO has been measured for the first time using ground based FTIR spectrometry by Kasai et al. (2005). However, measurements for only 2 years were presented. This study supports the work of Kasai et al. (2005) but we present longer time series measurements from the northern and southern polar regions and the mid-latitudes. This allows us to have a better idea of the seasonal varia-tion of strato-mesospheric CO and confirm that the current ground-based FTIR instruments and retrieval procedures are able to exploit the information on strato-mesospheric CO from existing spectra. Furthermore, current measurements provide very little evidence on the reversal of the accumula-tion of CO in the mesosphere brought about by the merid-ional circulation. By showing measurements from both the northern and southern hemispheres, we verified this reversal. 1.1 Instruments
Ground- based measurements of solar absorption spectra were taken from three Arctic stations (Ny Alesund 79◦N, Kiruna 68◦N and Poker Flat 65◦N), one Antarctic station (Arrival Heights 78◦S) and two mid-latitude stations (Bre-men, Germany 53◦N and Lauder, New Zealand 45◦S). All stations are equipped with Bruker 120 HR Fourier transform spectrometers except for Arrival Heights (Bruker 120 M) and Bremen (Bruker 125 HR from June 2004). Automatic so-lar trackers allow for the continuous measurements of direct sunlight from the ground. For the polar stations, measure-ments are limited by the polar night. Solar spectra in Ny Alesund can be recorded between March and early October. In Kiruna, the polar night is between early December and mid January. At the Arrival Heights station in Antarctica, the polar night is between late April and mid August. Measure-ments in Poker Flat are possible between early February and mid October.
1.2 Retrieval of strato-mesospheric CO
It is possible to derive vertical profiles of CO with a max-imum resolution of about 4 km up to approximately 16 to 20 km (Velazco et al., 2005). Above 20 km, the vertical res-olution becomes very coarse that useful information cannot be derived, i.e. the individual layers of the stratosphere and mesosphere cannot be separated. This is due to the limited information content arising from the nature of the retrieval method. However, information can still be gained by
con-sidering these inseparable layers of the atmosphere as one partial column layer, and retrieving the CO concentration in this layer.
Partial columns of CO were retrieved from the absorption lines in two steps. First, volume mixing ratio (VMR) profiles from the surface up to about 100 km were retrieved. The pro-files were then converted into number densities using height-temperature-pressure profiles and integrated to yield partial columns. The pressure and temperature profiles necessary for the forward model were obtained from balloon sondes that were launched daily from the stations. Above the al-titude limits of the sondes (approximately 30 km), standard pressure and temperature profiles were taken. In Kiruna, pressure and temperature profiles were taken form NCEP (Kanamitsu, 1989).
The program used for the retrieval of CO VMR profiles for Ny Alesund, Poker Flat, Bremen, Lauder and Arrival Heights is SFIT-2 version 3.8 (Spectral Least Squares Fitting Program) developed at NASA Langley Research Center and the National Institute for Water and Atmospheric Research in New Zealand. For further descriptions see e.g. Rinsland et al. (1998). The main element of the software is the forward model that creates a synthetic spectrum from a simulated at-mosphere, which is divided into 29 layers (45 for Kiruna). It then fits the measured spectrum and the synthetic spectrum using the optimal estimation method (Rodgers, 2000).
The program used to retrieve the Kiruna data is PROFFIT 9 developed by Hase (2002). The code is capable of handling general covariance matrices. For the efficient construction of simplified empirical covariances, the formalism described by Tikhonov and Philips is used (Hase et al., 2004). An inter-comparison between SFIT2 and PROFFIT has shown excel-lent agreement of profiles and total column amounts. The averaging kernels are consistent and the results are compati-ble for independently chosen constraints (Hase et al., 2004). CO spectra were analyzed in the CO micro-windows based on the previous work of Rinsland et al. (1998). For this study, the micro-windows used are 2057.70–2057.91 cm−1, 2069.55–2069.72 cm−1, and 2157.40–2159.20 cm−1. An ad-ditional window, 2140.4–2141.40 cm−1, and a broader re-gion in one of the standard micro-windows, i.e. 2153.2– 2160.0 cm−1were used for the Kiruna retrievals. For all sta-tions, the HITRAN2k line list plus updates to 2001 (Roth-man et al., 2003) was used. Typical averaging kernels for the retrievals in Ny Alesund and Poker Flat are shown in Fig. 1. The figure shows that the 2 partial columns from 0.2–18 km and from 18 km to 85 km can be separated. An example from Ny Alesund shows that the kernel for the 18 km to 85 km is not perfect, i.e. it does not have a max-imum of 1.0. Furthermore, the stratospheric columns and the mesospheric columns are not separable, thus we provide the measurements as strato-mesospheric columns. The ker-nels calculated for Poker Flat are closer to unity compared to the ones for Ny Alesund. The factors that contribute most to the shape of the averaging kernels are; the optical path
difference, the solar zenith angle, the a-priori covariance ma-trix, the a-priori profile and the signal to noise ratio. The kernels for Poker Flat were calculated with a slightly lower a-priori constraint above 18 km (a-priori uncertainty corre-sponding to 55%, compared to 20% for Ny Alesund) and a conservative estimate of 100 for the signal to noise ratio (Ka-sai et al., 2005).
For the strato-mesospheric CO partial columns above 24 km Kasai et al. (2005) reported an error of 15%. This error consists of random error terms including: measurement error of 5.2%, smoothing error of 8.2% and temperature er-ror of 1%. The forward model erer-ror of 5% was been treated as a systematic error. In comparison, the total column error was reported to be less than 5%. For this study, we estimate the partial column (18 km – top of atmosphere) errors to be between 8.3% and 9.3%.
1.3 The chemical transport model
The model used is a global two-dimensional photolysis, chemistry and transport model of the stratosphere and meso-sphere. It is a coupled chemistry-dynamics model which combines the THIN AIR meteorological code (Kinners-ley, 1996) and the SLIMCAT chemistry code (Chipperfield, 1999). Temperature, pressure and wind fields are calculated by the THIN AIR code on isentropic surfaces from the bot-tom up to ∼100 km with a vertical spacing of about 3 km.
The model has a horizontal resolution of about 9.5◦ ex-tending from pole to pole in 19 evenly spaced latitude bins. The chemistry module uses JPL-2003 photochemistry data (Sander et al., 2003). Though the SLIMCAT model is not appropriate for the troposphere, it is applied to the entire vertical range of the model. Heating rates are calculated in the THIN AIR module, using O3, NO2and CH4values
pro-vided by the chemistry module. CO2is also used to
calcu-late heating rates, however, as this is very long-lived in the stratosphere and mesosphere, it is not accounted for in the chemistry code. In the past, the model has been used for a number of studies concerning the composition of the middle atmosphere (Sinnhuber et al., 2003; Chipperfield and Feng, 2003). Tropospheric sources of chlorine, bromine and fluo-rine compounds as well as greenhouse gases like CH4, N2O
and CO2are based on the WMO A1 scenario (WMO, 2002,
2003).
Model runs started from 1988, and run to 2005. For this study, two model runs were carried out. The “base” scenario uses the original SLIMCAT chemistry which does not con-tain CO2. This means that CO is produced solely from CH4
oxidation. In a second model run, called “thermospheric”, CO in the uppermost model box is fixed to the CO2value.
This means that CO2is transported unchanged into the
ther-mosphere, where it is transferred into CO immediately. CO will then be transported down into the mesosphere and strato-sphere during polar winter; after polar sunrise, CO will react with OH, re-forming CO2in a couple of days.
0 1 2 x 10⁻⁷ 0 10 20 30 40 VMR 0 1 2 x 10⁻⁶ 50 60 70 80 90 CO a−priori VMR profile Ny Alesund Poker Flat −0.20 0 0.2 0.4 0.6 0.8 1 10 20 30 40 50 60 70 80 90 Averaging Kernels Altitude (km) GND−18 km Ny Alesund 18km−TOA Ny Alesund GND−18 km Poker Flat 18km−TOA Poker Flat
Fig. 1. (Left) Typical averaging kernels for the retrieval of CO for Ny Alesund (solid curves) and Poker Flat (dashed curves). The ker-nels from 18 km to the top most layer of the retrieval are shown by the blue curves. The green curves are the averaging kernels for the retrieval of the CO column from the ground to 18 km. (Calcu-lated for Ny Alesund for solar zenith angle (SZA) of 58◦, optical path difference (OPD) of 180 cm and a signal to noise ratio (SNR) of 200. Poker Flat SZA=63.61◦, OPD=257.143 cm and SNR=100). (Right) Typical CO a-priori VMR profiles used for the retrieval for Ny Alesund (magenta) and Poker Flat (black dashed line).
2 Results
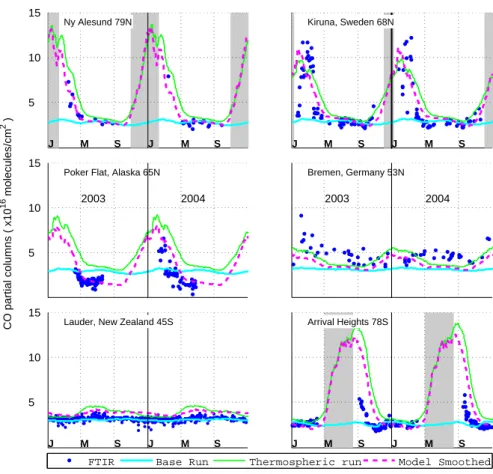
A comparison of the partial column densities measured by the FTIRs in molecules/cm2from 18 km to the top of the at-mosphere and the model results are shown in Fig. 2 for the period of 2003–2004. The partial column densities measured by the FTIRs are shown by the blue dots. The cyan curve rep-resents the base run from the model, where thermospheric CO is neglected. Clearly, this run alone cannot reproduce the measurements. The green curve represents the complete run with the thermospheric CO. The model run smoothed by the typical averaging kernels of the FTIR is represented by magenta curve. The smoothing was done according to the formalism described in Rodgers and Connor (2003) and shown in Velazco et al. (2005) for FTIR, model and satel-lite data comparison of CO profiles. The smoothed curves represent what the FTIR should “see” if the model were to represent the true CO. FTIR measurements and smoothed model results compare well in the northern hemisphere polar stations. For the Arrival Heights station, the annual varia-tion of CO is captured by the model qualitatively, however, actual values of the winter maxima are significantly higher in the model results. This might be a result of a wrong es-timation of the downward transport in the model. In the mid-latitudes, the model predicts a slight enhancement of the strato-mesospheric CO columns during winter times over
1308 V. Velazco et al.: Strato-mesosphere CO measurements by ground-based FTIR J M S J M S Ny Alesund 79N 5 10 15 J M S J M S Kiruna, Sweden 68N CO partial columns ( x10 16 molecules/cm 2 )
Poker Flat, Alaska 65N
2003 2004 5 10 15 Bremen, Germany 53N 2003 2004 J M S J M S
Lauder, New Zealand 45S
5 10 15
J M S J M S
Arrival Heights 78S
FTIR Base Run Thermospheric run Model Smoothed
Fig. 2. A comparison of the partial column densities measured by the FTIRs in molecules/cm2from 18 km to the top of the atmosphere
and the model results for the period of 2003—2004. Cyan line: base model run without thermospheric CO. Green line: Model run with thermospheric CO. Blue dots: Retrieved columns from the FTIR. Magenta line (dashed): model run smoothed with the averaging kernels of the FTIR according to Rogers and Connor (2003). The shaded area approximately represents polar night at the sites.
Bremen. The model predicts this enhancement to be less pro-nounced over Lauder.
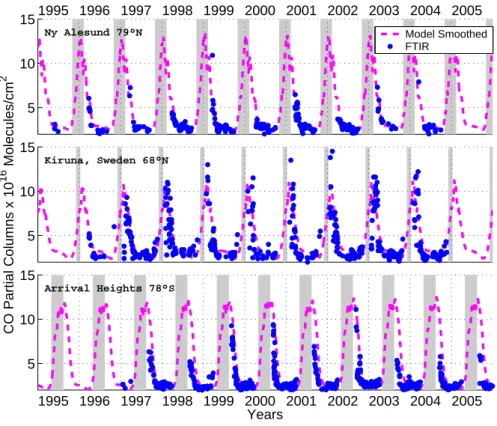
Long-term time series of CO partial column densities from 18 km to the top of the atmosphere measured from FTIR (blue dots) and compared with the model (magenta dashes) are shown in Fig. 3. The measurements were taken from the three polar stations (Ny Alesund and Kiruna from the Arctic and Arrival Heights in Antarctica). The gray shaded areas represent the polar night where solar absorption mea-surements are not possible. Unlike the seasonal cycles of CO in the troposphere, the seasonal cycles in the strato-mesosphere show very steep gradients, with maximum val-ues occurring in January in the Arctic and in June–July in the Antarctic. As shown by the model (and partially by the measurements), the CO column above 18 km increases from about 4.0×10¹⁶molecules/cm2 in summer to about 14×1016molecules/cm2in winter (an increase of about 3.5 times). This rapid increase is followed by a rapid decrease as soon as the sun re-appears in spring. Kasai et al. (2005) reported the partial CO columns above 24 km to be ap-proximately 4.8±0.55×10¹⁶molecules/cm2 from February
to April. This report is consistent with the values shown here. The seasonal variation of the strato-mesospheric CO, with maximum values occurring during winter and minimum val-ues in summer is also consistent with the measurements of Forkmann et al. (2003).
Correlation plots and correlation coefficients (R) between the FTIR and model are shown in Fig. 4. Although the corre-lations of FTIR and model are quite good for high latitudes, where the strato-mesospheric CO is mainly controlled by downward transport from the thermosphere, the correlation for Kiruna is slightly worse. For Kiruna, horizontal transport and the shearing of the polar vortex possibly play a role as well. Note also that Kiruna is often at the edge of the po-lar vortex. These factors are not well taken into account in the model. We can tell this by the high strato-mesospheric CO values measured by the FTIR in contrast to the low val-ues from the model. The correlation plot for Arrival Heights might be better described by a logarithmic fit instead of a lin-ear fit. This seemingly logarithmic distribution may be due to the assumptions of 1) converting all the thermospheric CO2
into CO and 2) not using a real and smooth CO2profile in the
5 10 15 Ny Alesund 79°N 1995 1996 1997 1998 1999 2000 2001 2002 2003 2004 2005 Model Smoothed FTIR 5 10 15 CO Partial Columns x 10 16 Molecules/cm 2 Kiruna, Sweden 68°N 5 10 15 Arrival Heights 78°S 1995 1996 1997 1998 1999 2000 2001 2002 2003 2004 2005 Years
Fig. 3. Long-term FTIR measurements from the three polar stations; Ny Alesund and Kiruna from the Arctic and Arrival Heights in Antarctica (blue dots) compared to the smoothed model data (dashed magenta curves). The measurements and model data are in partial column densities from 18 km to the top of the atmosphere.
thermosphere. These lead to too much CO descending from the thermosphere during late fall, then levelling off in winter. Compared to the high latitudes, the correlation coefficients are not so good in mid-latitudes where downward transport of thermospheric CO is not the most significant contributing factor.
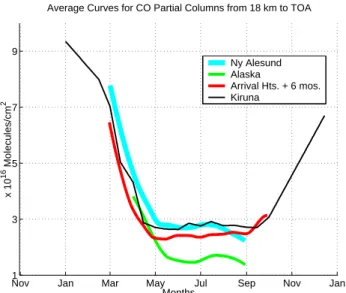
A small enhancement of CO columns can be observed in late summer from the measurements at the high-latitude sta-tions. This could be seen as a small “bulge” from the aver-age curves from Ny Alesund and Poker Flat in Fig. 5. The average curves were calculated from the whole time series of each station. Values over 15 days were averaged to yield one data point in the curve. The Kiruna and Arrival Heights data exhibit this “summer bulge” for some years (e.g. 1998, 2002 and 2004 in Arrival Heights) but it tends to be smoothed out from the averaging, probably due to the high frequency of varying data points. This summer maximum is very slightly seen in the model, it is much clearer in the “base” model run. In the thermospheric model run, it is superimposed by the much sharper signal of mesospheric CO. This summer max-imum in the model is produced by methane oxidation in the stratosphere, which occurs faster in summer. CO is an in-termediate product of methane, it is then slowly transformed into CO2. We speculate that transport processes of CH4are
the major factors that determine the prominence of the
sum-mer bulge. However, we could not totally exclude the pos-sibility that the sensitivity of the retrieval methods also play a role here. The average curves also indicate that, the partial column amounts above 18 km in spring in the Arctic (79◦N) are generally slightly higher than in the Antarctic (78◦S). Al-though the data points for the spring months are quite scarce, we speculate for now that this could be due to the subsidence being stronger above Ny Alesund around spring.
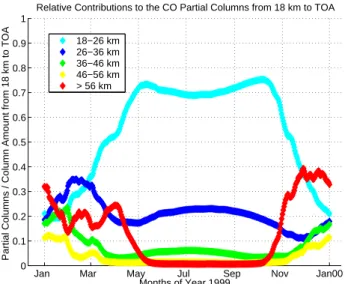
Estimates from the model for the strato-mesospheric CO above Ny Alesund indicates that, generally about 20%–80% of the column above 18 km comes from the stratosphere (18–26 km), shown on Fig. 6. This estimate is based on the model data for Ny Alesund for one year. In winter, a sig-nificant portion of the column comes from above 56 km, i.e., the mesosphere and lower thermosphere. The summer max-imum originates in the layer between 18–26 km. It cannot be seen above 56 km. This could be a strong indication that the “summer bulge” detected by the FTIR originates from the stratosphere
The steep gradients of strato-mesospheric CO seen in the polar regions are not evident in the FTIR data over Lauder (45◦S). shown in Fig. 7. Although there is a strong variabil-ity in the columns below 18 km mostly due to biomass burn-ing (Jones et al., 2001), the strato-mesospheric columns show almost no variability. This dataset confirms that the columns
1310 V. Velazco et al.: Strato-mesosphere CO measurements by ground-based FTIR 0 2 4 6 8 10 12 0 5 10 Ny Alesund 79°N R= 0.831 0 2 4 6 8 10 12 0 5 10 Kiruna, Sweden 68°N R= 0.744 0 2 4 6 8 10 12 0 5 10 Model ( x 10 16 Molecules/cm 2 )
Poker Flat, Alaska 65°N R= 0.804 0 2 4 6 8 10 12 0 5 10 Bremen, Germany 53°N R= 0.401 0 2 4 6 8 10 12 0 5 10 FTIR ( x 1016 Molecules/cm2)
Lauder, New Zealand 45°S R= 0.182 0 2 4 6 8 10 12 0 5 10 FTIR ( x 1016 Molecules/cm2) Arrival Heights 78°S R= 0.801 CO Partial Columns (Model vs. FTIR)
Fig. 4. Correlation plots (model output vs. FTIR data) and the correlation coefficients (R). The whole time series of the FTIR data from each station and the corresponding model output are plotted and calculated for this figure. The red lines represent least squares fits to the points. The black dashed lines represent correlation coefficients of 1.0.
Nov Jan Mar May Jul Sep Nov Jan
1 3 5 7 9 Months x 10 16 Molecules/cm 2
Average Curves for CO Partial Columns from 18 km to TOA
Ny Alesund Alaska
Arrival Hts. + 6 mos. Kiruna
Fig. 5. Average curves calculated from the time series of the 4 Polar stations: Ny Alesund, Poker Flat, Kiruna and Arrival Heights. The summer bulge in July-August can be distinguished from the Poker Flat and Ny Alesund data. The Arrival heights data (shifted by six months) only shows small “lumps” in June and August. The vari-ability in the data in Arrival heights averages out the summer bulge. The average curves were calculated from the whole time series of each station. Values over 15 days were averaged to yield one bin in the curve.
below 18 km have very little or no influence on the columns above 18 km and that the retrieval could clearly separate both columns, as indicated by the averaging kernels. The only ex-ceptions to the monotonous strato-mesospheric CO trends in the mid-latitudes are the values measured in the winters of 2002–2003 and 2004–2005 over Bremen (53◦N).
3 Conclusions
The downward transport of strato-mesospheric CO above 18 km in the winter polar regions, which is strongly influ-enced by the meridional circulation, as predicted by Solomon et al. (1985), can be seen in the FTIR data. The same pattern has also been reported in Kasai et al. (2005) using ground-based FTIR and in studies using ground-ground-based microwave instruments (e.g. Aellig et al., 1995; Forkmann et al., 2003). The strong gradient showing a maximum in winter and min-imum in summer are well captured by the measurements and verified by the model. We showed in this study that this fea-ture is generally not observed in mid-latitude stations. This is in agreement with the VMR profiles shown by Dupuy et al. (2004) using data from the sub-millimeter radiome-ter instrument on board the Odin satellite. Although they showed zonal means only for 2 different days (7 August and 18 November 2001), it was shown that the enhancement of strato-mesospheric CO occurs mostly in the high latitude re-gions.
Jan Mar May Jul Sep Nov Jan00 0 0.1 0.2 0.3 0.4 0.5 0.6 0.7 0.8 0.9 1 Months of Year 1999
Partial Columns / Column Amount from 18 km to TOA
Relative Contributions to the CO Partial Columns from 18 km to TOA
18−26 km 26−36 km 36−46 km 46−56 km > 56 km
Fig. 6. Relative contributions of each layer to the column above 18 km calculated from the model. The contributions are calculated from the CO partial columns coming from a certain layer divided by the total columns above 18 km. These curves indicate where the signal should come from. In winter, most of the CO partial column above 18 km is dominated by the CO coming from above 56 km and from the 26–36 km layer. This is also the time when the downward transport from the mesosphere is strongest. In summer, the column above 18 km is dominated by CO at 18–26 km where CH4oxidation
plays a significant role in the production of CO.
CO in the mesosphere is influenced by the competition be-tween downward transport from the thermosphere and OH oxidation. The FTIR measurements show that the pattern of the strato-mesospheric CO columns for all years in one station are almost similar. We assign this to CO having a shorter lifetime compared to the downward vertical transport in the mesosphere-stratosphere during the measurement pe-riods. On the other hand, the data from the average curves suggest that, partial column amounts in the Arctic spring are slightly higher than in the Antarctic spring. For now, we speculate that this could be due to the subsidence being stronger in the Arctic than in the Antarctic. However, we still could not say much for the periods with very scarce or no measurements. In winter, the intra-seasonal and inter-annual variability in of mesospheric CO alone is large, according to Forkmann et al. (2003). From two years of observations, they reported CO columns above 60 km in the winters (defined as November–March) of 2001–2002 to be twice larger than the previous year. We could not completely confirm this yet from the FTIR data due to lack of observations. Nevertheless, fill-ing in this information gap for the future is another challenge for the FTIR
Comparisons with a global two-dimensional photolysis, chemistry and transport model in the stratosphere and meso-sphere were shown. The assumption in the model that all the CO2in the thermosphere is converted into CO via photolysis
5 10 15 x 10 16 Molecules/cm 2 CO Columns > 18 km Lauder Bremen 2002 2003 2004 2005 1 2 3 4 x 10 16 Molecules/cm 2 CO Columns < 18 km Years CO Partial Columns
Fig. 7. CO columns above and below 18 km from the two mid-latitude stations: Bremen 53◦N (red squares) and Lauder 45◦S (blue dots).
has been shown to be reasonable for this study. Despite the very simple assumptions in the model, the agreement with the FTIR is quite good, especially in the high latitude re-gions. According to the model, the production of CO from CH4oxidation in the mid to upper stratosphere could result
to a signal indicated by the “summer bulge” in the FTIR data seen in Ny Alesund, Poker Flat and occasionally in Kiruna and Arrival Heights. This will be further investigated in an-other study.
Acknowledgements. V.Velazco wishes to thank Mathias Palm and
Bj¨orn Martin Sinnhuber for helpful discussions and the anonymous referees for reviewing this work. S. W. Wood acknowledges the New Zealand Foundation for Research Science and Technology and Antarctica New Zealand. I. Kramer, T. Blumenstock and F. Hase gratefully acknowledge the Goddard Space Flight Center for providing temperature and pressure profiles via the auto mailer system and Uwe Raffalski from IRF Kiruna for support of FTIR measurements. Y.Kasai acknowledges Yasuhiro Muaraya (NICT), Akiko Kagawa (Fujitsu FIP), and Tsuyoshi Koshiro (Kyoto Univer-sity) for the analysis of the FTIR data and useful discussions. We are grateful to the European Commission via the project UFTIR (contract EVK2-2002-000159) and national financial support by the Helmholtz Association within the virtual institute PEP. Part of the work was supported by the DFG CAWSES program with the project SACOSAT.
1312 V. Velazco et al.: Strato-mesosphere CO measurements by ground-based FTIR
References
Chipperfield, M. P.: Multiannual simulations with a three-dimensional chemical transport model, J. Geophys. Res., 104, 1781–1805, 1999.
Chipperfield, M. P. and Feng, W.: Comment on: Stratospheric Ozone Depletion at northern mid-latitudes in the 21st century: The importance of future concentrations of greenhouse gases nitrous oxide and methane, Geophys. Res. Lett., 30(7), 1389, doi:10.1029/2002GL016353, 2003.
Clancy, R. T., Muhleman, D. O., and Allen, M.: Seasonal variability of CO in the terrestrial mesosophere, J. Geophys. Res., 89(D6), 9673–9676, 1984.
Clerbaux, C., Coheur, P. F., Hurtmans, D., Barret, B., Carleer, M., Colin, R., Semeniuk, K., McConnell, J. C., Boone, C., and Bernath, P.: Carbon monoxide distribution from ACE-FTS so-lar occultation measurements, Geophys. Res. Lett., 32, L16S01, doi:10.1029/2005GL022394, 2005.
Dupuy, ´E., Urban, J., Ricaud, P., et al.: Strato-mesospheric mea-surements of carbon monoxide with the Odin sub-millimeter ra-diometer: retrieval and first results, Geophys. Res. Lett., 31, L20101, doi:10.1029/2004GL020558, 2004.
Farmer C. B., Raper, O. F., Robbins, B. D., Toth, R. A., and Muller, C.: Simultaneous spectroscopic measurements of stratospheric species: O3, CH4, CO, CO2, N2O, H2O, HCl and HF at northern
and southern mid-latitudes., J. Geophys. Res., 86, 5179–5184, 1980.
Forkman, P., Eriksson, P., and Winnberg, A.: Longest ground-based measurements of mesospheric CO, Geophys. Res. Lett., 30(10), 1532, doi:10.1029/2003GL016931, 2003.
Goldsmith, P. F., Litvak, M. M., Plambeck, R. L., and Williams, D. R.: Carbon monoxide mixing ratio in the mesosphere derived from gound based microwave measurements, J. Geophys. Res., 84, 416–418, 1979.
Hase, F.: Inversion von Spurengasprofilen aus hochaufgeloesten bodengebundenen FTIR-Messungen in absorption, Wis-senschaftliche Berichte Forschungszentrum Karlsruhe, FZKA 6512, ISSN 0947-8620, 2002.
Hase, F., Hannigan, J. W., Coffey, M. T., Goldman, A., Hpfner, M., Jones, N. B., Rinsland, C. P., and Wood, S. W.: Intercompar-ison of retrieval codes used for the analysis of high-resolution, ground-based FTIR measurements, J. Quant. Spectrosc. Radiat. Transfer, 87, 25–52, 2004.
Jones, N. B., Rinsland, C. P., Ben Liley, J., Rosen, J.: Correlation of aerosol and carbon monoxide at 45◦S: Evidence of biomass burning emissions, Geophys. Res. Lett., 28(4), 709–712, 2001. Kanamitsu, M.: Description of the NMC global data assimilation
and forecast system, Wea. Forecast., 4, 335–342, 1989. Kasai, Y., Koshiro, T., Endo, M., Jones, N. B., Murayama, Y.:
Ground based measurement of strato-mesospheric CO by a FTIR spectrometer over Poker Flat, Alaska, Adv. Space Res., 35(11), 2024–2030, doi:10.1016/j.asr.2005.04.099, 2005.
Kinnersley, J. S.: The climatology of the stratospheric THIN AIR model, Quart. J. Roy. Meteorol. Soc., 122, 219–252, 1996.
K¨unzi, K. F. and Carlson, E. R.: Atmospheric CO mixing ratio pro-files determined from ground based measurements of the J=1 → 0 and J=2 → 1 emission lines, J. Geophys. Res., 87, 7235–7241, 1982.
Lopez-Valverde, M. A., Lopes-Puertas, M., Marks, C. J., and Tay-lor, F. W.: Global and seasonal variations in the middle atmo-sphere carbon monoxide from UARS/ISAMS, Geophys. Res. Lett., 20, 1247–1250, 1993.
Notholt, J., Toon, G., Stordal, F., Solberg, S., Schmidbauer, N., Becker, E., Meier, A., and Sen, B.: Seasonal variations of trace gases in the high Arctic at 79◦N, J. Geophys. Res., 102(D11), 12 855–12 861, 1997.
Rinsland, C. P., Jones, N. B., Connor, B. J., Logan, J. A., Pougatchev, N. S., Goldman, A., Mucray, F. J., Stephen, T. M., Pine, A. S., Zander, R., Mahieu, E., and Demoulin, P.: Northern and southern hemispheric ground-based infrared spectroscopic measurements of tropospheric carbon monoxide and ethane, J. Geophys. Res., 103(D21), 28 197–28 217, 1998.
Rodgers, C.: Inverse Methods for Atmospheric Sounding: Theory and Practice, Vol. 2, Series on Atmospheric, Oceanic and Plane-tary Physics, World Sci., River Edge N.J., 2000.
Rodgers, C. D. and Connor, B.: Intercomparison of remote sounding instruments, J. Geophys. Res., 108(D3), 4116, doi:10.1029/2002JD002299, 2003.
Rothman, L., Barbe, A., Benner, D. C., et al.: The HITRAN molec-ular spectroscopic database : Edition of 2000 including updates through 2001, J. Quant. Spectr. Ra., 82, 5–44, 2003.
Sander, S. P., Friedl, R. R., Golden, D. M., Kurylo, M. J., Huie, R. E., Orkin, V. L., Moortgat, G. K., Ravishankara, A. R., Kolb, C. E., Molina, M. J., and Finlayson-Pitts, B. J.: Chemical Ki-netics and Photochemical Data for Use in Atmospheric Studies, Evaluation No. 14, JPL Publication 02-25, Jet Propulsion Lab, Pasadena, CA, 2003.
Sinnhuber, M., Burrows, J., K¨unzi, K. F., Chipperfield, M. P., Jack-man, C. H., Kallenrode, M. B., and Quack, M.: A model study of the impact of magnetic field structure on atmospheric com-position during solar proton events, Geophys. Res. Lett., 30(15), 1818, doi:10.1029/2003GL017265, 2003.
Solomon, S., Garcia, R. R., Olivero, J. J., Bevilacqua, R. M., Schwartz, P. R., Clancy, R. T., and Muhleman, D. O.: Photo-chemistry and transport of Carbon Monoxide in the middle at-mosphere, J. Atmos. Sci., 42(10), 1072–1083, 1985.
Velazco, V., Notholt, J., Warneke, T., Lawrence, M., Bremer, H., Drummond, J., Schulz, A., Krieg, J., and Schrems, O.: Lat-itude and AltLat-itude Variability of Carbon Monoxide in the At-lantic Detected from Ship-borne Fourier Transform Spectrome-try, Model and Satellite Data, J. Geophys. Res., 110, D09306, doi:10.1029/2004JD005351, 2005.
WMO (World Meteorological Organization): Scientific Assessment of Ozone Depletion: 2002, Global Ozone Research and Monitor-ing Project, Report No. 47, 498 pp., Geneva, 2003.
Zander, R., Leclercq, H., and Kaplan, L. D.: Concentration of car-bon monoxide in the upper stratosphere, Geophys. Res. Lett., 8, 365–368, 1981.